Home Blog Page 1212

Solana DEX Volume Skyrockets by 45%, Leaving Ethereum in Dust

0

Solana is once again capturing the attention of the crypto community by surpassing Ethereum in weekly decentralized exchange (DEX) volume.

The latest on-chain data shows that Solana’s DEX volume has surged by over 45.74% in the past week, with $7.87 billion processed during this time.

Moreover, the data indicates that Solana processed $1.116 billion in DEX volume over the last 24 hours, a figure it has maintained consistently since September 27. On September 26, the DEX volume for that day reached a monthly high of $1.34 billion.

Solana DEX weekly recored
Solana DEX weekly record

This signals a renewed momentum for the Solana blockchain, which is known for its high-speed, low-cost transactions.

Solana Sees Higher Spike than Ethereum

In contrast, Ethereum’s DEX volume growth over the past week was significantly lower, increasing by only 1.3% compared to Solana’s impressive 45% surge. As of today, Ethereum’s DEX volume stands at $1.02 billion, a notable improvement from the $815 million recorded in previous days.

While Solana has seen a consistent spike in DEX volume over the last seven days, its cumulative figure remains slightly below that of Ethereum, which is at $8.335 billion, despite its relatively flat growth.

Ethereum DEX weekly recored
Ethereum DEX weekly record

This disparity can be attributed to Ethereum’s average daily DEX volume exceeding $1 billion, along with its larger pool of decentralized exchanges, as it remains the leader in decentralized finance. Thus, it typically maintains its usual trend.

On the other hand, Solana has seen below $1 billion in average daily volume until this recent spike, which has now put it back in competition with Ethereum.

Solana DEXs Contributing to Uptick

Also, Solana has fewer DEX platforms compared to Ethereum. Leading the pack is Raydium, which experienced a 90% uptick in weekly volume, processing $3.74 billion. Orca follows closely, recording an 18% increase in weekly volume and processing $2.69 billion over the last week.

Other Solana-based DEXs contributing to the network’s metrics include Phoenix, with $783 million in volume, and Lifinity, with $590 million in volume.

Meanwhile, in the Ethereum ecosystem, Uniswap leads with $5.4 billion in volume over the past week, although this figure represents a substantial 4.5% drop during the same period.
Ethereum Foundation, Vitalik Buterin Dump Fresh 749 ETH

0

The Ethereum Foundation and co-founder Vitalik Buterin sold a combined 749 ETH ($1.98 million) in the past 24 hours as their liquidation spree intensified.

According to on-chain data sourced by Lookonchain, the Ethereum Foundation liquidated 100 ETH today, valued at $262,474. The transaction, which happened at 9:41 AM (UTC), saw the address tied to the firm sell ETH for DAI stablecoin at an average price of $2,624 per token.

Further analysis shows that the Ethereum Foundation ramped up sales in September, selling a total of 3,766 ($10.46 million) during the month. For instance, the Foundation traded 100 ETH for $264,000 DAI at an average price of $2,640 per ETH seven days ago.

The asset liquidation came less than three days after selling 300 ETH ($763,000). An earlier report showed that the Foundation converted the ETH to DAI stablecoin at an average price of $2,543 on September 21.

Vitalik Buterin Sends 649 ETH ($1.72M)

The Ethereum Foundation’s sales today preceded 649 ETH liquidation from co-founder Vitalik Buterin. Data shows that a wallet tied to Buterin sent $1.7 million worth of Ethereum to Paxos on September 29 by 7:13 AM (UTC).

The address “0x5567” received 1,300 ETH ($3.35 million) from an address funded by Buterin in 2022. Notably, the wallet received the assets on September 19 and has slowly sent all of them to Paxos at an average price of $2,581.

Despite claiming all his sales were strictly for charity, Buterin has received criticism for his incessant Ethereum liquidation. The co-founder has seen increased on-chain activities recently, selling 950 ETH ($2.28 million) on September 12 and sending the proceeds to the Aave Protocol.

Ethereum Consolidates

Meanwhile, the sales today correlated with a broader market correction. Ethereum has dropped over 1% in the past 24 hours to $2,613 and is down 3.5% from last week’s high of $2.718.

Although related to a broader market consolidation, selling pressure from Ethereum whales may have played a factor in the downturn of the asset. Aside from the Ethereum Foundation and Buterin, Ethereum ICO participants have also recently dumped the asset.

However, bulls have remained optimistic about Ethereum’s uptick potential. Julien Bittel, the head of macro research at Global Macro Investor, has tipped ETH to surge almost 1,000% to $20,000 by January 2025.

Ripple Director Confirms 50% of Ripple’s Digital Asset Payment Flows Go Through Singapore, Not U.S.

0

Fiona Murray, Managing Director for Asia Pacific at Ripple, has revealed that Singapore handles more than 50% of Ripple’s digital asset payment flows. 

Murray made this revelation during a panel session at the recently concluded Token 2049 conference held in Singapore. XRP community figure Eddie, aka “Crypto Eri,” called attention to the statement in a post on X.

During the session, Murray emphasized the growing significane of Singapore as a hub for Ripple’s cross-border payment services. She stated that the U.S. does not play a substantial role in these operations due to regulatory uncertainty.

Singapore Helping Ripple’s Payment Operation

Ripple has established Singapore as a key location for its global payments network. It takes advantage of the city-state’s clear regulatory framework and support for Web3 innovation. 

Murray highlighted Ripple’s Digital Payment Token (DPT) license, granted by the Monetary Authority of Singapore (MAS), as a vital asset that allows Ripple to operate and sell digital tokens legally within the country. 

Notably, the DPT license was granted in October 2023 following a provisional authorization in June. The full approval has enabled Ripple to run its digital payment operations efficiently. These include custody solutions, forthcoming stablecoin launches, and real-time settlement processes, all from its base in Singapore.

Furthermore, MAS’s clarity and support have allowed Ripple to collaborate with some of the world’s largest financial institutions, enabling them to use digital assets like XRP for real-time cross-border settlements. 

Murray noted that Singapore’s stable and transparent regulatory environment and willingness to engage with Web3 companies have been key factors in Ripple’s decision to scale its operations there.

Singapore Takes 50% Flow, US Flows “Not Worth Mentioning”

Murray contrasted this with the U.S. regulatory landscape, stating that the lack of clarity there has stifled innovation. This has driven Ripple to focus more on jurisdictions like Singapore, the UK, Europe, and the UAE, where regulators are more progressive.

“Innovation has moved elsewhere,” she remarked. Murray explained that these regions have partnered with the private sector to create an environment conducive to digital asset development and use.

In this context, Murray emphasized that over 50% of Ripple’s global payment flows through digital assets are routed via Singapore. Conversely, she noted that figures from the U.S. are “not worth mentioning” in comparison due to the significant gap.

“It really does make a big difference to have a forward-thinking regulator,” the Ripple director concluded.

Expert Reveals Shiba Inu Buy Zone, Sets $0.00002421 as Price Target

0

Analysts see Shiba Inu (SHIB) rising in October, as bullish sentiments surrounding the month trigger “Uptober” chants among market participants.

As October, often referred to as “Uptober” by crypto enthusiasts, nears, Shiba Inu is expected to experience a notable price movement. The month has historically seen positive shifts in various cryptocurrencies, and market experts are now pointing to Shiba Inu as a potential benefactor of this trend. 

Past performance, combined with current market analysis, has fueled anticipation that SHIB may see a significant rise in the coming weeks.

Market Analyst Predictions

One of the most recent forecasts for Shiba Inu comes from an experienced market analyst known as SHIB KNIGHT. The expert, a crypto investor since 2017, has identified several key price targets for the meme coin.

According to recent data shared on X, the analyst has pinpointed potential price targets of $0.00002148, $0.00002254, and $0.00002421, with support levels sitting at $0.00001980, $0.00001926, and $0.00001873. The buy zone for larger investors, often referred to as “whales,” has also been highlighted at $0.00001873.

This analysis aligns with the broader trends expected in October, reinforcing the belief that SHIB may experience upward movement. Historically, this period has often seen spikes in the value of Shiba Inu, and market participants anticipate a similar trend as October draws closer.

Historical Patterns Boost Sentiment

Investors looking at SHIB’s historical price performance during the month of October find cause for optimism. In 2021, Shiba Inu recorded an impressive surge of 833%, despite being a relatively young token. The following year, while less dramatic, still showed a 6% rise during October, rebounding from a more volatile September. 

SHIB Price History / Cryptorank

Similarly, in 2023, the token experienced an 8% drop in September but recovered with a 6% gain in October. These historical patterns of SHIB’s price behavior in the fall have led to renewed expectations of another potential price spike this year, particularly in October.

Updated Projections for SHIB by 2030

Looking ahead, Finder, a prominent research platform, has provided updated price forecasts for Shiba Inu. Initially, the group predicted that SHIB could reach $0.0000493 by 2025. However, their latest analysis has adjusted this projection, now suggesting that SHIB may hit $0.000045 by the year 2030. 

Despite adjustments to the timeline, Finder experts still project steady growth for SHIB, with the price expected to reach $0.00001 this year and $0.000025 by 2025. By the end of the decade, they anticipate SHIB will climb to $0.000045.

Analyst Sees XRP at $9.96 as XRP Open Interest Surges To $1.04B

0

XRP led crypto gains over the weekend, with only three assets outperforming it in the top 100 crypto ranking by market cap.

The bullish momentum from XRP has gained steam, driving its price to a six-month high. The XRPL native token has grown over 6% in the past 24 hours, as it currently changes hands at $0.652.

Notably, XRP led gains on Sunday, outperforming most cryptocurrencies in the top 100 ranking by market cap. It was only toppled by Bonk and Flare, who gained 29% and 7%, respectively.

Such impressive price performance shows the uptick in bullish sentiments around the sixth-largest cryptocurrency by market cap. XRP has appreciated almost 10% in the past seven days and 14% over the last month, attaining a price mark last seen in March.

Open Interest Hits Five-Month High

Interestingly, XRP’s surging price has seen open interest in the surge to a five-month high. For context, open interest is the number of contracts traders hold at a given time, often reflecting liquidity and market participation.

Per Coinglass, XRP’s open interest surged to $1.04 billion today, showing increased traction for the XRPL native token. Notably, this indicator grew over 46% from $556 million on September 8, surging along with the XRP price.

XRP Open Interest
XRP Open Interest | Coinglass

Meanwhile, other key metrics indicate further indicate bullishness among market participants on the XRP price. Coinglass shows that the long/short ratio stands at 1.0619, signaling that more traders are betting on the asset to see higher prices across exchanges.

Also, trading volume has surged 26% in the past 24 hours to $4.5 billion. These metrics uptick coincide with speculations from notable analysts, who anticipate these bullish sentiments will push XRP to higher prices.

XRP Poised for $9.98: Analyst

Following the uptick, crypto analyst Raajeev Anand has speculated that XRP could surge substantially to prices like $2, $4.2, and even $9.98. These respectively represent 308%, 646%, and 1,535% upticks from the current market price.

Anand noted in an X post that XRP has broken out of a symmetrical triangle, a strong propellant for the higher price expectations. The market speculator also pointed to fundamental analysis, such as the Ripple settlement with the US Securities and Exchange Commission, as a bullish factor.

Another analyst, Jaydee, shared a similar bullish sentiment on the XRP price. However, he based his price uptick analysis on the surging relative strength index (RSI). In an X post, the analyst noted that XRP’s RSI is breaking out of a 7-year trendline.

He says a successful close above that trendline will be “the most bullish thing to happen in the last seven years.”

XRP RSI
XRP RSI

Notably, other analysts have made even more ambitious calls for XRP. Analyst EGRAG called that XRP would hit 31%, while investment firm Linqto discussed the possibility of the token to trade at $1,000.

SUI Recovery Targets $3 Price as TVL Crosses $1B

After hitting a crossroads at $1.74, SUI is anticipating a breakout to $3 as the total value locked (TVL) on the network surpasses $1 billion.

In a recent tweet, the SUI network celebrated a significant milestone: reaching $1 billion in TVL just two years after launching its mainnet. As a rapidly growing network, SUI positions itself as a potential competitor to Solana and other established platforms.

With the bull run in altcoins gaining momentum and approaching the psychological $2 mark, this recent achievement enhances overall sentiment around SUI. Will this burgeoning network drive the SUI market price to a new all-time high? Let’s explore.

SUI Reversal Run Crosses $1.50

Over the past four weeks, the SUI token has registered a bullish trend in motion. It has increased by 133%, challenging the 78.60% Fibonacci level at $1.7454. 

SUI Price Chart
SUI Price Chart

The recovery rally forms a rounding-bottom reversal on the weekly chart, with a neckline near the $1.20 psychological level. This pattern is clearer on the daily chart.

On the daily chart, the SUI token exhibits a robust bullish rally. The recovery trend indicates strong bullish momentum, resulting in a bullish crossover between the 100-day and 200-day EMA.

SUI Price Chart

SUI Price ChartHowever, recent resistance near the 78.60% Fibonacci level raises the possibility of a double-top pattern as buyers face challenges in achieving a breakout. Currently, the SUI token is trading at $1.7388, with an intraday pullback of 1.19%, indicating some bullish weakness.

Additionally, the MACD indicator suggests that the MACD line and signal line are approaching a potential bearish crossover.

Will SUI Price Top $3?

Based on Fibonacci levels, a continuation of the uptrend to complete the rounding-bottom pattern could see the price reach the $2.07 mark. A bullish breakout could position the $3 mark as a potential target in October.

On the flip side, crucial supports for the altcoin are present at 61.80% and 50% Fibonacci levels at $1.48 and $1.30, respectively. 

Trader Nets Massive 181% ROI After 2-Year Bitcoin HODL, Pockets $17.5M

0

A Bitcoin trader sold a significant amount of BTC, making substantial profits after holding for two years.

The weekend saw Bitcoin surge past the $66,000 mark, continuing its upward trajectory from previous gains. However, by Monday, the market experienced a notable shift.

In a span of hours, Bitcoin’s price dropped by $2,000, falling back to $64,200. This sudden correction follows several days of sustained growth, with the asset holding above $65,000 before the decline.

Despite this dip, Bitcoin’s long-term price performance remains impressive. The crypto has particularly surged by 136.2% over the past year, providing substantial gains for long-term holders.

Trader Capitalizes on Bitcoin Gains

One trader, in particular, made significant profits from Bitcoin’s yearly rise. According to data from Lookonchain, the trader sold 265.89 BTC, worth $17.5 million, realizing a profit of $11.28 million.

This sale occurred today after Bitcoin’s sharp decline, indicating that the trader strategically capitalized on Bitcoin’s earlier gains. The trader originally purchased 265.89 BTC at $23,443 each two years ago, making an 181% profit on the sale.

Image
Trader selling after two years hold

This case is not unique; other long-term holders have also begun to profit. For example, a September 20 report noted that miner wallets inactive for over 15 years moved a total of 250 BTC, worth approximately $15.9 million. These wallets received 50 BTC per block as mining rewards in 2009 when Bitcoin was priced at just $0.0009.

Profitability Metrics for Holders

Analysis by IntoTheBlock highlights that a significant portion of Bitcoin holders remains in profit. According to the “Global In/Out of the Money” metrics, most Bitcoin addresses acquired the cryptocurrency at prices below its current level of $63,318.82. A majority of holders bought at ranges between $18,986 and $51,156, benefiting from Bitcoin’s price appreciation over time.

BTC IOM Analysis / IntoTheBlock

Conversely, fewer addresses are holding Bitcoin at a loss, as indicated by red zones in the analysis. These addresses acquired Bitcoin at prices between $62,010.99 and $72,500.92, placing them out of profit given the current market value.

Notably, many of these buyers entered during Bitcoin’s peak, but as the current price remains lower, they are holding at a loss.

Crypto Investment Products Record $1.2B Inflow as Streak Extends to Three Weeks

0

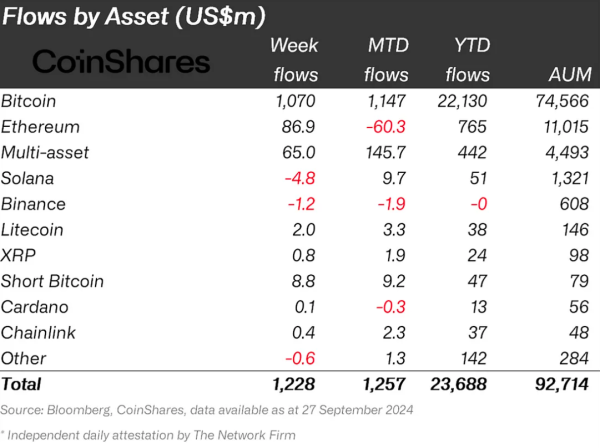
Inflows into crypto investment products continue for the third week, as funds attract $1.2 billion, the highest figure since July.

A weekly report from CoinShares shows that digital assets saw an inflow of $1.2 billion last week amid increased investor traction. This marked the third consecutive week that crypto investment products saw an inflow and the highest since the third week of July.

Per the report, the surging inflows were congruent with the favorable macroeconomics in the United States. For context, the Federal Reserve System (Fed) recently reduced interest rate by 50 basis points (bps), as inflation woes prevailed. This action spread dovish sentiments among investors, driving exposure to digital assets like Bitcoin.

Furthermore, the inflows were also associated with the approval of options contracts for certain US Bitcoin spot ETFs. For context, the US Securities and Exchange Commission (SEC) approved the options trading on the BlackRock iShares Bitcoin Trust (IBIT) on September 20.

The inflows between September 23 and 29 saw the assets under management (AUM) of crypto products increase 6.2% to $92.7 billion. However, trading volume on these investment vehicles declined 3.1% week-to-week.

Bitcoin, Ethereum Shines

Expectedly, Bitcoin led the inflows into the investment products last week, attracting $1.07 billion from investors. Notably, flows into the investment vehicles for the premier asset saw a 73% uptick from last week’s $284 million, signaling renewed traction for the products.

Meanwhile, Ethereum ETPs saw a break in negative trends last week, with the products recording their first net inflow in five weeks. The funds recorded an inflow of $87 million, reducing their deficit month-to-date to $60 million.

Notably, investment products for other altcoins saw mixed reactions. Investors dumped $4.8 million and $1.2 million from Solana and Binance Coin (BNB) funds, while that of Litecoin and XRP saw inflows of $2 million and $800,000, respectively.

Flows by Asset
Flows by Asset

It also bears mentioning that BlackRock led inflows last week among issuers, raking in $594 million through its Bitcoin and Ethereum ETFs. Fidelity and Ark 21 Shares’ ETFs saw a net inflow of $206 million and $269 million, while Grayscale sold $117 million worth of its holdings.

US Dominate Inflows

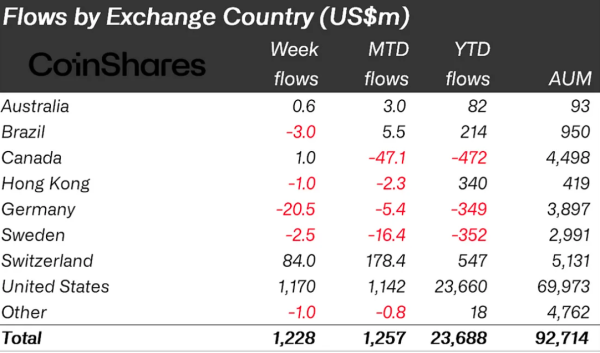
With Bitcoin holdings among US ETFs surging last week, the country led regional inflows into crypto ETPs. Coinshares’ weekly report shows that US-based ETPs saw an inflow of $1.2 billion the past week.

Other notable inflows came from Switzerland and Canada. Switzerland recorded its highest inflows since mid-2022, with an $84 million positive flow, while $1 million flowed into ETPs in Canada.

Flows by Country
Flows by Country

Meanwhile, Germany, Brazil, and Sweden recorded a combined outflow of $26 million, with Germany alone accounting for 79%.


Shiba Inu Could Register Triple-Digit Gains Next Month: Here’s Why

0

Shiba Inu could continue its uptrend in October, with historical data suggesting that SHIB could witness a surge of 283% next month.

SHIB left many market participants in awe after it recorded an outstanding rally of over 52% to hit a three-month high of $0.00002156. This remarkable price surge put Shiba Inu in the limelight with top entities like Grayscale Investments and Robinhood recognizing it as one of the biggest gainers in the crypto market.

It is noteworthy that Shiba Inu has experienced a massive correction ever since, currently trading at $0.00001869. Nonetheless, historical data suggests that the dog-themed token could resume its rally by next month. 

Shiba Inu’s October Performance 

For context, Shiba Inu, like the rest of the crypto market, typically experiences remarkable performances in October. The month of October, popularly referred to as “Uptober” within the crypto community, has led to huge price spikes for Shiba Inu.

Data from CryptoRank confirms this trend, indicating that Shiba Inu has ended well every October since the asset launched in 2020. According to the data, Shiba Inu recorded an outstanding rally of 833.6% in October 2021, the same month when SHIB registered an all-time high of $0.00008616.

Although SHIB did not experience a similar price surge in October 2022 and 2023, it still ended these months in green. Notably, Shiba Inu witnessed double-digit gains of 10.45% in October 2022. However, the token slightly increased by 6.04% the following year.   

Shiba Inu Could Spike 283% Next Month to $0.00007165

Given Shiba Inu’s incredible performance in October over the past three years, CryptoRank data confirms that SHIB has an average growth rate of 283.4% and a median return of 10.4%. If Shiba Inu witnesses a growth of 283.4%, SHIB’s price could surge to $0.00007165 from the current level of $0.00001869. 

A portfolio of 100 million SHIB tokens, currently valued at $1,869, would be worth $7,165 at the projected price. It remains unclear whether Shiba Inu could soar 283.4% in October to $0.00007165. Nonetheless, Shiba Inu enthusiasts expect next month to be positive for the cryptocurrency.

This confidence emanates from reports suggesting that the team behind the Shiba Inu project is planning to introduce “something big” to the ecosystem. In a September 19 post, famous YouTuber Raajeev Anand said Shiba Inu’s lead developer, Shytoshi Kusama, informed him that the next two weeks will be interesting for SHIB. When asked for details, he disclosed that the team wants to introduce “something big in Q4 2024.”

The $0.00007 Projection 

Meanwhile, several analysts have issued multiple projections, forecasting that SHIB could soon rally toward the $0.00007 price territory. 

In May, popular market observer Ali Martinez identified the formation of a bull flag on Shiba Inu’s daily chart. The expert, who acquired some amounts of SHIB around the $0.00001834 level, speculated that he expects a bullish breakout that could take Shiba Inu’s price to $0.00007232.

Also, on June 14, another expert Mehrhpm forecasted that Shiba Inu could experience a significant surge to $0.000075 if it records a daily close of $0.000026.  

FTT Soars Nearly 60% Amid $16B Repayment Rumors, Targets $2.76

A surge in sentiment and trading volume has led to a sudden shift in FTT, breaking the $2 barrier. Will the uptrend continue?

As the market anticipates a breakout run and an altcoin season, the FTX exchange is back in the news. Rumors of FTX settling its $16 billion repayment have boosted FTT sentiment, fueling a post-retest rally of almost 60%.

With rumors of a $16 billion influx in the crypto market, will the FTT uptrend continue to scale new heights?

FTT Breakout Run Crosses $2

The FTT token has broken out of a long-coming triangle, marking the beginning of a bull cycle. Starting with a tweezer bottom at $1.265, the bull run has accounted for a 64.57% jump over the last two weeks.

The streak of bullish candles has surpassed the overhead trendline and crucial daily EMAs, confirming the triangle breakout. A minor drop of 4.28% on Saturday marked a successful retest of the pattern breakout.

FTT price chart

FTT price chartThe post-retest jump led to a massive bullish engulfing candle with a long-wick formation, creating a 24-hour high of $2.94 before closing the day at $2.20.

The pullback continued with a 5.08% drop, with the FTT token trading at $2.03. Despite the pullback, the bullish influence over the 50-day EMA teases a bullish crossover with the 100-day EMA.

The $16B Repayment Rally

The excitement surrounding a potential settlement of the $16 billion repayment to creditors has propelled the FTT token. While rumors suggest that the settlement may begin within 24 hours, official distribution dates have yet to be confirmed.

Market observers are looking ahead to the upcoming Omnibus hearings scheduled for October 22, November 20, and December 12, which could mark significant repayment dates.

FTT Short-term Targets

Based on the short-term price action analysis, the trendline breakout puts multiple targets on the upside. With the immediate support at $2, a bullish continuation will target $2.26, $2.53, and $2.76.