Home Blog Page 1225

Bitcoin Faces 200D-SMA Test Again as Analysts Watch for Breakout

0

Bitcoin tests the 200D-SMA for the third time since August, with analysts monitoring for a potential bullish breakout.

After briefly dipping below $63,000, Bitcoin’s resurgence toward $64,000 has sparked renewed interest, particularly as it confronts a critical technical level: the 200-day Simple Moving Average (200D-SMA). 

200D-SMA: A Persistent Barrier

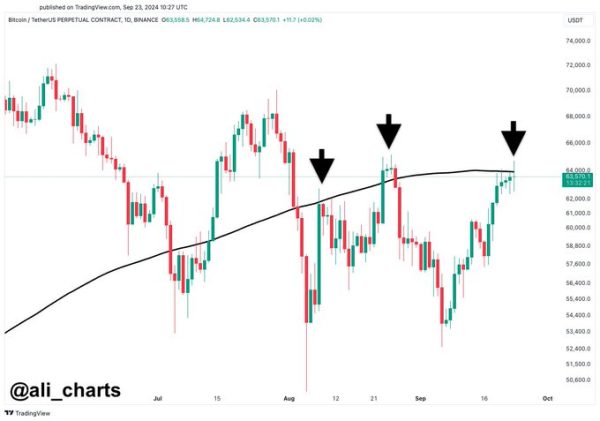
According to an observation by Ali Martinez, an expert analyst, the 200D-SMA has proven to be a significant resistance level for Bitcoin. In mid-August, the first test of this moving average resulted in a rejection, causing a subsequent price decline. This showed its role as a formidable barrier.
BTCUSD 1-Hour Chart / TradingView

A second test in late August to early September saw another rejection, as Bitcoin struggled to break through this technical hurdle.

Now, with Bitcoin once again testing the 200D-SMA in mid-September, analysts are cautious yet hopeful. Per Martinez, a successful break above this level could signal a potential bullish shift, marking a crucial turning point for the crypto’s short-term outlook.

Parallel Market Trends 

In yet a separate bullish post by Martinez, the analyst’s observations reveal notable parallels between Bitcoin and other major assets like Gold and the S&P 500.

Both assets have recently exhibited bullish trends following extended periods of consolidation, suggesting a similar trajectory could unfold for Bitcoin. 

Gold’s price surged from $2,300 to over $2,620 after consolidating within a defined range, propelled by strong buying interest. The S&P 500 displayed a similar pattern, breaking out after a consolidation phase and posting significant gains.

Bitcoin’s current price movement, which has fluctuated between $53,500 and $72,000, hints at potential upside if it can overcome its key resistance near $70,000.

Bullish Flag Observed

Further supporting a bullish outlook, technical indicators point to strengthening market dynamics.

John Bollinger, known for the Bollinger Bands, identified a promising pattern on Bitcoin’s weekly chart. A W-shaped formation, nestled within a downward-sloping regression channel, has emerged, often interpreted as a flag pattern. 

This setup typically indicates market consolidation before a continuation of the prior trend. The price has oscillated within the channel, finding support near the lower band, which has led to a bounce back, highlighting robust buying pressure at these levels.

Document Shows SEC Recognizes Speculation Role in Driving XRP Price and Utility

0

XRP community figure Anderson shares a vital document from the SEC v. Ripple lawsuit, showing that the regulator recognizes speculation’s role in driving XRP utility. 

According to Anderson, the SEC understands that speculative trading and speculators are essential in starting up XRP “flywheel,” which enables the token to be integrated into Ripple’s products. 

How Speculation Drives XRP Utility and Price 

Notably, Anderson attached a document from the Ripple lawsuit to corroborate his claim. Per the document, the SEC cited an email Ripple CEO Brad Garlinghouse sent to board members on April 9, 2017. 

Per the SEC, Garlinghouse told Ripple’s board members that a recent surge in XRP market activity and price was a crucial development for the company in the previous quarter. 

According to the SEC, the Ripple CEO emphasized that speculative trading and market volume create the necessary liquidity for the company’s intended use for XRP, potentially serving as major catalysts for the token’s flywheel. 

Reacting, Anderson said he does not understand why the SEC raised the matter as its argument. Nonetheless, the popular community figure stated that a significant surge in XRP price driven by speculation and substantial trading volumes would contribute to the token’s use in Ripple’s payments product, like On-Demand Liquidity (ODL). 

Speculations Surrounding XRP Use in ODL 

Although XRP has already been integrated into ODL, there are speculations that Ripple could replace the token with its upcoming RLUSD stablecoin.

Despite Ripple refuting this claim, some community members still believe the stablecoin would ultimately replace XRP in the cross-border payment solution. 

However, Garlinghouse’s comments, as cited by the SEC, indicate that the company could continue to use XRP in its products as it witnesses tremendous price spikes fueled by speculation and market trading volumes. 

XRP Underperforms as Appeal Deadline Nears 

In the meantime, XRP is changing hands at $0.5896, with a 24-hour volume of $908.68 million. At the current price, XRP is up 0.09% in the past 24 hours and 0.25% in the weekly charts. 

Although XRP’s recent performance has not been impressive, enthusiasts are confident that things could take a dramatic turn if the Ripple lawsuit does not go to appeal. Currently, the parties have less than two weeks to notify the Second Circuit about whether they plan to appeal, with the deadline set for October 7. 

Analyst Identifies the Only 3 Resistance Levels Stopping an XRP Uptrend

0

With bullish momentum swelling around the XRP market, crypto analyst Mr. Xoom has stated what he believes are the only three resistance levels hindering an uptrend.

In a tweet on Monday, Xoom insinuated that XRP needs to topple a few more levels to reach new highs. He stressed that there were just three major resistance levels that XRP needed to break to reach a new all-time high.

Xoom Points to Major Resistance Levels

According to Xoom, XRP’s major antagonistic levels were $0.65, $1.6, and its all-time high at $3.35. A sustained break above any of these levels could easily see XRP’s price surge to new levels.

However, Xoom argued that the aforementioned resistance levels were notable roadblocks, implying there might be small bumps for the altcoin between those levels. He insisted XRP would only face “a real fight” in these levels.

Notably, XRP has struggled to breach the $0.65 resistance for some time now. It has failed to sustainably trade above the price mark despite a short-lived surge to $0.93 in July 2023. The asset made an attempt at the resistance level on Saturday but was pegged back.

Nevertheless, Xoom insinuated that a break above the $0.65 level will see an almost seamless swing to $1.6. At the current market price, XRP will surge over 63% to trade at that level.

Furthermore, if XRP breaks above $1.6, the asset will target another 52% upswing to the $3.35 level, which is its all-time high.

Major XRP Resistance

Levels Amid Anticipated Uptrend

Xoom stressed on these levels a few weeks after stating that XRP was looking like a real treat. The crypto analyst featured a chart where XRP looked to be breaking out of a symmetrical triangle. The price pattern has been forming since the 2021 bullish trend.

Analysts have targeted an XRP price explosion when it finally breaks out from the multi-year triangle, with World of Charts speculating a test of its 2021 bull zenith at $1.9761. A surge of this magnitude would entail a 336% uptick from its current market price.

Meanwhile, XRP corrected over 3.5% after the rejection at $0.6 over the weekend, trading at $0.588. The asset is down less than 1% in the past 24 hours amidst a wider market correction.

Analyst Sees Bitcoin Following Bullish Breakout Trends of Gold and S&P 500

0

Recent market analysis suggests Bitcoin may mirror the upward trends observed in Gold and the S&P 500 Index after its current consolidation phase.

Analysts, including Ali Martinez, have highlighted similar patterns between these asset classes, indicating Bitcoin might soon see a significant price surge toward its all-time high.

This observation comes as both Gold and the S&P 500 have shown substantial bullish movements following periods of market indecision.

Gold and S&P 500

The charts for Gold and the S&P 500 reveal clear upward trajectories following consolidation phases. Gold’s price climbed this month sharply from $2,300 to $2,621, with notable buying pressure emerging after a consolidation period between $2,290 and $2,460. The breakout occurred around $2,470, driving the price upward with minimal resistance.

Similarly, the S&P 500 Index experienced a consolidation phase between $5,600 and $5,668 before breaking out past $5,668, leading to a spike to $5,702. These movements highlight how sustained consolidations can trigger substantial upward trends once resistance levels are breached.

The breakout patterns in Gold and the S&P 500 have prompted Martinez to speculate that Bitcoin could follow a similar path. 

Bitcoin’s Volatility and Breakout Potential

Bitcoin’s chart reflects a more volatile price action compared to Gold and the S&P 500, with fluctuating prices currently hovering around $63,000. After experiencing a significant drop to $52,000, Bitcoin rebounded, trading between $53,500 and $72,000.

Despite recent volatility, Bitcoin appears to be recovering from its latest dip, maintaining momentum that may lead to a breakout above the $70,000 resistance level.

If Bitcoin manages to sustain its current momentum and surpass the $70,000 mark, it could align with the bullish trends seen in Gold and the S&P 500.

Martinez believes this coordinated movement across these asset classes suggests a potential for Bitcoin to achieve similar upward momentum, reinforcing its long-term bullish outlook.

BTC/Gold Ratio Highlights Further Upside

Further reinforcing Bitcoin’s bullish outlook, market expert Peter Brandt recently analyzed the Bitcoin-to-Gold (BTC/GLD) ratio, suggesting that Bitcoin could eventually reach 123 ounces of gold per Bitcoin. Brandt identifies an inverted head and shoulders pattern in the ratio, positioning the neckline around 32.5 ounces. 

This pattern, typically viewed as a bullish indicator, suggests that Bitcoin’s trajectory could continue upward if it breaks past this critical resistance. Brandt’s analysis also highlights the possibility of a brief pullback before a significant rally unfolds.

Analyst Expects XRP Macro Wave 5 to Surpass $3.4 as Fib. 1.618 Support Holds

0

XRP continues to defend the pivotal support at Fibonacci 1.618 despite the market uncertainty, with the ongoing Wave 5 expected to lead to double digits.

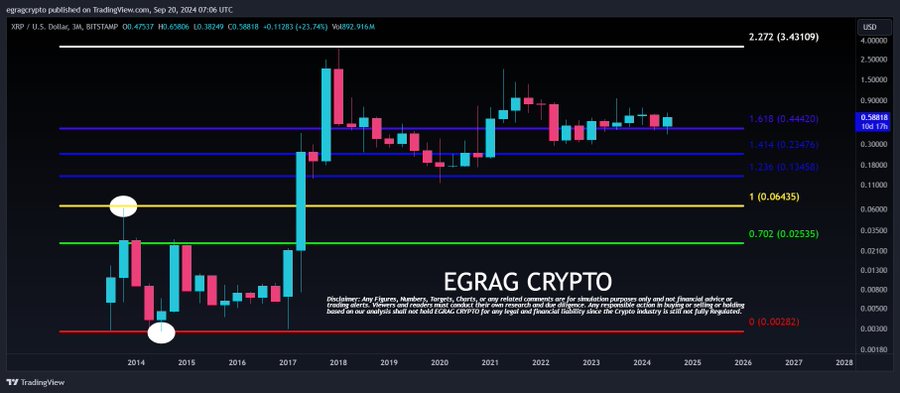
Crypto analyst EGRAG discussed this in a recent analysis of XRP’s price movements over a 3-month timeframe. The market watcher stressed the importance of the support level of Fibonacci (Fib) 1.618, which XRP has successfully maintained despite market volatility. 

Fibonacci Levels Indicating Strong Support

From an accompanying chart, EGRAG showed that the Fibonacci 1.618 support aligns with the $0.4442 price level which is crucial for XRP’s support. The last time XRP retested this level was during the broader market collapse in July. Following the retest, XRP recovered sharply.

XRP 3M Chart EGRAG
XRP 3M Chart EGRAG

However, EGRAG stressed that if XRP fails to maintain this level on the monthly timeframe, the consequences could be detrimental, likely leading to a dramatic price drop. However, the current price action shows that XRP is comfortably holding this level, hinting at potential gains.

Besides the 1.618 support, EGRAG’s chart also highlights additional Fibonacci levels like Fib 1.414 at $0.2347 and Fib 1.236 at $0.1345. Meanwhile, the upward Fibonacci target on the chart, at Fib 2.272 ($3.4), aligns with XRP’s all-time high from January 2018.

XRP Elliott Wave

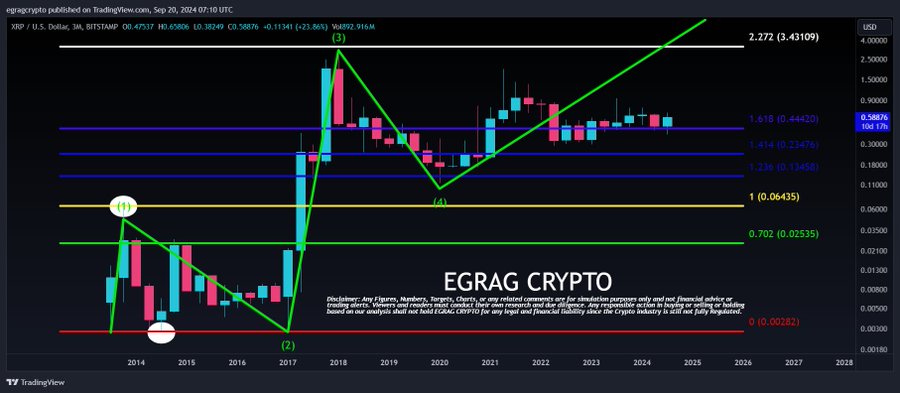
Beyond Fibonacci levels, a second chart from EGRAG discusses an Elliott Wave structure, outlining the long-term price movements of XRP.  Per the chart, XRP has been completing a series of waves since its inception, with the current positioning indicating the completion of Wave 4 and the early stages of Wave 5.

XRP Elliot Wave Structure EGRAG
XRP Elliot Wave Structure | EGRAG

Looking back, XRP completed the Wave 1 formation when it spiked to a peak of $0.0614 in 2013. However, this surge preceded a sharp decline in XRP’s price, leading to Wave 2. XRP concluded the second wave when it retraced to a bottom price of $0.003 in January 2017.

Meanwhile, Wave 3, the most bullish phase, began when XRP started recovering from the $0.003 floor price. As XRP staged the most impressive comeback in its history, Wave 3 took XRP to its all-time high of $3.4 in January 2018. 

However, XRP entered a correction phase after hitting a roadblock at the all-time high. Since then, the crypto asset has been in a consolidation phase, forming a six-year symmetrical triangle. The drop led to the formation of Wave 4, with XRP bottoming out at $0.114 in January 2020.

XRP Could Target $3.4

The Elliott Wave structure now indicates that XRP is currently trading within Wave 5, which historically tends to be a bullish phase, signaling new price highs. Wave 5 began with the rebound from the $0.114 low. EGRAG noted that this wave would push XRP to double-digit targets but was not specific. 

However, based on the Fibonacci projection, Wave 5 could take XRP to new all-time highs. The chart’s top target at Fib 2.272 ($3.4) suggests that XRP could challenge its previous peak, with potential to surpass it, considering the market conditions during the final bullish wave.

Expert Says Prepare for XRP Violent Crash as Weak Trendline and Extended Distribution Spell Trouble

0

Seasoned analyst Jackis, who has been active in financial markets for a decade, recently issued a stark warning regarding the outlook of XRP. 

In an update shared on X, Jackis argued that XRP could be on the verge of a “violent breakdown.” He cited several technical indicators that suggest trouble for the popular altcoin.

The chart shared in Jackis’s analysis reveals a prolonged distribution phase during which XRP has been trapped in a sideways trading range. Specifically, XRP has been in this pattern for nearly seven years and is nearing a breaking point.

However, market watchers are divided on XRP’s next move. Some argue that this extended period of consolidation implies a violent pump upon a breakout. Meanwhile, Jackis’s analysis suggests a breakdown instead.

Jackis noted that XRP’s current support trendline is “super weak,” having been tested multiple times, which makes it vulnerable. This weakness may indicate that buyers may no longer have the strength to maintain current price levels.

Furthermore, a potential head-and-shoulders pattern observable in the chart further emphasized the bearish outlook for XRP.

“The breakdown will be violent,” warned Jackis. “I highly recommend hedging yourself once this crypto coin crashes.”

Jackis’s XRP chart

This bleak outlook for XRP has drawn significant attention from the crypto community, with some pushing back against his prediction. One X user commented that the potential fallout would be devastating, stating:

“Imagine being stuck holding XRP for years only for it to break down this violently now. That’s scary.”

A Closer Look at Jackis’s Analysis

While the most apparent interpretation of Jackis’s analysis is that he is bearish on XRP, a closer look at the chart suggests he is merely being sarcastic about XRP’s price trajectory.

The graph he shared is actually an inverted historical price chart for XRP. When flipped to the correct orientation, it indicates that the analyst is bullish on XRP.

In particular, he is targeting the $1 price range for XRP in the near future, which is a massive 70% increase from the current price of $0.5895.

Essentially, Jackis’s seemingly sarcastic commentary aims to play into the fantasies of XRP skeptics who see no bullish potential in the token.

Despite widespread skepticism regarding XRP given long-standing underperformance, market analysts are nearly unanimous in predicting a notable breakout in this cycle, even among top critics in the Bitcoin community. 

However, opinions differ on what XRP’s peak price might be. While some are hoping for a price point of $250, others believe that just $2 is a more realistic peak for this cycle.

Firstpost America Reports That Bhutan Has One-Third of Its GDP in Bitcoin

0

A report from Firstpost America confirms that the Kingdom of Bhutan has approximately one-third of its gross domestic product in Bitcoin.

The leading media outlet lauded Bhutan’s silent rise to relevance in the cryptocurrency scene after harnessing its abundant hydropower resources to mine the most valuable crypto asset. Bhutan is currently the fourth-largest government holder of Bitcoin, only behind the US, China, and the UK.

Notably, Bhutan’s GDP for 2023 was $2.9 billion, up 4.5% from the previous year. Of this, 28.6% ($831 million) were proceeds from its crypto mining activities, as the nation reaped bountifully from its diversification into the sector. 

Bhutan’s Secret Rise to Fame

The small Buddhist nation’s silent mining activities have established it as one of the leading holders of Bitcoin. The landlocked country has invested heavily in its mining operations through Druk Holdings and Investment, a state-owned crypto miner.

The Kingdom of Bhutan’s rich hydropower resources and a ploy to diversify its economy drove it into intensive Bitcoin mining. The operations began in 2019 and have seen the Asian country amass 13,093 BTC ($831 million).

Having invested $192 million in mining equipment between 2020 and 2023, the Asian country is poised to continue expanding its capacity. Bhutan’s Druk Holding entered a strategic partnership with Bitdeer to increase its mining input by fivefold to 500MW.

Interestingly, Bhutan is the largest government entity holding Bitcoin if seized assets were excluded. The cryptocurrencies held by the United States, China, and the United Kingdom were the product of seizures and legal battles. However, Bhutan acquired its stash from proactive mining activities and now holds more Bitcoin than El Salvador.

Notably, Bhutan holds other assets in addition to Bitcoin. Data shows it holds 656 ETH ($1.73 million), 53 SAND ($14), and 23.5 MATIC ($9.5), among others.

A Template for Widespread Adoption

Bhutan’s impressive adoption of Bitcoin and its glaring effect have set the pace for national-level adoption of cryptocurrencies. Currently, Bhutan and El Salvador are the only two countries that officially hold cryptocurrencies through willful purchases.

The obvious economic benefits Bhutan and El Salvador have amassed since adopting Bitcoin could encourage more countries with economic conditions like inflation to consider investing in the asset.

MicroStrategy’s Michael Saylor proposed a financial theory in which countries facing economic meltdown could leverage Bitcoin’s growth capacity to solve their problems. He advised countries to refocus their treasury from assets like gold, stocks, and bonds to Bitcoin.

Bitcoin’s inherent ability to grow exponentially is evident, especially for long-term holders. The asset has grown at a yearly average of 218% between 2015 and 2023.

Here’s What to Expect as SEC v. Ripple Lawsuit Enters Grand Finale: Expert  

0

With the SEC v. Ripple lawsuit approaching a critical stage, prominent XRP community figure Zach Rector outlines three events he is anticipating if none of the parties appeal.  

According to Rector, the multi-year lawsuit is in the grand finale stage, with an appeal window closing in less than two weeks, specifically on October 7. 

Rector pointed out that the longstanding legal battle will officially come to an end if neither the SEC nor Ripple files an appeal notice on or before the appeal window closes. 

3 Upcoming Events 

With the lawsuit nearing its conclusion, Rector highlighted three major events that could happen between now and the upcoming Ripple Swell conference.

For context, the 2024 edition of the Ripple Swell conference is scheduled for October 14 – 16 in Faena District, Miami Beach, Florida, United States. 

The upcoming event boasts an impressive lineup of speakers, including Ripple CEO Brad Garlinghouse, Coinbase CSO Philip Martin, NYDFS Superintendent Adrienne Harris, Moonpay CEO Ivan Soto-Wright, Bloomberg ETF Analyst Eric Balchunas, and Archax CEO Graham Rodford. 

Ripple Stablecoin 

Rector expects Ripple to launch its highly anticipated stablecoin (RLUSD) between now and the Swell conference. It bears mentioning that Ripple has made significant progress towards the mainnet launch of the stablecoin. 

The USD-pegged stablecoin is currently in beta testing on both the XRP Ledger and Ethereum networks. Upon its mainnet launch, the stablecoin will be made available for everyone, including retail clients. 

XRP ETF 

Additionally, Rector speculated that he expects a potential XRP ETF announcement at the Ripple Swell conference. Since the SEC approved the launch of spot-based ETFs for Bitcoin and Ethereum, there have been speculations that top asset managers could also launch a similar product for XRP. 

This speculation soared recently after Grayscale launched the XRP Trust, a closed-end fund expected to transform into a spot-based crypto ETF. Nonetheless, the ongoing lawsuit between the SEC and Ripple poses regulatory challenges for XRP.

With the lawsuit expected to end if none of the parties appeal before the October 7 deadline, top asset managers could apply with the SEC to launch an ETF tied to XRP. However, this remains speculative.

Partnerships Centered on Tokenization 

Furthermore, the popular XRP community figure disclosed that Ripple could make other significant announcements during the Ripple Swell conference, including key partnerships centered around tokenization on XRPL. 

He noted that Rodford, one of the conference’s speakers, made bold projections earlier this year, forecasting that the world could see between $30 and $50 trillion worth of assets tokenized on the XRPL. 

The broader XRP community is currently focused on updates about the SEC v. Ripple lawsuit. An appeal would prolong the legal uncertainty. However, if none of the parties appeal before the deadline expires, it would mark the end of the lawsuit, potentially paving the way for more adoption.  

Shiba Inu Consolidation in a Triangle Signals Bullish Breakout to $0.000020

With a bull cycle impending in the four-hour chart, will Shiba Inu give a breakout run to the $0.000020 price level?

With a market cap of $8.52 billion, the Shiba Inu meme coin saw an increase of 8.94% last week. As the recovery run in SHIB gains momentum, the uptrend faces a minor hurdle on the four-hour chart.

Will this breakout rally lead to a domino effect and spark a full-scale bull run in Shiba Inu?

Shiba Inu Teases Triangle Breakout

The four-hour chart indicates that the Shiba Inu price trend is undergoing a recovery rally, but it faces some resistance. A double-bottom reversal from $0.0000130 has propelled the Shiba Inu price upward from a local support trendline.

This recovery run is challenging a confluence of resistance, resulting in a sideways trend. The overhead resistance comprises the 61.80% Fibonacci level, near the $0.000015 psychological mark, along with an overhead resistance trendline.

Shiba Inu Price Chart

Additionally, the converging resistance and support trendlines create a symmetrical triangle pattern on the four-hour chart. The bullish cycle has surpassed the 50, 100, and 200-day EMAs, resulting in a golden crossover, and the 100 and 200-day EMAs are on the verge of a bullish cross.

Will Shiba Inu Price Hit $0.000020?

The Shiba Inu price trend is consolidating above the 50% Fibonacci level at $0.00001427. Currently, it is trading at $0.00001444, with an intraday drop of 0.35% from the opening price of $0.00001448.

The underlying bullish momentum is evident as the four-hour chart’s bull cycle within the symmetrical triangle pattern takes a sideways route. Moreover, the growing RSI divergence suggests a potential bullish comeback, as the negative cycle fails to break the 50-day EMA on the four-hour chart and the 50% Fibonacci level.

With a potential double-bottom reversal, the Shiba Inu price trend could surpass the overhead resistance trendline. Following a bullish breakout, the Fibonacci levels indicate price targets for Shiba Inu at $0.0000160 and $0.00001727.

Optimistically, an extended bull run in Shiba Inu could target the 1.618 Fibonacci level at the $0.000020 psychological mark; however, this will require support from a broader market recovery.

Conversely, the 50%, 38.20%, and 23.60% Fibonacci levels are crucial support levels at $0.00001427, $0.00001356, and $0.00001229, respectively.

Top Analyst Outlines Mathematical Reasoning Why XRP Hitting $20-30 Isn’t Irrational

0

In a recent appearance on Tony Edward’s The Thinking Crypto podcast, prominent analyst Credible made a compelling case for XRP’s potential to surge to $20-30. 

According to Credible, this bullish forecast for XRP is not irrational, as many critics have argued. He provided the mathematical foundations for why such lofty highs are not only attainable but realistic expectations for XRP.

First, Credible emphasized that XRP has been in an unprecedented seven-year consolidation phase, a development not seen with other crypto assets. “No coin has consolidated as long as XRP has,” he said.

He attributed this outcome to the SEC lawsuit that “came out of the blue” when XRP was trading at local highs in Q4 2020. Since then, XRP has struggled to recover. However, the analyst stressed that consolidation is not a sign of weakness.

He believes XRP is merely creating a solid base for future price growth during this seven-year period. “The longer the consolidation, the bigger the expansion,” the analyst remarked.

Furthermore, Credible noted that based on the current market, Bitcoin is about to make a parabolic move and experience the biggest market rise since 2017. 

As a result, he highlighted that it makes no sense to bet on XRP breaking down, especially as the SEC lawsuit is now behind. Essentially, he stressed that the stage is set for XRP to break out of its prolonged sideways movement.

Realistic XRP Targets Once it Breaks

Regarding XRP’s potential high price from the consolidation, Credible said hitting the old all-time high of $3.84 will be the starting point. He believes an all-time high in the double-digit price range is XRP’s destination, noting a minimum of $10. This price level would require an over 16-fold increase from the current price of $0.5858.

Meanwhile, Credible argued that XRP could realistically see further price pushes to between $20 and $30 this cycle. For context, the upper boundary requires an astonishing growth of 5,021% from XRP’s current level.

Mathematical Reasoning Why $30 XRP is “Realistic”

Credible acknowledged the skepticism surrounding his projections, noting that many people initially dismiss his views as irrational. However, he pointed out a common contradiction: when he asks skeptics if they believe in a $10,000 Ethereum, they usually respond affirmatively. He noted that while critics may highlight the differences in token supply, the key focus should be on market cap.

For context, Credible highlighted that while Ethereum is currently priced at approximately $2,630 and XRP at around $0.5858, their market caps are not as vastly different as the price suggests. Ethereum’s market cap stands at about $317 billion, compared to XRP’s roughly $33 billion—a tenfold difference.

Credible explained that if Ethereum were to reach $10,000, it would correspond to a market cap of $1.2 trillion. He noted that a similar cap for XRP would place it above $20. Accordingly, if one believes Ethereum can hit $10,000, it follows that XRP could realistically exceed $20.

Furthermore, he reminded listeners that XRP had previously surpassed Ethereum in market cap, which occurred in 2018.

XRP Outranking Ethereum in 2018

Ultimately, the analyst stressed that should XRP break out of its seven-year consolidation phase, reaching $10 becomes very plausible. If Ethereum achieves a market cap of $1.2 trillion, XRP could reach $24, and even at half a trillion, it would still stand at $10.