Home Blog Page 1273

Here’s How Much Your Investment Would Grow if XRP Reaches ATH of $3.70

0

Market participants could see their XRP investments increase by impressive margins if XRP ever reclaims its all-time high of $3.70.

XRP has continued to face bearish pressure amid the ongoing market uncertainty. While the rest of the market has also suffered similar declines in recent times, with Bitcoin (BTC) dropping below $60,000, XRP’s bearish situation is more concerning due to its earlier underperformance.

XRP’s Underperformance

Notably, from Q4 2023 to Q1 2024, the broader market recorded an impressive uptrend. This uptrend saw BTC breach its all-time high earlier than expected, with altcoins like Ethereum (ETH) and Solana (SOL) engineering impressive gains to recoup most of the bear market’s losses. 

However, XRP failed to record any significant growth within this period. This trend reminded market participants of XRP’s general underperformance in the 2021 bull run, as it failed to reach a new all-time high. Nonetheless, some analysts attribute the 2021 underperformance to the SEC’s lawsuit against Ripple.

They argue that, with XRP now declared a non-security and the SEC lawsuit finally over, XRP could be gearing up for an impressive run, eventually reclaiming its all-time high of $3.70 or possibly overtaking it. 

ROI if XRP Reclaims $3.70 ATH

Amid these speculations, market commentator Crypto Assets Guy recently assessed how much an investor’s XRP stash could increase if XRP witnessed such a surge. Notably, his assessment pointed out the returns that could be in store for investors if they capitalize on the recent XRP drop.

For context, XRP has dropped from the $0.74 yearly peak as the broader market corrects, currently trading for $0.5675. Nonetheless, some see this dip as a proper buy opportunity, expressing confidence in XRP’s ability to engineer a recovery push now that it boasts legal clarity.

Crypto Assets Guy recently pointed out that if a market participant purchases XRP at the current price around $0.56, a surge in value to the all-time high of $3.70 would see such individual’s investment skyrocket by up to 6.6x. Notably, XRP would need to increase by 560.7%, or about 6.607x, from its current price to reach $3.70.

Crypto Assets Guy on X

To put things into perspective, if an investor committed $10,000 into XRP at the current price, they would procure 17,621 tokens. Should XRP rally to reclaim the $3.70 all-time high, the worth of these 17,621 tokens would increase to $65,198, marking an impressive 560% return on investment (ROI). However, it remains to be seen if XRP can pull off this move.

Here’s Cardano Price if It Equals Bitcoin or Ethereum Market Cap 

0

Cardano’s price could rise to unprecedented levels if its market cap equals the valuation of premier crypto assets- Bitcoin and Ethereum. 

Cardano (ADA) has been one of the recipients of the ongoing market bloodbath, which has continued to wreak havoc on crypto prices. Notably, Cardano has recorded a double-digit loss of 11.38% in the past seven days. Also, Cardano has recorded more losses in the monthly charts, totaling 14.03%. 

Despite Cardano’s recent underperformance, investors and market observers have not lost confidence in the asset. They believe Cardano could embark on a remarkable rally someday, equaling the valuation of Bitcoin (BTC) and Ethereum (ETH). These proponents speculate that Cardano is highly undervalued and could achieve this goal if it attracts institutional and corporate clients. 

Although this speculation may seem ambitious, we decided to estimate how much ADA would trade at if it achieved this goal. 

Cardano’s Price If It Equals Bitcoin Market Cap 

For context, ADA is currently trading at $0.3485, reflecting a decline of 1.73% over the past 24 hours. The coin ranks as the 11th largest asset in the global crypto ranking, with a market cap of $12.5 billion. 

ADAUSDT 2024 08 31 07 28 36

On the other hand, Bitcoin remains the world’s largest cryptocurrency, boasting a $1.17 trillion valuation. For Cardano to equal Bitcoin’s market cap, its valuation must surge 9,230%. Supposing Cardano’s circulating supply remains stable at 35,960,643,044 ADA, a 9,230% rally would take its price from $0.3485 to a jaw-dropping $32.5150. 

Notably, several analysts have previously projected that Cardano could surge to the $32 range in its lifetime. In particular, top crypto expert Jason Appleton predicted that ADA’s price would soar to $32 at the peak of this season’s bull cycle. 

Cardano’s Price if it Equals Ethereum Market Cap 

Meanwhile, we also assessed Cardano’s price if the asset’s market cap equaled Ethereum’s. At press time, Ethereum boasts a market cap of $303.6 billion, making it the second-biggest cryptocurrency globally. This suggests that Cardano must rally 2,328% to equal Ethereum’s market cap. 

Applying this 2,328% growth to ADA’s price would see it rise from $0.3485 to $8.46, supposing Cardano’s circulating supply remains stable. 

Cardano community members are not new to the $8 price target as veteran market analyst Ali Martinez made a similar projection earlier this year. 

Uphold Sparks Fresh Prediction of XRP Soaring 6,069% to $35

0

Recently, prominent U.S.-based exchange Uphold, known for its pro-XRP stance, sparked conversations in the crypto community concerning the outlook of XRP for the remainder of the year.

Taking to X, Uphold engaged its audience by asking, “By the end of the year, what will XRP be?” inviting them to fill in the blank. The post has garnered significant reactions from the crypto community.

XRP Projected to $35

Notable XRP community figure Bobby A suggested that XRP could rally above $1 by the end of the year. Several other community members echoed this sentiment, predicting that XRP would approach $1 before 2024, a threshold last seen three years ago.

At press time, XRP is trading at $0.5673, gaining 1.2% over the last 24 hours. However, its weekly performance remains down by 7%. From this level, XRP needs to rise by 76% to reach $1.

X user Amar Daroch speculated that XRP could reach at least $2 by the end of 2024. Another commenter predicted a more ambitious outlook for XRP by the end of the year, suggesting that XRP would become a significant player in the crypto space. 

He expressed optimism that with Ripple’s legal issues resolved, XRP’s role in cross-border payments will advance. The commenter also anticipates that partnerships with major financial institutions will increase, boosting adoption and demand. 

While acknowledging the uncertainty of exact price predictions, he noted that he would not be surprised to see XRP reach $5 by year’s end. Ultimately, this commenter views XRP as a transformative technology for global finance.

Meanwhile, one of the most audacious predictions for XRP by the end of the year resulting from Uphold’s inquiry is a target of $35. For context, XRP would need to rally by 6,069% over the next four months to reach $35, making this outlook highly speculative.

XRP to Tank to $0.25 Before Year End

While some commenters are optimistic about XRP’s prospects by the end of 2024, others have expressed skepticism. X user Pedro remarked that XRP could remain in its current sideways movement for the remainder of the year.

Another even predicted that XRP could crash to $0.25 before 2024 ends. These sentiments highlight the crypto community’s ongoing frustration with XRP’s recent performance.

XRP’s price action since the onset of this bull market has been discouraging. It registered only a 5% gain by the end of the fourth quarter of 2023, which was lost by the end of Q1 2024. During this time, other prominent crypto assets doubled or tripled in price, with some reaching new all-time highs.

Essentially, Uphold’s inquiry into XRP’s outlook for the end of 2024 has elicited mixed reactions, highlighting both optimism and frustration among community members. This move from Uphold comes as community members revisit the exchange’s earlier suggestions concerning XRP reaching $1,000 sometime in the future.

Expert Predicts Timeline for Shiba Inu to Hit New ATH of $0.00023

0

Shiba Inu (SHIB) has been showing signs of potential growth, and market analyst Alan Santana has mapped out a path that could see it reach a new all-time high.

He presented his analysis on TradingView amid the persistent market uncertainty. As depicted in the accompanying chart, Shiba Inu has been in a downward trend. This indicates a market correction phase. 

This phase followed a massive price spike from late February to early March, which saw SHIB hit $0.000045. Notably, the correction phase features falling prices and can be alarming to some investors. However, according to Santana, this is a normal part of the market cycle and often leads to a period of consolidation.

Shiba Inu Accumulation Phase

The chart points out an “accumulation zone,” a phase where the price of Shiba Inu could move sideways after a downtrend. During this period, the market stabilizes, and trading volume typically decreases as fewer market participants are willing to sell at lower prices. 

Shiba Inu 1W Chart Alan Santana
Shiba Inu 1W Chart | Alan Santana

Santana pointed out that this phase is essential for building a solid base for the next upward movement. In his view, this accumulation phase typically involves a lull in activity and can serve as a preparatory stage for a significant bull market. 

He stressed that smart money—seasoned investors and institutions—often accumulates assets quietly during these periods of low prices, waiting for the right moment to capitalize on the next bull run.

The Upcoming Bull Run

For this upcoming bull run, Santana expects a rally that could take Shiba Inu to new heights. He anticipates a breakout from the accumulation zone, where the price will start to form higher highs and higher lows, marking the beginning of a new bull market. 

According to the chart, Santana suggests that the upcoming bull market could propel Shiba Inu to a potential ATH of $0.00023179, a staggering 17.5x increase from its current price. He estimates this could happen by 2025, assuming market conditions remain favorable.

The Perfect Shiba Inu Trading Strategy

Santana went on to discuss the psychology of trading. He warned against trading based on excitement or emotional reactions. Instead, he advised investors to approach the market with a calm and strategic mindset. 

The analyst pointed out that emotional trading, often driven by fear of missing out (FOMO), can lead to poor decision-making. This could involve buying at high prices or selling prematurely during market dips. He advocated for a disciplined approach.

Santana recommended a buy-and-hold strategy for those looking to capitalize on Shiba Inu’s potential growth. He advised buying during the current accumulation phase and holding onto the investment until the bull market fully materializes. 

According to him, the bull market for altcoins like Shiba Inu can last several months, providing ample opportunity for investors to plan their exits and maximize profits. Meanwhile, at press time, SHIB trades for $0.00001397, up 0.21% over the past 24 hours.

Early Shiba Inu Whale Dumps 255B SHIB for FET: Details

0

An early Shiba Inu whale, who made astronomical gains in the 2021/2022 market cycle, shifts part of their SHIB investment to FET.  

The development was shared by prominent blockchain analytics platform Spot on Chain today, emphasizing that the decision has started paying off. 

Transaction Details 

According to Spot on Chain, the unknown whale had swapped 255.62 billion SHIB (worth $3.5 million) for 3.114 million FET over the past 10 hours. Interestingly, the investor’s decision to exchange some of their SHIB holdings for FET appears to be a smart move, as the price of FET pumped by 14% shortly after that. 

Despite swapping over 255 billion SHIB for FET, the unknown whale still holds 713 billion SHIB, valued at $10 million. It remains to be seen whether the investor will continue to swap more of their SHIB holding for FET or other crypto assets. 

Insight into the Whale’s Shiba Inu Activity 

For context, the whale had been an early Shiba Inu investor since 2021. Spot on Chain revealed that the unknown whale first traded SHIB from February 2021 to June 2022, making a remarkable profit of $145 million. 

However, they took a break from accumulating Shiba Inu for two years and only resumed buying SHIB on June 5, 2024. At the time, this whale swapped 4,849 ETH (worth $18.5 million) for 715.8 billion SHIB. This single transaction caused the price of Shiba Inu to spike by 4.6%, according to Spot on Chain. 

Unlike the investor’s first SHIB trade, their recent investment in the dog-themed token has not gone as expected. Spot on Chain claimed the investor had recorded an unrealized loss of $11.51 million, marking a 45.9% decline from their second SHIB trade since June. Hence, the investor chose to recoup some losses by swapping some of their SHIB holdings for FET. 

So far, the investor has purchased a total of 9.257 trillion SHIB and sold 8.544 trillion SHIB, leaving them with a holding of 713 billion tokens. 

Spot on Chain
Spot on Chain

In the meantime, the price of FET has risen 7.33% over the past day to $1.19. Conversely, SHIB has declined 0.47% in the same timeframe to $0.00001399. 

XRP Bollinger Bands Suggest Looming Upsurge as Volatility Drops Below 2017 Levels

0

Market analyst Mikybull confirms that XRP Bollinger Bands volatility has slumped below the 2017 levels, suggesting an imminent upside push.

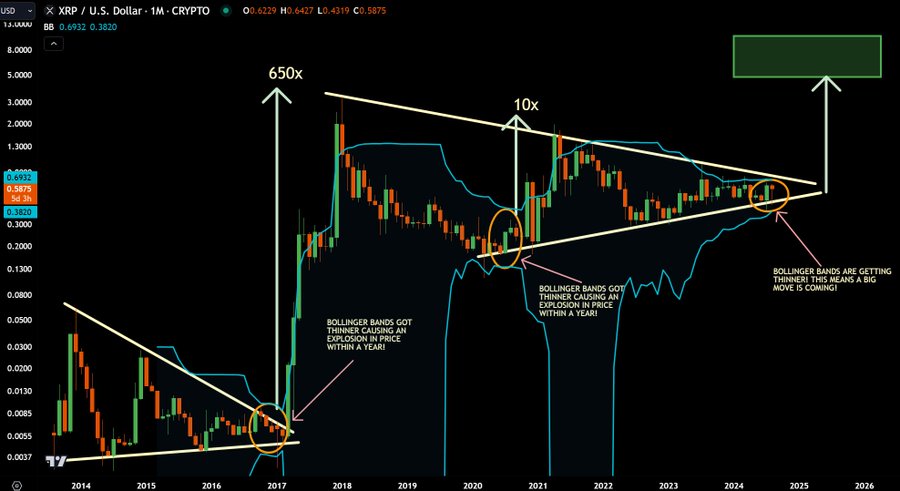
The market watcher disclosed this in a recent analysis, sharing a chart that highlights XRP’s historical price patterns since 2014. Per market data, that chart leverages Bollinger Bands to visualize the volatility levels of XRP over this period. 

Notably, the bands have contracted significantly, narrowing more than they did during the 2017 rally. This pattern indicates an unprecedented reduction in volatility.

According to Mikybull, the current volatility level of XRP has fallen below the levels seen in 2017. Interestingly, this is particularly significant as the last time such low volatility was observed, XRP experienced a dramatic breakout and subsequent rally. 

XRP Bollinger Bands Mikybull
XRP Bollinger Bands | Mikybull

For context, XRP collapsed to a low of $0.005 in February 2017 despite the broader crypto market witnessing the pre-bull run rally. However, following the drop in volatility, as indicated by the Bollinger Bands, XRP recovered, surging to the new all-time high of $3.31 in January 2018.

Mikybull’s chart confirmed that this reduction in volatility is often a precursor to a significant price move. The analysis suggests that a similar scenario could unfold in the near future, indicating a potential bullish breakout for XRP akin to the explosive rallies in 2017 and 2020.

Supporting Analysis on Bollinger Bands

Meanwhile, JD, another notable market analyst, corroborated Mikybull’s analysis, stressing that “great minds think alike.” JD pointed to a previous analysis he made on the same price movements four days ago, suggesting that XRP is on the verge of a massive upsurge.

JD also focused on the tightening of Bollinger Bands and its implications for future price movements. According to him, in previous market cycles, the contraction of the Bollinger Bands has consistently been followed by substantial price increases. 

XRP 1M Chart JD
XRP 1M Chart | JD

His chart spotlighted two significant points in time — 2017 and 2020 — where a similar narrowing of the Bollinger Bands occurred, leading to exponential gains of up to 650x and 10x, respectively, within a year.

JD also called attention to a pattern of symmetrical triangles formed by connecting key price points over the years. These triangles, combined with the tightening Bollinger Bands, suggest that XRP is currently in a phase of consolidation, which historically has been a setup for major price moves. 

Notably, if XRP replicates half of any of its previous rallies, its price could hit greater heights. For instance, half of the 2020 upsurge, amounting to 5x, would put the asset’s price at $2.85. Meanwhile, recording half of the 2017 rally would put XRP’s upsurge at 325x, leading to a $185 price.

Market Analyst Explains How XRP Could Hit $190 to $250

0

A market analyst suggests XRP is capable of skyrocketing to triple-digit figures, potentially becoming the most valuable asset globally.

The Block Bull proposes that XRP could reach between $190 and $250 sometime in the future. While this target has triggered skepticism, the market analyst recently outlined how he believes the goal could be achieved.

Possible Factors Behind XRP’s Projected Surge to $250

He based the prediction on a series of developments and anticipated market movements. One key factor is the recent conclusion of Ripple’s legal battle with the U.S. Securities and Exchange Commission (SEC). 

Judge Analisa Torres ordered Ripple to pay a $125 million fine for violating securities laws through its past institutional XRP sales. This ruling brings a degree of legal clarity to XRP and potentially sets the ground for greater institutional adoption.

The Block Bull argues that once Ripple settles the fine, XRP could hit $4 within three weeks, leveraging the positive sentiment and renewed investor confidence. This would mark a 565% price surge.

Looking ahead, the analyst believes that XRP could reach a minimum of $27 by 2025. Meanwhile, he argued that the potential for three-digit prices depends on the role XRP could play in the global financial system, particularly in managing the $10.8 trillion locked in nostro and vostro accounts globally. 

These accounts, used by banks to facilitate international trade, require huge amounts of liquidity, which XRP could provide if it becomes widely adopted as a bridge asset. According to The Block Bull, this adoption could push XRP’s price to between $190 and $250. Analyst Javon Marks has also persistently predicted the $200+ target.

However, reaching such astronomical prices would require an influx of capital on an unprecedented scale. To put things into perspective, a $250 price tag for XRP would translate into a market cap of over $14 trillion, surpassing the entire stock market capitalization of major economies. 

XRP Current Position 

Meanwhile, XRP trades for $0.6015, showing signs of strength. In the Ichimoku Cloud, XRP is trading above the Conversion Line ($0.5284), Base Line ($0.5224), and both spans of the cloud (with the Lagging Span A at $0.5638). This positioning suggests a bullish trend.

XRP 1D Chart
XRP 1D Chart

Moreover, the Triple Exponential Average indicator is currently at 22.04. While it has decreased from a high of 71.11 observed in early August, the TRIX remains in positive territory, which could indicate that the longer-term trend is still upward. 

However, the recent drop in TRIX might suggest that XRP is experiencing a slowdown in momentum, potentially leading to a period of consolidation.

SOL Reaches Record User Activity, Experts See Potential For New Breakout!

0

The crypto world is abuzz with news that Solana has hit a new threshold in daily active users (DAU) by the end of this month – 2.3 million people on board as of August 28.

This boost shows how much interest the coin is getting, even as the overall market faces some challenges. Could this surge lead to a price spike? In this piece, we’ll try to shed some light on this question.

SOL: A Spike in User Base

Known for its fast transactions, the network has recently seen an uptick in DAU, reaching an all-time high (ATH) of 2.3 million on August 28. This jump reflects growing confidence in the platform, despite some recent dips in the broader market. More users mean more transactions and a stronger community, which are good signs. But the key question remains: can this growing adoption rate push the coin’s value higher?

SOL Cryptopolitian
SOL Cryptopolitan

At the moment, this token is valued between $137.8 and $147.12, with a small but steady increase of 1.38% over the past week. While it’s still below its ATH of $259.96, the recent rise in network usage throughout the day is driving optimism. If the coin can break through its resistance levels at $203.39 and $234.92, we could see a stronger upward trend. The market is slowly turning more positive, and with numbers increasing, the price might soon follow. The signs are there, but it’s still a waiting game to see if the momentum continues.

Trading View Solana USDT 30August2024

Looking ahead, the prospects seem promising. The current moving averages suggest it might be gearing up for growth. If the current levels of network usage don’t drop and the project continues to attract attention in the coming month, especially as we move into September, we could see a rise in the coin’s value. While there are always challenges in the market, this altcoin seems to be in a strong position to take advantage of the current momentum. The next few weeks will be crucial in determining if the project can turn this growth into a price breakout.

Minotaurus (MTAUR): A New Opportunity to Consider?

With the future of the project covered above looking bright, many holders choose to stock it. But, savvy cryptocurrency enthusiasts strive to diversify into other promising alternatives. Trending presale altcoin, Minotaurus (MTAUR), could offer a fresh take on crypto experience. By choosing it now, early buyers could benefit from the ~70% price cut before the project launch. On top of that, $MTAUR holders get incentivized for extending vesting and making referrals. These activities come with nice extra bonuses.

The project aims to make a significant impact in blockchain gaming by integrating a maze-navigation game with Greek mythology themes. It is still in its early stages, but it has already sparked a lot of hype and interest. To help more people get involved, the presale tokens are now available at just $0.0000569. That’s almost 3.5 times lower than the listing value set at $0.00020. When the coin hits decentralized exchanges, those who choose to get in early could get a big boost for their portfolios.

MTAUR USD Price 30August2024

Now, to the $MTAUR token and its utility. Once converted into in-game coins, it opens up access to in-game purchases. Those are unique character upgrades, personalization, and passes to exclusive zones. The dynamic design of the game means that it can be played in a lot of different ways, and each run is supposed to be different. Minotaurus (MTAUR) is part of the ~$15 billion casual game market. It has a strong team behind it and has passed strict security checks. Since there are only a certain number of tokens available in presale, it might be wise to take advantage of the current pricing to see more positive development.

Conclusion

A recent increase in DAU to 2.3 million is a very positive sign for Solana and it could be the beginning of a price rise. As the market is paying close attention, $MTAUR emerges as a promising addition to cryptocurrency portfolios. It stands out with favorable presale pricing, extra benefits for holders, and strong upside potential.

Caution! These Bitcoin Whales Could Sell Their BTC Stash

0

With over 2.2% of Bitcoin’s supply held by governments and the Mt. Gox reimbursement still ongoing, the market might face further selling pressure.

The crypto market has faced immense selling pressure recently as large Bitcoin holders have sold part of their stash.

From the German government’s 50,000 BTC sales to Mt. Gox redistributing over $6 billion worth of Bitcoin to creditors, these notable dumps have impacted the market.

However, further liquidation is not off the grid yet, as analysis shows fresh sources that could create another round of selling pressure.

Data from Kaiko shows possible sources of another supply overhang and its implications for Bitcoin and the broader crypto market.

Possible Sources of Asset Liquidation

Per Kaiko, wallets tied to governments still pose significant risks of another supply overhang. Despite the German government’s exhaustion, the US, UK, China, and Ukraine still have more than 2.2% of Bitcoin’s supply.

Although the US government has periodically dumped some of its stash, its wallet still contains the highest amount of Bitcoin for any governmental body. The US government’s wallet cradles 203,239 BTC, valued at $12 billion.

The Chinese government also holds weighty amounts of Bitcoin, with its wallet containing 190,000 BTC seized from the Plustoken scam in 2019. Although the country has not moved any of the bitcoins since then, they are a possible source of selling pressure.

Ukraine and the United Kingdom hold a combined 107,550 BTCs. An attempt to dissolve these stashes could create a substantial supply overhang in the already weakened crypto market.

Mt. Gox Redistribution Still Ongoing

Despite most of the funds already liquidated, the defunct Mt. Gox will redistribute 44,899 BTC (worth $2.62 billion) to the remaining creditors. The exchange has distributed over $6 billion since July.

Elon Musk’s Tesla is also a potential source of selling pressure. The electric automotive firm has held 9,720 BTC since 2022 and may be looking to cash in on gains.

Notably, Bitcoin has withstood asset liquidation worth over $9 billion since June and has only corrected 13.7% from its price at the start of June and 20% from its all-time high. Bitcoin traded at $58,286 at the time of writing.

CryptoQuant Analyst Identifies Ethereum Trend that Could Trigger the Next Altcoin Bull Run

0

An on-chain analyst from CryptoQuant identifies an important Ethereum trend that could trigger the next altcoin rally.

CryptoQuant analyst SunMoon recently called attention to Ethereum’s price compared to its Realized Price (RP). The Realized Price represents the average price at which each Ethereum token was last moved. This price serves as a psychological support level in the market.

At the time of his analysis, SunMoon’s chart showed that Ethereum’s price stood at $2,522, while the Realized Price hovered around $2,210. Despite Ethereum’s sharp decline over the past five months, it has managed to stay above its Realized Price, which now acts as support. 

Ethereum Price and Realized Price CryptoQuant
Ethereum Price and Realized Price | CryptoQuant

The analyst confirmed that historically, when Ethereum’s price remains above its Realized Price during market downturns, it has often preceded a bullish phase for altcoins.

This market trend hinges on investor sentiment. Notably, whenever Ethereum’s price is above the Realized Price, it indicates that the majority of ETH holders are in profit, which reduces selling pressure and boosts confidence among investors. 

Ethereum Forms Bullish Divergence

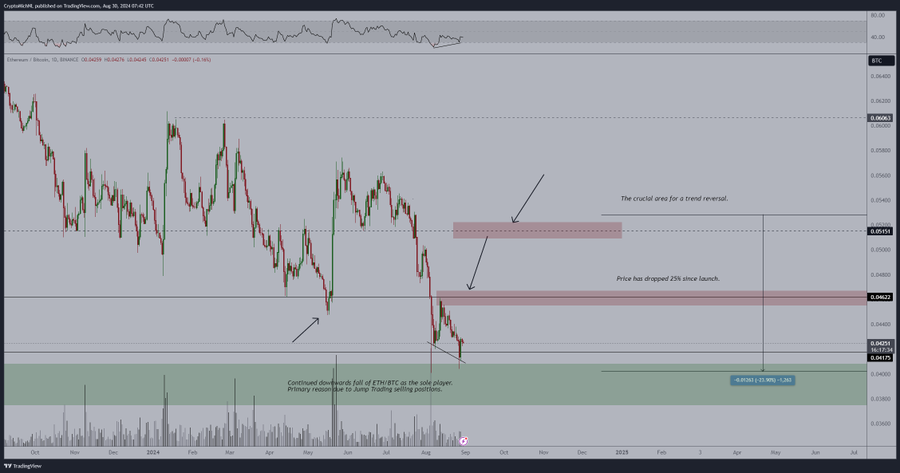
Meanwhile, in a separate analysis, market veteran Michaël van de Poppe focused on the daily ETH/BTC trading pair. For context, traders often regard Ethereum’s strength against Bitcoin as a precursor to broader altcoin strength, making the ETH/BTC chart particularly relevant.

Van de Poppe pointed out a bullish divergence on the chart. A bullish divergence occurs when the price forms lower lows, but the Relative Strength Index (RSI) forms higher lows. In this case, despite ETH declining to 0.0425 BTC, the RSI has shown signs of upward momentum.

ETHBTC Michael van de Poppe
ETHBTC | Michael van de Poppe

Van de Poppe highlighted the importance of the 0.042 BTC level as a critical support for Ethereum. If ETH can maintain this level, it could trigger a rebound, potentially pushing the price towards 0.046 BTC or higher. He identified this area as crucial for a trend reversal.

Additionally, van de Poppe noted that ETF flows, which had been stagnant, are now slightly turning positive. On Aug. 27, daily net outflows cooled to $3.4 million, with a net inflow of $5.9 million on Aug 28. This marked the first positive flow into ETH ETFs over a ten-day period.

Overall, Ethereum’s ability to hold above its Realized Price alongside the bullish divergence on the ETH/BTC pair shows that the ETH market could be gearing up for a potential bullish reversal. At press time, ETH currently changes hands at $2,478.