Home Blog Page 1458

PEPE Price Hits All-time High, amid GameStop Rally, What’s Next?

0

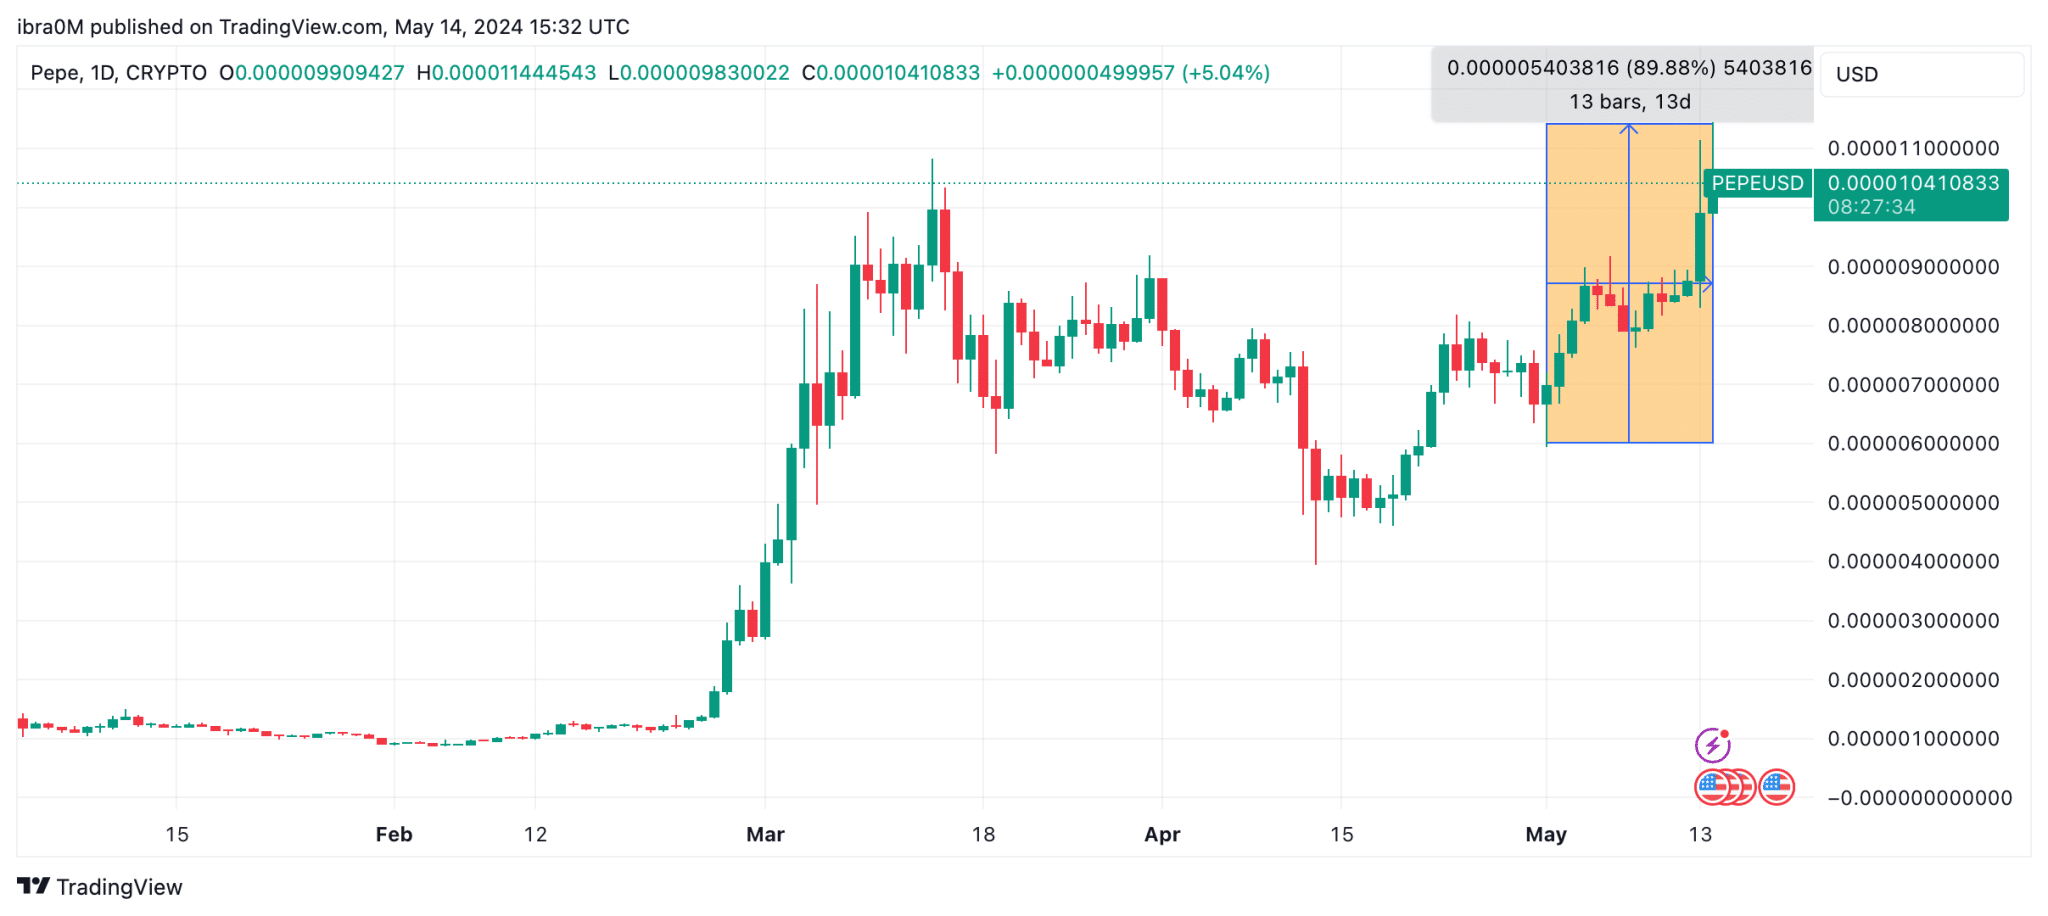
PEPE price soared to an all-time high of $0.000010 on May 14, 2024 as the resurgent GameStop (GME) rally saga bleeds into the crypto memecoin markets. 

Gamestop Saga Resurfaces, Catapulting PEPE to All-Time High

The GameStop saga of 2021 has resurfaced as the GME stock price surged by 40% on May 14.

Early market signals and Reddit comments suggest that the rally is mainly driven by lingering nostalgia from the infamous rally in 2021, which saw institutional Bear traders suffer billions in liquidated Short contracts as retail traders piled on Long positions.

But this time, the retail bullish sentiment surrounding Gamestop (GME) price action has bled into the crypto markets, sparking a wave of memecoin craze. Interestingly, PEPE price, which has been on a tear since the start of May 2024, has emerged as one of the most sought-after crypto memecoins amid the resurgent Gamestop rally.
PEPE Price Action
PEPE Price Action

As depicted in the chart below, PEPE’s latest price surge on May 14, brings it growth performance for the month to the 90% mark. And notably, the $0.000012 daily timeframe peak represents an all-time high for Ethereum‘s largest memecoin project by market capitalization.

PEPE Social Media Traction Surges to 40-Day Peak

With Gamestop’s parabolic rally dominating social media and search engine trends tables, vital PEPE’s on-chain data metrics show a starkly similar catalyst emerging within the memecoin markets this week.

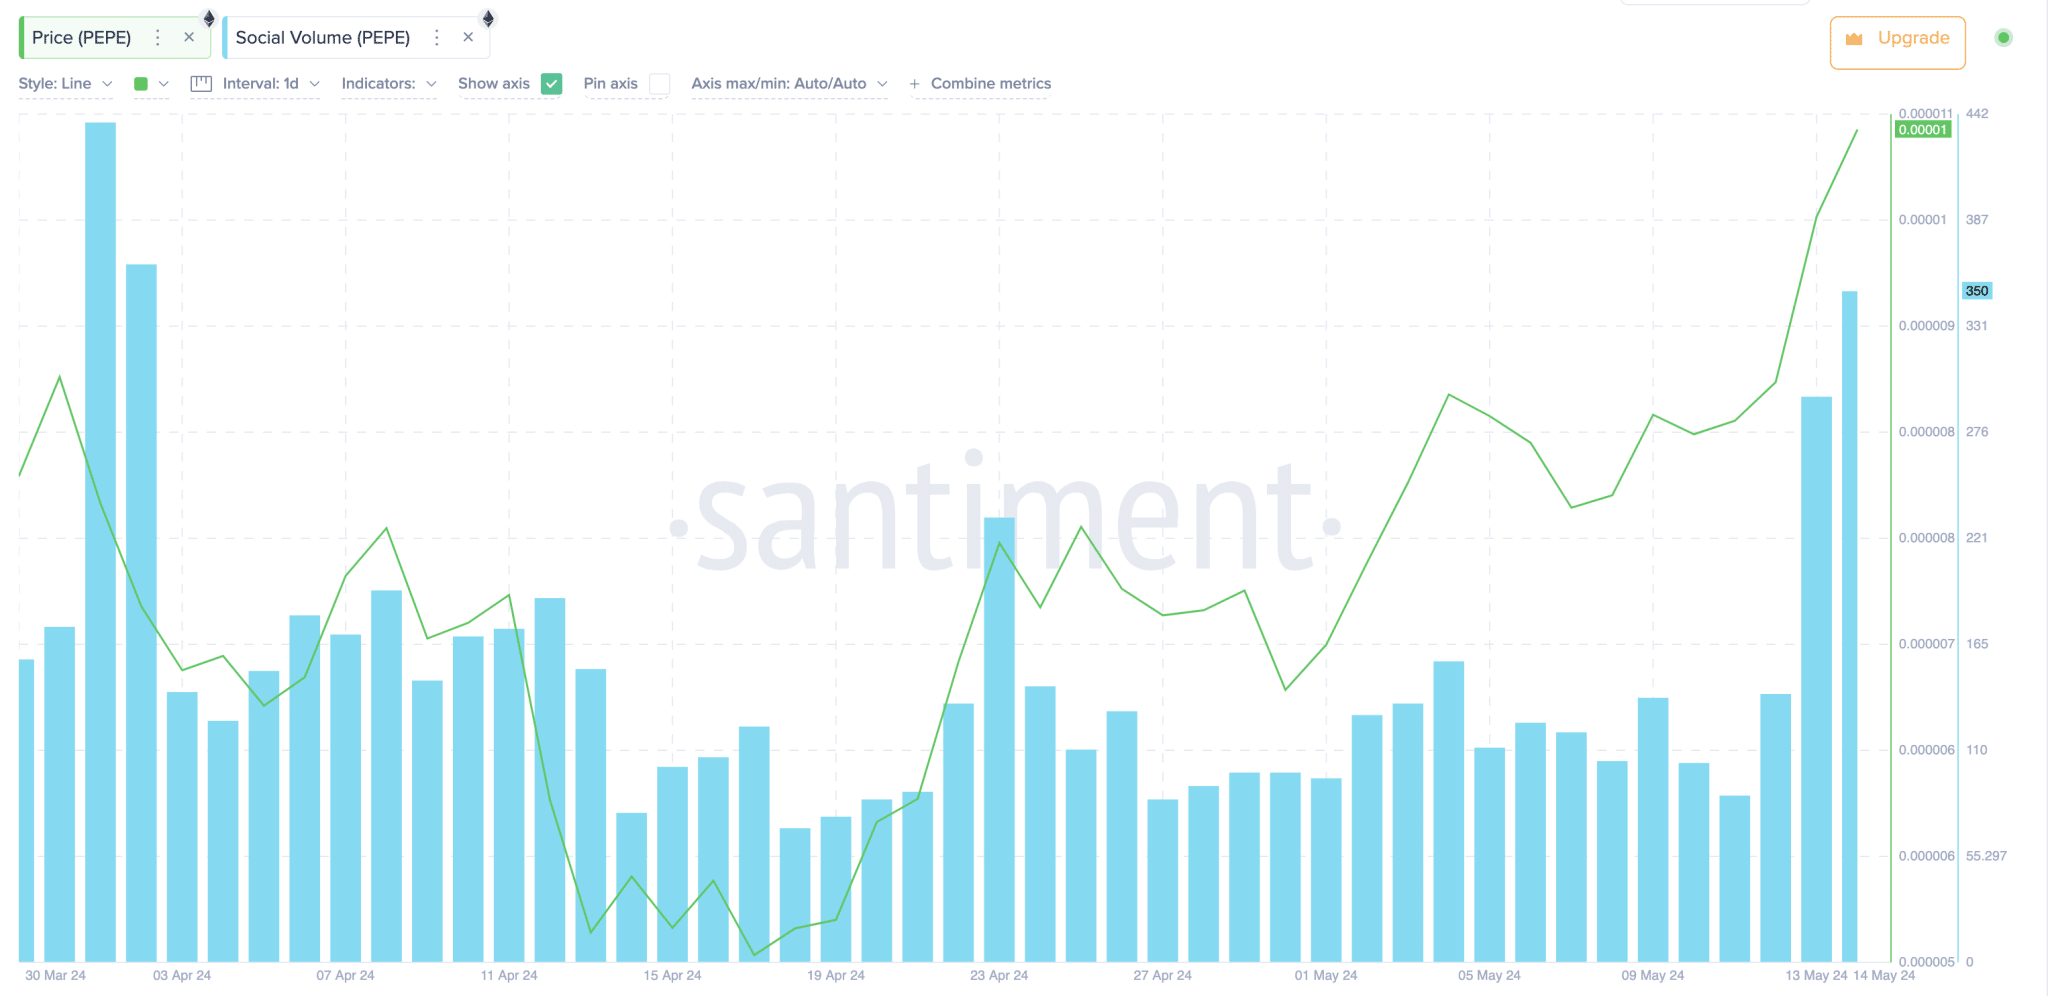
Indicatively, Santiment’s Social Volume score chart below tracks the number of times a specific cryptocurrency is mentioned across relevant crypto media channels, including Telegram, Reddit, X (formerly Twitter), etc.
PEPE Price vs. Social Volume | Santiment

As seen above, PEPE Social Volume score has reached 40-day peak of 350 on May 14, outstripping last month’s high by over 50%. Strategic investors often interpret spikes in social volume during price uptrends as a prime indicator that the is market is nearing the top.

More so, historical data shows that PEPE last hit a peak social traction score above 200 on April 1 and April 23, respectively. And curiously, a rapid price dip followed on both occasions.

Hence, going by historical trends PEPE social volume score crossing 350 on May 14, could be a precursor to a major correction phase in the coming days.

However, with Gamestop media rave still unfolding, there’s a chance that the bullish headwinds could drive PEPE price to new peaks, especially if GME keeps racing up the top gainers’ charts.

PEPE Price Forecast: $0.000020 Rally Still in Play

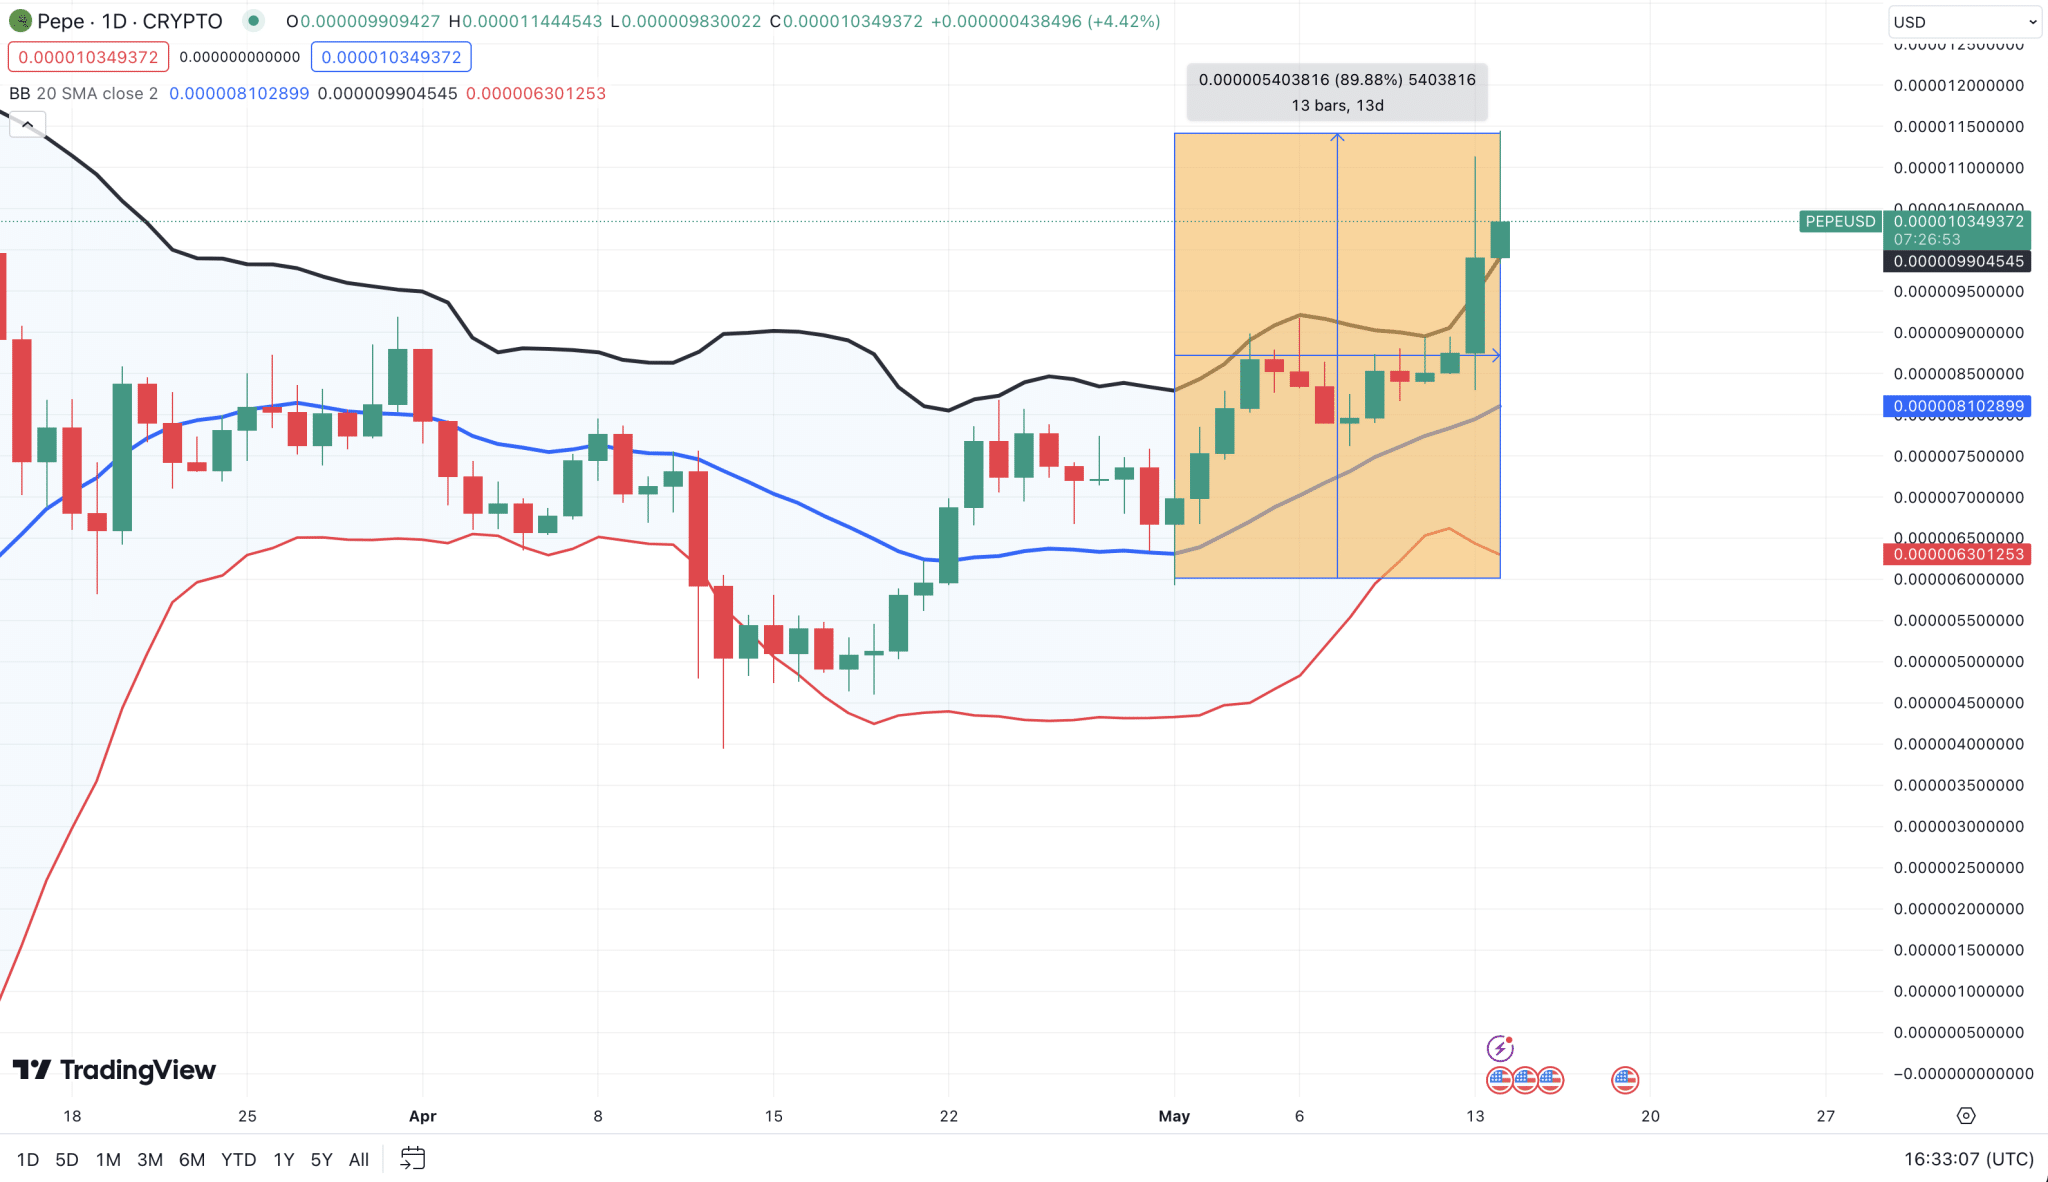
PEPE price is hovering above the $0.000010 mark at the time of publication on May 14, 2024, having retraced mildly from the daily timeframe peak of $0.000012. However, the Bollinger band indicator suggests that the PEPE price could be setting up for another bullish upswing towards $0.00002 in the coming days.

As seen above, despite the mild correction on May 14, the PEPE price is still holding up above the upper-limit Bollinger band at $0.000099. This confirms that the broader sentiment surrounding PEPE short-term market momentum is still dominantly bullish.
PEPE Price Forecast
PEPE Price Forecast

Furthermore, speaking to DLNews, Quinn Thompson, founder of Lekker Capital, also alluded to Gamestop’s impact on PEPE price action.

“Crypto has been lacking new retail entrants this whole way up, It makes sense for crypto memes to catch a bid on hopes” that retail is coming back, because the brutality of the crypto winter hasn’t exactly helped retail participation,”

– Quinn Thompson, Founder Lekker capital

On a bearish note, if the historical divergent pattern between Social media euphoria and PEPE price action reoccurs, a reversal toward the 20-day Simple moving average (SMA) level at $0.0000081 could be on the cards.
XRP Launching Channel Key to Hitting $6.4: Analyst Projects

0

Egrag Crypto sees the XRP “Launching Channel” as a bullish sign, predicting a potential rise to $6.4 with key indicators suggesting strong accumulation.

Egrag Crypto’s latest analysis spotlights a trading pattern he calls the “Launching Channel” in XRP’s chart, suggesting bullish strength. This pattern is identified by partial wicking candles and ascending consolidation. According to Egrag, the setup represents a steady accumulation, poised for a breakout.

The analyst posits that maintaining this channel on a weekly timeframe could signal the commencement of an “Ignition stage,” potentially elevating XRP’s price to a major target of $6.4, a 1260% rise from its current price. 

Egrag however expresses cautious optimism, noting that any break below this channel on the weekly chart would be a cause for concern and could indicate a reversal of the bullish trend.

The analyst’s chart also identifies several significant price points and the market’s reaction at these levels through Fibonacci retracement. Crucial levels include 0.236 at $0.45193, 0.382 at $0.59865, 0.5 at $0.75138, 0.618 at $0.94306, 0.786 at $1.30324, and the 1.272 extension level at $3.32217.

The highest price point in the past data, around $1.96778, serves as a crucial historical resistance level. These Fibonacci levels offer a roadmap for traders, indicating where buying or selling pressure might intensify, potentially leading to price pivots or trend continuation.

XRP Indicators and Current Market Behavior

Notably, XRP is trading at $0.5057, experiencing a minor decline of 0.11% in the last 24 hours. Over the past week, it has seen a 5.82% decrease in value. Despite these fluctuations, XRP maintains a strong market capitalization of $27.95 billion.

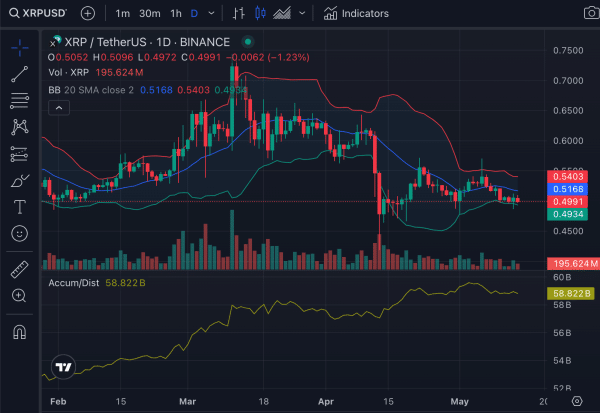
Indicators, such as the Accumulation/Distribution (Accum/Dist) line and Bollinger Bands, have also provided deeper insights into XRP’s market dynamics. The Accum/Dist line, currently at 59.011 billion, helps assess whether capital is flowing into or out of XRP by comparing volume with price movements. 

The daily chart analysis below shows the Accum/Dist line as rising, which can be interpreted as a sign of accumulation. This suggests that more traders are buying XRP than selling it, and such buying pressure could potentially lead to an upward price movement if it continues.

XRP
XRP Daily Price Action

Meanwhile, looking at the Bollinger Band indicator, XRP’s price is positioned slightly below the middle band, suggesting that it is trading in the lower segment of its recent price range. This positioning indicates a potentially undervalued state, which could be considered a buying opportunity for investors.

Other Analysts Concur

Donovan Jolley, another market watcher, has contributed his perspective on XRP’s potential. He suggests that the current market indicators and historical price movements are setting the stage for a notable uptrend. 

Jolley points to the alignment of technical signals with market sentiment, which, in his view, indicates an impending price increase.

Armando Pantoja offers a specific price prediction, foreseeing a rebound for XRP to $1.98. His forecast is based on a recent surge in transaction volumes on the XRP network, which he identifies as a critical indicator of future price movements.

Pantoja cites data from Santiment, which shows that increases in transaction volumes often precede upward price trends. This correlation suggests that the heightened activity could lead to a substantial price rally.

Moreover, analyst U-copy provides a long-term technical analysis, indicating that XRP is approaching a critical juncture after a seven-year symmetrical triangle formation. This analyst highlights the accumulation phases from 2013 to 2017 and again from 2018 to 2024, suggesting that these periods of price stabilization are likely precursors to a significant breakout.

XRP Price Eyes $0.55 Rebound as Ripple Files New Motion against SEC

0

XRP price broke above $0.50 on May 14, having surged 5% within the 24-hour timeframe as markets reacted positively to a motion filed by Ripple in its lawsuit against the SEC on May 13.

Ripple Moves Motion to Seal Court Documents in SEC Lawsuit

The Securities and Exchange Commission (SEC) lawsuit against Ripple has received an update. The payment remittance firm filed a motion to selectively seal documents pertaining to the remedies phase.

In its motion dated May 13, Ripple asserts that the SEC had previously indicated non-opposition to the firm’s request to seal certain parts of documents in the remedies phase, aimed at safeguarding the interests of all involved parties.

Ripple’s filing, made within the May 13 deadline for Omnibus letter filings, outlines a request for carefully targeted redactions of the remedies motion briefings and specific exhibits.

The firm contends that its sealing requests are reasonable and in line with similar requests granted by the court during the lawsuit’s summary judgment phase. Prior to the motion’s filing on Monday, Ripple’s legal counsel discussed the motion with representatives from the US financial regulatory body.

Acknowledging Ripple’s requests, the SEC has indicated acceptance of some while potentially contesting others.

Ripple seeks redaction of information that could potentially harm the payment remittance firm, as well as innocent third parties and non-party Ripple employees if publicly disclosed, as per the filed document. The firm specifically seeks limited redaction of documents containing its audited financial statements and associated records.

Ripple argues that its audited financial statements contain sensitive information regarding the company’s long-term strategies, revenue sources, and cost structures, which could provide competitors and customers with valuable insights.

Furthermore, to protect its interests, Ripple now aims to shield the identities of its investors, customers, employees, and business partners, urging the court to prioritize privacy considerations for these entities.

XRP Price Forecast: Breaking $0.52 Could Catalyze Larger Profits

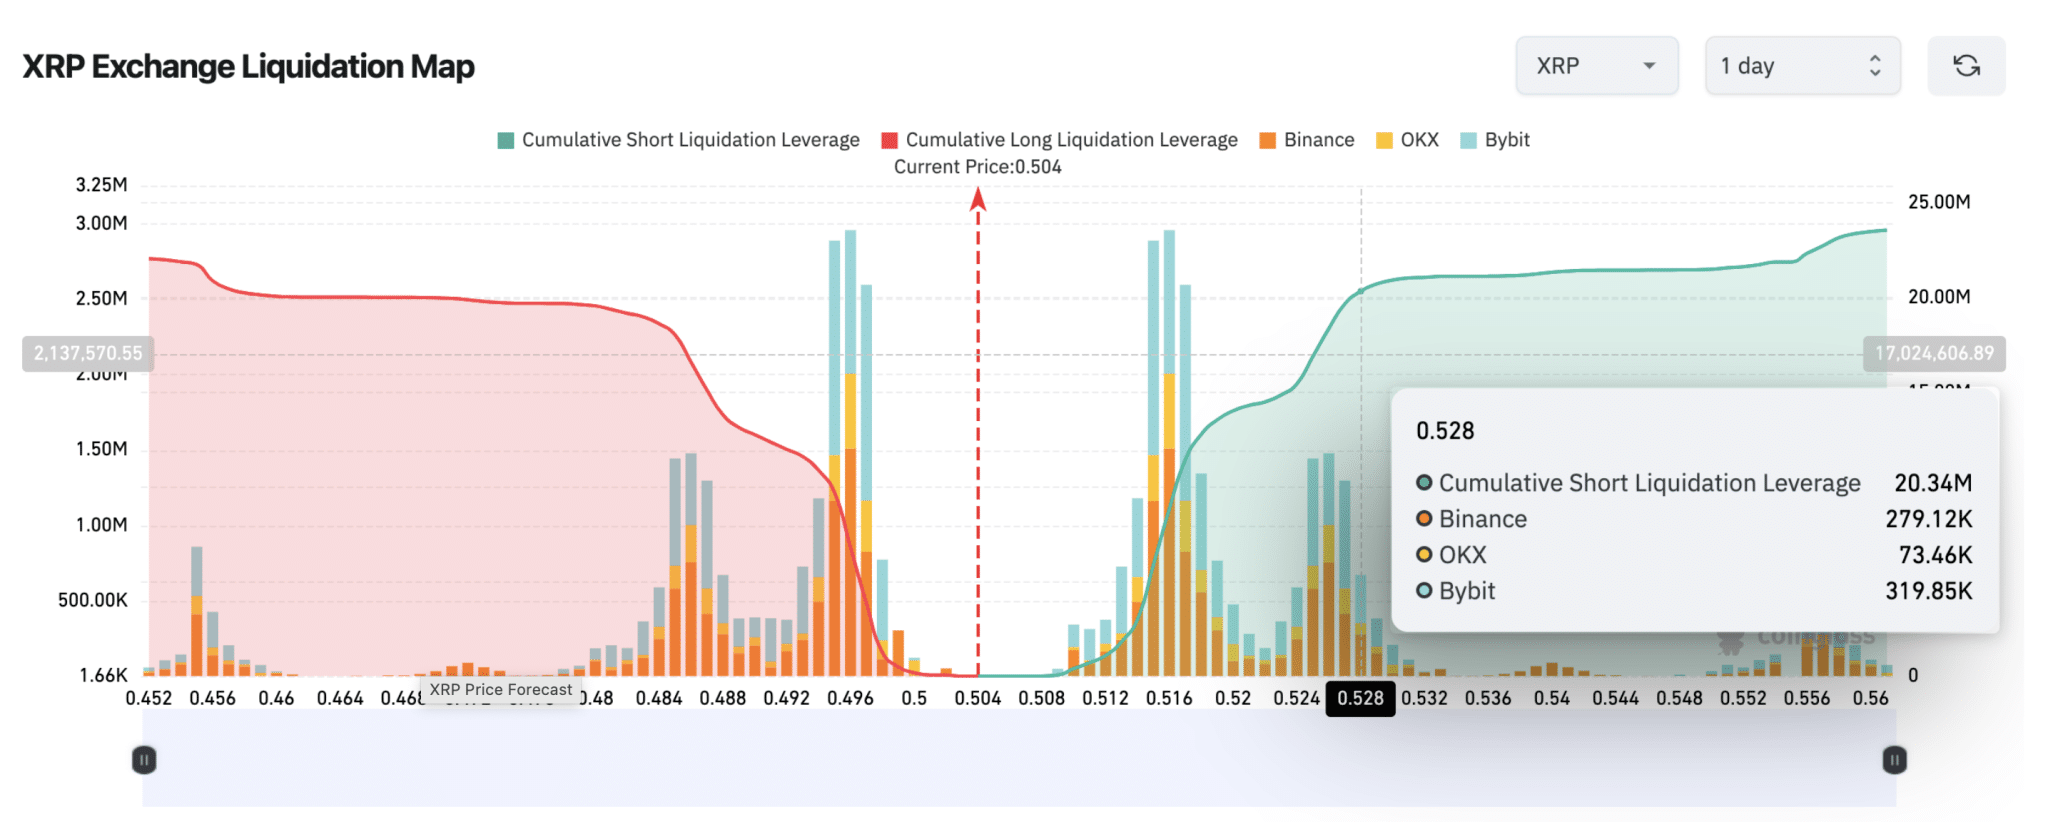
Thanks to bullish sentiment surrounding Ripple’s latest motion in the lawsuit against the SEC, XRP price has advanced above $0.50 at the time of writing on May 14. However, technical indicators show that the XRP price now faces a major resistance at the $0.53 level.

Coinglass’ Liquidation Map below shows that XRP bears have $20.3 million worth of active SHORT contracts that could get liquidated if price surge above $0.53.

Screen Shot 2024 05 14 at 40703 PM
XRP Price Forecast

If these contract holders opt to sell early to mitigate potential losses, it could inadvertently put downward pressure on XRP prices in the days ahead, likely preventing.

But on the contrary, the XRP price could break out above $0.55 if the bulls can power the rally above the $0.53 resistance.

Here are Projected Timelines for Cardano to Rise 649% to $3.25

Multiple prediction platforms propose how long Cardano (ADA) may take to soar by 650% above the $3 price.

Cardano languishes around the $0.4 price level, witnessing more bearish days than bullish. With this trajectory, its potential to reclaim the psychological $0.5 threshold continues to dim.

Given ADA touched $0.4293 at the last check, it has almost completely erased all the returns investors saw over the last seven months. Despite this underwhelming outcome, optimism about Cardano’s potential remains on the high side.

Aside from independent market observers, prominent entities in the crypto sphere have suggested timelines for when ADA must have advanced by more than sixfold to attain lofty highs in the $3 range. These include Telegaon, Coincodex, and Changelly.

Projected Timelines for Cardano to Hit $3.25

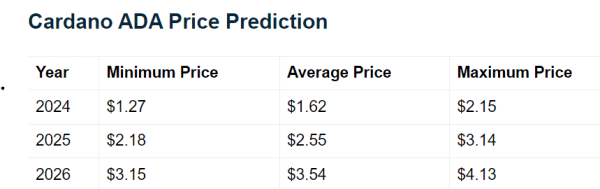
According to the prediction platform Telegaon, ADA may have a maximum value of $3.14 by next year. Notably, the platform expects the average price for Cardano to be $2.55 by 2025. Meanwhile, Telegaon believes ADA’s value will stabilize at $3.54 by 2026.

Cardano price prediction Telegaon
Cardano Price Prediction | Telegaon

Notably, Cardano registered a peak of $3.10 in the last cycle and is currently trading 86% below that value. Essentially, Telegaon sees long-term Cardano holders missing out on this emerging bull season.

Other entities projecting Cardano’s outlook have conveyed similar sentiments. Crypto trading platform Changelly suggested that ADA will only reclaim the $3 range by late 2028. 

Similarly, market tracker Coincodex indicated Cardano may register a yearly high of $3.25 by 2030. Interestingly, Coincodex noted the asset’s yearly low in 2030 would be $0.669950, implying an anticipated 385% surge for ADA that year.

Nonetheless, considering Cardano trades at $0.4338, the asset demands a 649% surge to hit $3.25. 

Views of Independent Analysts

While a six-fold return in six years may be substantial, it significantly dwarfs the widespread anticipations, particularly those of independent market analysts. Typically, analysts predict a bullish future for Cardano, with the potential to reach $7 to $13 between now and 2025. 

For instance, Javon Marks recently updated his initial $2.7 target to propose ADA is on a path to targets at $5.29 and $7.82.

In a separate analysis, Ben Armstrong, referencing Ali Martinez’s forecast of $7 based on historical patterns, suggested an even higher target of $11. Armstrong’s outlook aligns with Dan Gambardello, who argued that $11 is feasible for ADA this season.

Solana Meme Coin GameStop Spikes 3,914% Amid Surge in GameStop Stock

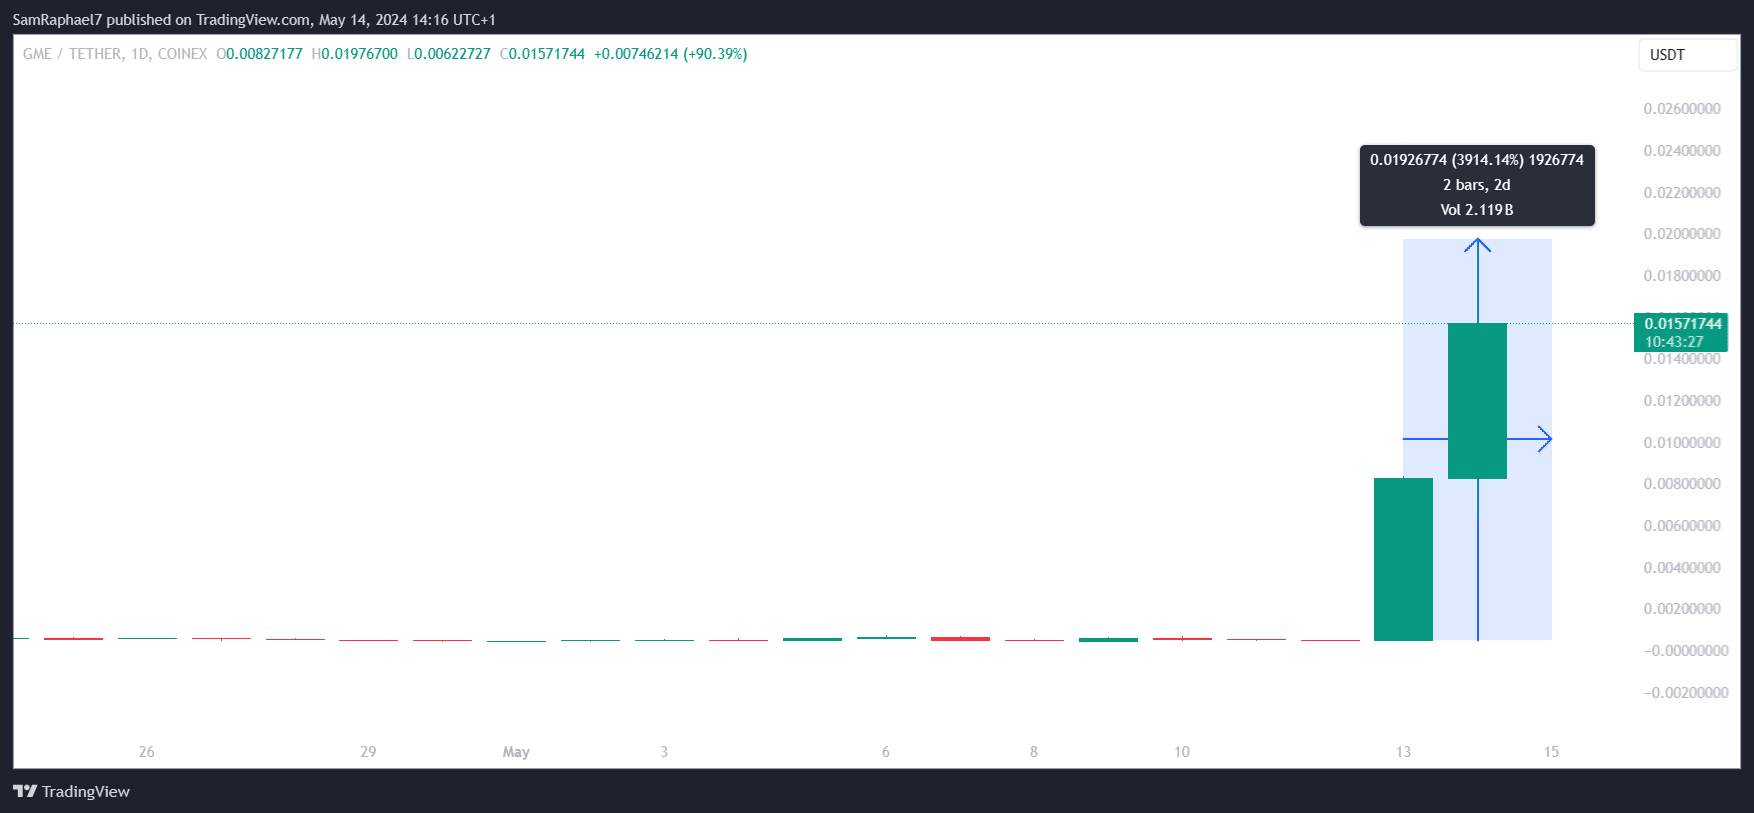
The strange pre-market surge in GameStop (GME) stock triggers a 3,914% spike in a Solana meme coin of the same name within 2 days.

The original GameStop stock, with ticker GME, is witnessing a surprising rally due to a post from Roaring Kitty. However, with the GME stock suspended for trading at the start of the uptrend, investors have trooped to crypto meme coins sharing similar names.

Notably, GameStop (GME), a Solana-based meme coin created in February as a parody of the original GameStop, has capitalized on this upsurge. Market data shows that the meme coin began yesterday with a price of $0.00049226 following three consecutive days of sustained losses.

However, its price soared to a three-month high of $0.0083548 before it saw a mild correction, closing Monday with a massive 1,576% increase. As the original GME sustained its rally into the after hours today, the Solana meme coin followed suit.

GameStop 1D Chart
GameStop 1D Chart

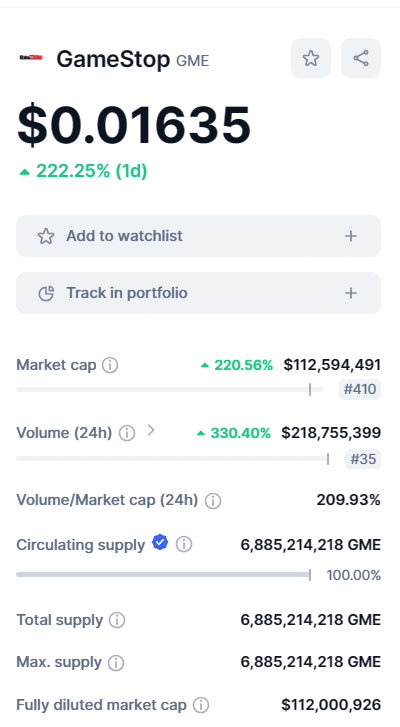
As a result, it spiked to a peak of $0.01976, marking a 3,914% increase in just two days. GME dropped from this high, but currently trades at $0.01635, maintaining a 222% rise in 24 hours and a 3,221% increase from its opening price yesterday. Volume has soared 350% in 24 hours to $218 million, with market cap hitting $112.5 million.

GameStop GME Volume
GameStop Valuation and Volume | CoinMarketCap

GameStop: What Happened?

GameStop Corp., a U.S.-based game retailer, saw its stock soar by unbelievable margins in the pre-market phase. GameStop shares, which ended Monday at $30.45, saw an impressive rally in the after hours following an X post from finance analyst and investor Keith Gill, commonly known as Roaring Kitty. 

Gill had advocated for GameStop in 2021, triggering a similar surge in price, but went AWOL after that. The recent post, which has garnered 24.4 million impressions at last check, marked Gill’s first X post in nearly three years. It featured a widely recognized meme depicting a gamer leaning forward in a posture denoting heightened focus.

Shortly after this post, Gill continued to share clips of movies, garnering investor attention. Amid the ruckus, GME, which has underperformed over the past few months, skyrocketed from its closing price of $30.45 to a pre-market high of $80 earlier today, marking a 162% increase.

Market watchers such as Neil Wilson, Finalto’s B2B Chief Market Analyst, interpret the surge as indicative of a renewed investor appetite, characterized by a willingness to embrace risk. Wilson underscores that the rally lacks fundamental justification, particularly given GameStop’s turbulence over the past year.

Bloomberg’s Joe Weisenthal noted on X that he has no explanation as to why GME shares jumped 75% yesterday. However, he thinks the surge today is because the market expects GameStop to raise capital and boost future cash flow significantly.

Notably, the spike to $80 brought GameStop’s market cap beyond the $20 billion mark. In addition, short traders recorded significant losses, amounting to $1 billion yesterday alone. 

Crypto Sleuths Reveal Joseph Lubin Received 3.75M ETH During Ethereum ICO

0

A group of crypto sleuths calls the public’s attention to the amount of ETH tokens Ethereum co-founder Joseph Lubin received during the token’s ICO.

Australian-based pro-XRP lawyer Bill Morgan called attention to claims that Ethereum co-founder Joseph Lubin received a whopping 3.75 million ETH during the project’s ICO. At the current exchange rate of $2,901, the 3.75M ETH coins are worth $10.87 billion.

He questioned the exact percentage the figure constituted when compared to the total ETH distributed during Ethereum’s ICO phase. Attorney Morgan made the remarks in reaction to an X post from a group of sleuths who operate under the pseudonym TruthLabs.

TruthLabs Issues Fresh Allegations Against Lubin

The group revealed serious allegations against Lubin, claiming that the Ethereum co-founder perpetrated more fraudulent activities than the infamous American financial criminal Bernie Madoff.

To support the corruption allegations, TruthLabs presented evidence showing over 50% of all Bitcoin addresses the Ethereum co-founder used to participate in ETH ICO. The so-called evidence shed light on how much BTC Lubin allegedly paid and the total ETH he received. 

Screenshots attached to the tweet showed that the addresses, potentially linked to Lubin, invested 1,648 BTC during the ICO. In return, the addresses received 3,275,145 (3.27 million) ETH in connection to the Genesis Block 0.

TruthLabs claimed the investigation was time-consuming, lasting over hundreds of hours. Nevertheless, they shared the information with the public at zero cost.

Controversies Surrounding ETH ICO

There have been numerous allegations regarding potential corrupt practices during Ethereum’s ICO. Former Ethereum advisor Steven Nerayoff had fueled these debates in the past, alleging that Lubin and Vitalik Buterin sabotaged crypto and engaged in fraudulent ICO.

However, no one knows the exact amount of ETH paid to Ethereum co-founders, especially Lubin. Notably, Lubin has also refrained from revealing his ETH holdings on several occasions, including during CoinDesk’s Consensus 2022 event. During the event, Lubin claimed that his ETH holdings amounted to less than half a percent. 

His claim contradicts previous analysis, especially from Forbes. In 2018, when Forbes named Lubin the second-richest man in crypto, the media outlet estimated that he owned between 5% – 10% of the total ETH supply.

Nonetheless, Lubin has remained mute regarding his ETH holdings despite the resurgence of corruption allegations. Lubin has been a significant player in Ethereum even before the network launched its controversial ICO in 2015. 

Besides being able to buy ETH during the ICO, Lubin’s position as Chief Operating Officer of Ethereum at the time could have earned him a huge chunk of the ETH reserved for Ethereum Foundation team members and early contributors.

Lubin’s exact ETH holdings have attracted the public’s attention as the SEC launches an investigation to determine whether certain ETH transactions qualify as securities.

It bears mentioning that Lubin’s company, Consensys, filed a lawsuit last month to stop the SEC from giving ETH the securities tag.

This Pattern Shows the Bitcoin Post-Halving Selloffs are Officially Over

0

Bitcoin exits its post-halving “danger zone,” with forecasts indicating reduced volatility and a stable growth trajectory through 2024.

As Bitcoin moves beyond the post-halving selloff phase, market analysts are providing insights into its potential trajectory and critical price levels to watch.

Rekt Capital’s latest analysis points to an end of the precarious phase that typically follows the Bitcoin halving, suggesting an upcoming period of price stabilization and potential growth.

The comparative charts from 2016 and projections for 2024 show similar patterns price movements. In 2016, a significant volume spike of approximately 603K BTC coincided with notable price movements, including a critical drop of 17.87% around July 11, 2016.

This drop was followed by a recovery phase leading to a parabolic increase in Bitcoin’s price. The analysis shows the phases of post-halving market behavior, capturing the transition from a sharp price decline to a robust recovery and growth phase.

Looking ahead to 2024, Rekt Capital forecasts similar price movements. He draws particular attention to the “Post-Halving Danger Zone,” where the chart shows a notable dip in Bitcoin’s price. According to the chart, there’s a decline marked by a 6.44% drop. This decrease aligns with similar patterns observed in previous cycles.

Shorter Term Predictions

Michaël van de Poppe, CIO and founder of MN Trading Consultancy, offers a shorter-term perspective on Bitcoin’s price movements. With Bitcoin currently trading around $61,855.36, it teeters on crucial thresholds.

Van de Poppe highlights a potential fall to a range between $52,000 and $55,000 if the support around $60,500 is broken. Conversely, surpassing the $63K barrier might trigger a run toward previous highs.

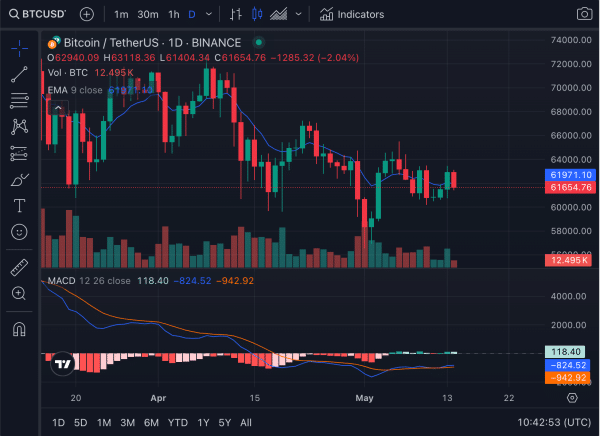
According to the latest trading data, Bitcoin’s current volume shows a significant selling pressure, which is mirrored in the price decline over the last 24 hours. The Exponential Moving Average (EMA) and Moving Average Convergence Divergence (MACD) indicators suggest a bearish sentiment in the short term. The EMA is currently above the closing price, and the MACD histogram reflects bearish momentum.

Bitcoin 1D Chart
Bitcoin 1D Chart

Projections from Influential Figures

Jack Dorsey, the former CEO of Twitter, and Ki Young Ju, CEO of CryptoQuant, have both indicated bullish long-term outcomes for Bitcoin. Dorsey, as previously reported by The Crypto Basic, speculates that by 2030, Bitcoin could reach or even exceed $1 million, attributing this potential to the collaborative nature of the Bitcoin community. 

Similarly, Ki Young Ju’s analysis based on network fundamentals supports a sustainable price of $265,000. According to Ki Young Ju, the correlation between the network’s hash rate and its market cap offers a bullish signal for the crypto’s valuation.

South Korea Firm Becomes XRP Ledger Validator

0

Emi Yoshikawa, Ripple’s Vice President of Strategy and operations, reacts to reports that Korean virtual asset provider Infinite Block is participating as a validator on the XRP Ledger (XRPL) network.

Infinite Block Becomes XRPL Validator

For context, Catalyze Research reported yesterday that Infinite Block has become the latest company to participate as a validator on the XRPL.

According to the announcement, the move will foster a stable XRP Ledger ecosystem growth trajectory within South Korea’s regulatory environment.

Besides expanding the XRPL ecosystem within Korea, Infinite Block aims to offer XRP and XRPL-related services to local and international corporations in a regulatory-compliant manner.

In the meantime, data from XRP Scan shows that Infinite Block’s validator service is fully operational with an agreement score of 99.9% over the past 24 hours.

Launched by a team of regulatory and financial experts, Infinite Block is a prominent crypto-related business in Korea.

Last year, the Korean Financial Services Commission granted a virtual asset services provider license to Infinite Block in early 2023. Of the 50 companies that applied for the license, Infinite Block was the only company that passed the evaluation exercise.

Ripple and Infinite Block Exec React

Commenting on the development, Infinite Block’s CEO Jung Gu-tae underscored the company’s dedication to boosting XRPL’s reliability by protecting users and adhering to local and international regulations.

Reacting, Ripple’s VP of Strategy & Operation celebrated the growing presence of high-quality Asian validators within the XRP Ledger ecosystem.

XRPL Validators

The development comes a few days after SBI VC Trade, the crypto exchange arm of Japanese financial giant SBI Holdings became a validator in XRPL. As reported earlier, SBI VC Trade, which has showcased a longstanding support for XRP, aims to become a dUNL (default Unique Node List) validator in the network.

At press time, XRPL has more than 125 validators tasked with confirming the validity of transactions on the network. While there are currently over 125 validators, only about 35 of them are part of the dUNL list. Some validators in the dUNL list include Ripple, Bitrue, XRP Labs, Bitso, onXRP, and Bithomp, among others.

Meanwhile, XRPL currently boasts a total of 615 nodes, according to data from XRPL.org.

Top Analyst Unveils Market Structure Taking XRP to $589

Market analyst Cryptobilbuwoo expects XRP to reach an audacious $589 price based on a market structure that resulted in the 2017 historic rally.

XRP has consolidated between $0.48 and $0.51 since Saturday, awaiting the perfect opportunity to secure a breakout. Amid the market uncertainty, it has held above the $0.50 psychological threshold, currently up 1.67% over the last 24 hours. 

XRP Historical Performance

While its short-term trajectory remains uncertain, market analysts such as Cryptobilbuwoo believe XRP’s long-term prospects are majorly bullish. In a chart presented by media personality Amonyx, Cryptobilbuwoo identified multiple patterns on the XRPUSD and XRPBTC charts that suggest an imminent price rally.

XRP to $589
Image Source: https://twitter.com/amonbuy/status/1790062691572216137

In the XRP/BTC chart, the analyst called attention to a descending triangle that XRP traded within from 2015 to early 2017 as Bitcoin outperformed it within this timeframe. Interestingly, XRP flipped the switch in early 2017 when it broke out of the descending triangle, outperforming Bitcoin.

XRP spiked from a low of 0.00000479 BTC in February 2017 to a high of 0.00006110 BTC in March of that year, eventually hitting the Fibonacci 0.618 resistance point. This roadblock led to an XRP correction against Bitcoin, resulting in a drop to 0.00002273 BTC in April 2017.

After this retracement, XRP witnessed more substantial growth, reaching a peak value above the 0.0002248 Bitcoin mark in May 2017. This 0.0002248 BTC price aligned with the resistance at the Fib. 1.618 retracement. 

Data from the XRP/USD chart confirms the spikes in XRP’s price during this period, which led to a substantial increase against Bitcoin. However, on the XRPUSD chart, XRP’s initial surge to $0.3988 aligned with a breach of the Fib. 1.618 level and the recovery push toward the ATH of $3.3 came on the back of a break above Fib. 2.382.

A $589 XRP Target

Current Market movements suggest XRP is trading within the same pattern on the XRP/USD and XRP/BTC charts. On the XRP/USD chart, the analyst expects a surge to $33, aligning with the Fib. 1.618 level. After a mild consolidation, Cryptobilbuwoo projects a recovery rally, which would allow XRP to hit $589.

At its current price of $0.5063, XRP must skyrocket by a massive 116,234% to clinch the $589 price, a level that most market watchers believe is unattainable.

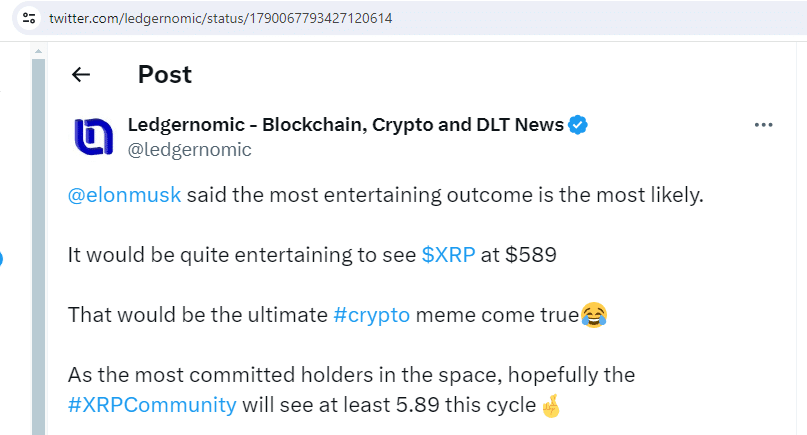
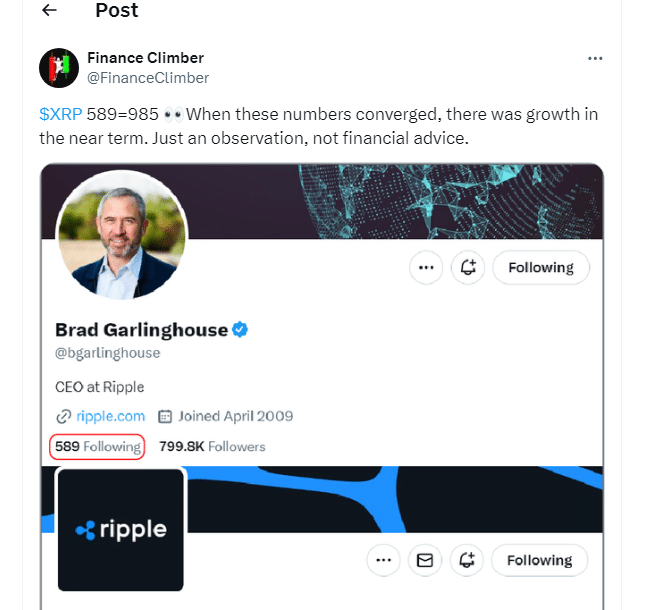
The $589 narrative previously took center stage in the XRP community. The tweets below show how eager the community is to see XRP at $589.

XRP 589 1
XRP $589
XRP 589 2
XRP $589
XRP 589 3
XRP $589
Last March, former US congressional candidate David Gokhshtein made a case for this narrative, citing Bitcoin’s market cap. Cryptobilbuwoo also suggested that XRP could be heading to 0.000604 Bitcoin on the XRP/BTC chart, despite veteran trader Peter Brandt asserting XRP could go to zero.


Investors Pulling Funds off Exchanges

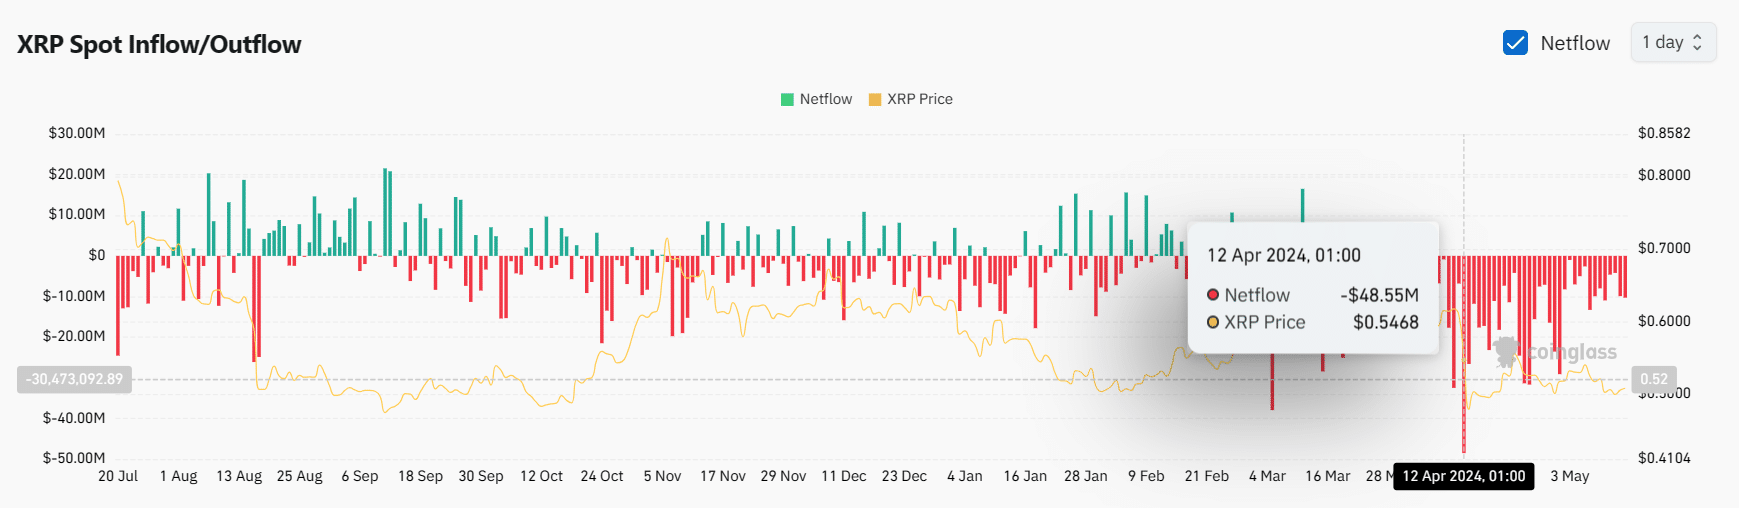
Meanwhile, XRP has continued to witness bullish sentiments, leading to sustained exchange outflows despite Ripple’s recent move to sell. According to data from Coinglass, since April 6, exchanges have observed net outflows in XRP, as market participants continue to pull out their funds.

XRP Exchange Netflow Coinglass 6
XRP Exchange Netflow | Coinglass

Notably, the biggest daily outflow within this period saw $48.55 million worth of XRP move out of exchanges on April 12, the largest intraday figure in over a year. This trend has continued, contributing to the reduction of selling pressure. XRP is up by a meager 1.44% this month.

Dogecoin Price Forecast: Can this $41M Signal Drive DOGE to $0.20?

0

Dogecoin price opened trading at $0.15 on May 14, gaining 10% in 48 hours. With bulls deploying additional leverage, how much longer can DOGE sustain the uptrend?

DOGE Bulls Mount $41 Million Leveraged Positions after 10% Rally

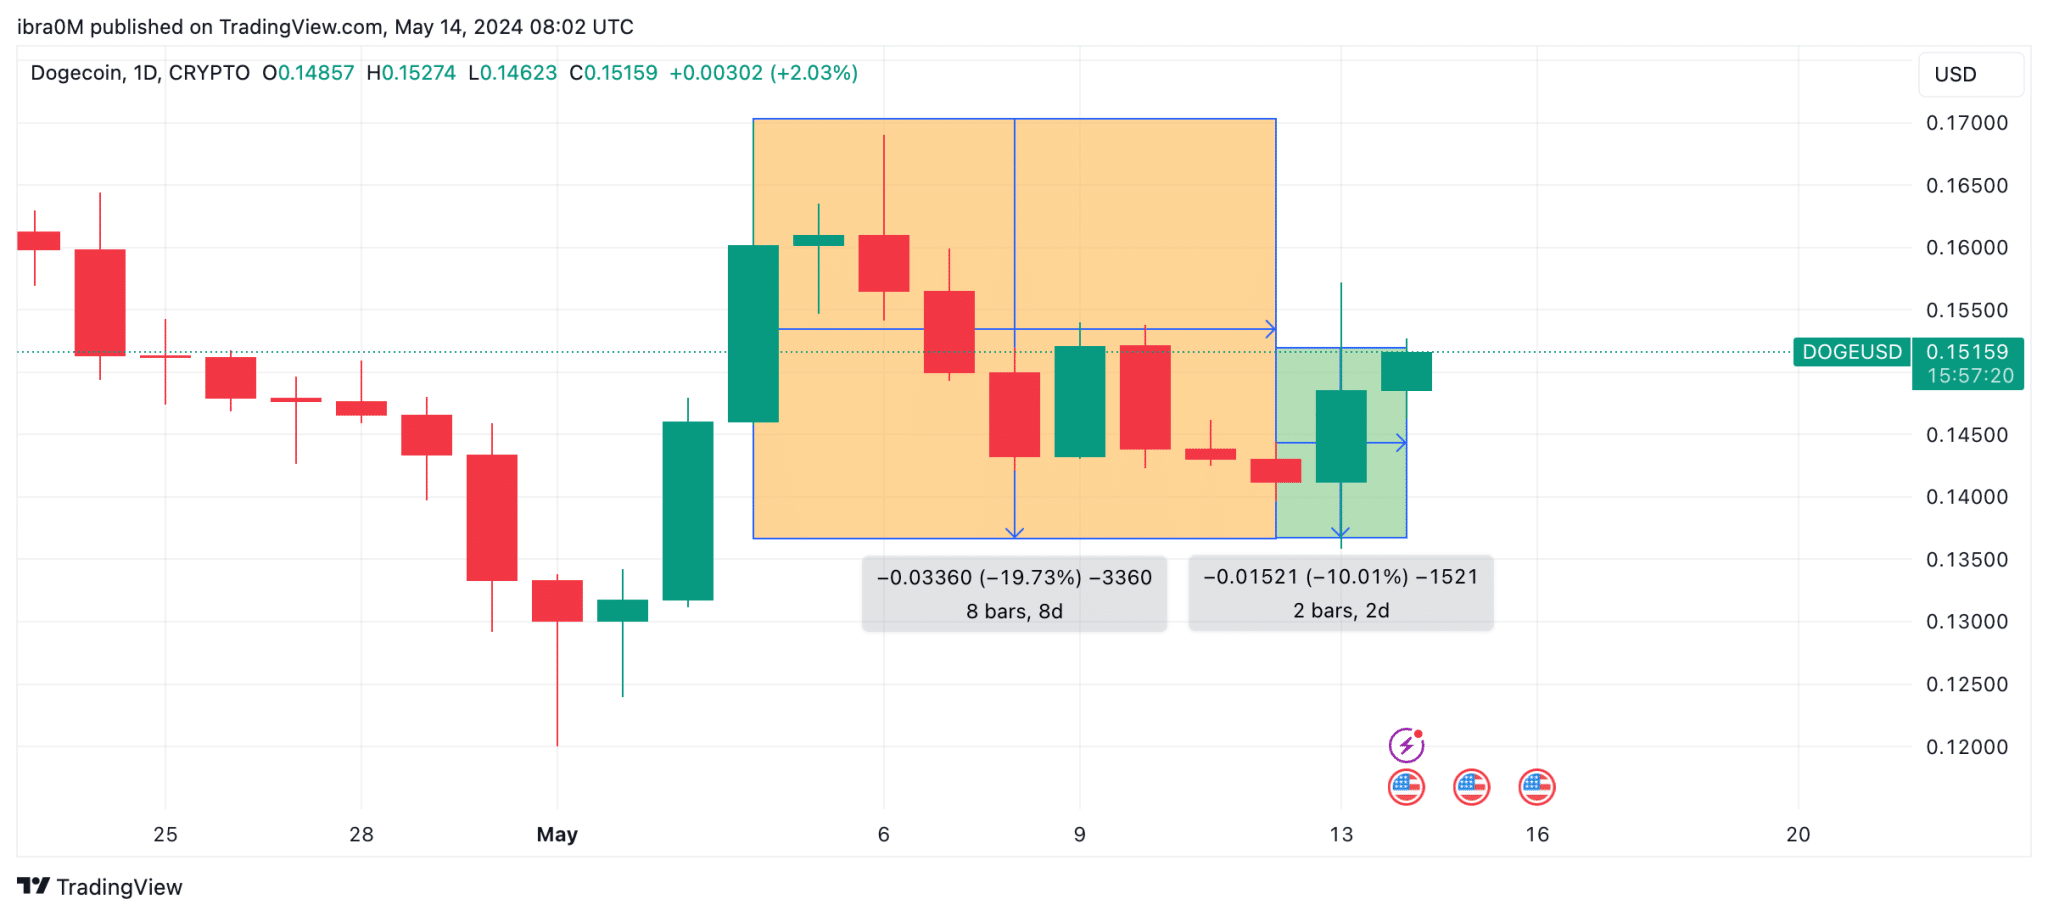
After hitting a monthly peak of $0.17 on May 4, Dogecoin price descended into a week-long 20% correction phase that saw it retest $0.13 by May 12.

However, the bulls appear to be back in the drivers seat this week, riding on the wave of positive sentiment and optimism surrounding the crypto market ahead of US CPI and PPI data release.

Dogecoin (DOGE) Price Action

At the time of writing on May 14, DOGE price has gained 10% reaching a peak of $0.16 during the intraday trading hours on May 13.

While the Dogecoin price is mainly triggered by broader macroeconomic drivers, bull traders in the derivatives markets are now looking to seize the initiative and drive prices further upwards.

Critical market data show that traders holding LONG positions on DOGE have been deploying additional leverage in the last few days. This move could see the DOGE bulls earn amplified profits if spot price rises further.

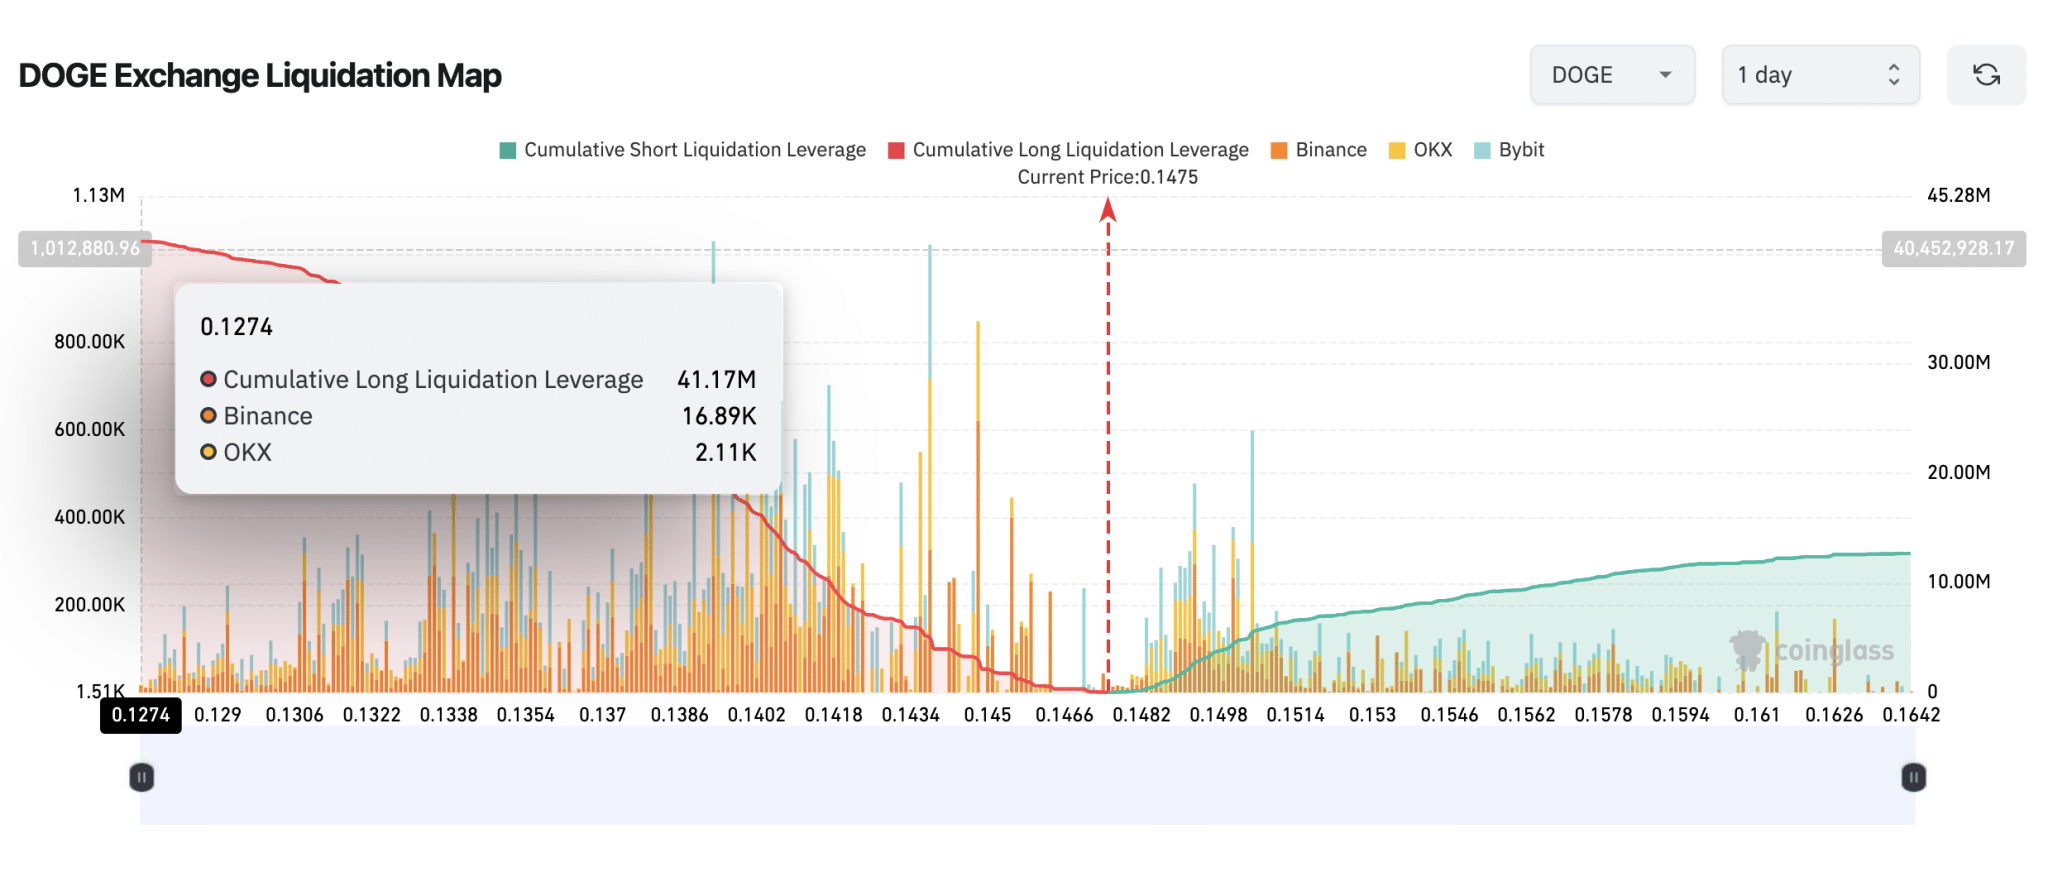
Coinglass’ Liquidation Map data shows a real-time comparison of cumulative LONG leverage positions against the active SHORT contracts.

Dogecoin (DOGE) Liquidation Map data

As seen above, the DOGE bull traders currently have active leveraged LONG positions worth $41.2 million. In comparison, the bears only have active SHORT contracts worth $12.7 million.

The significant difference in the value of active leveraged LONG positions ($41.2 million) compared to active SHORT contracts ($12.7 million) indicates a strong bullish bias among traders.

Largely, it suggests that traders are more optimistic about the future price movement of DOGE, leading them to deploy more leverage on their long positions, amplifying their profits in the event of appreciation.

DOGE Price Forecast: Rocky Road to $0.20

Dogecoin price is currently trading above the $0.15 level at the time of writing after 10% gains in the 48 hours. However, the disparity between the $29 million disparity between LONG positions and SHORT contracts implies the potential for a further upswing toward the $0.20 level.

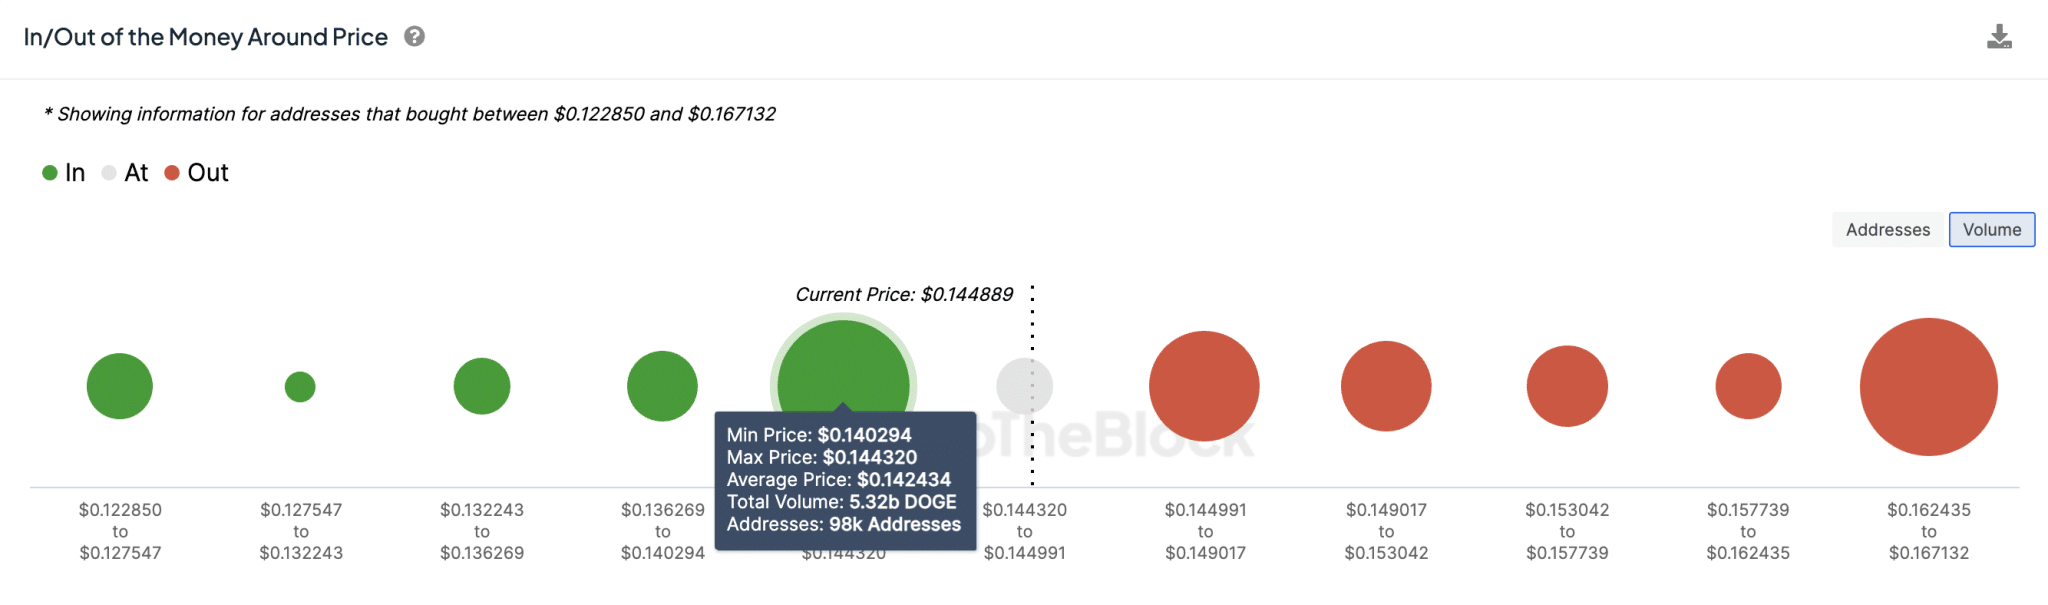
IntoTheBlock’s GIOM data also affirms this bullish DOGE price forecast. It shows that breaking above the critical $0.15 territory has now pit DOGE bears up against an $800 million support cluster.

Dogecoin (DOGE) price Forecast

As seen below, 98,000 existing holders had acquired 5.32 billion DOGE at an average price of $0.14. This implies that the bears have to stage a $800 million sell-off to force a downswing below $0.14.

But with over $41 million active LONG positions, DOGE bulls will likely make spirited efforts to prevent that reversal in the near-term.

With fewer active SHORT positions, if the upcoming US CPI and PPI data reports deliver better-than-expected outcomes, the Dogecoin price could surge toward $0.20, facing far lesser resistance.