Home Blog Page 1494

Six Shiba Inu Addresses Hold 30,000,000,000,000 SHIB for Over 2 Years

0

In a notable discovery by The Crypto Basic, on-chain data shows six Shiba Inu addresses have collectively held 30 trillion SHIB tokens worth $663 million for two and a half years without selling a dime.

Despite the ongoing market correction that has pushed Shiba Inu to the $0.000022 support, investors have demonstrated resilience, holding onto their SHIB tokens. In addition, some whale and shark addresses have also continued to procure more tokens in anticipation of a rebound.

Amid persistent market trends, The Crypto Basic analysis from Arkham Intelligence has identified a notable pattern among top SHIB holders. Specifically, data shows that six Shiba Inu wallet addresses each possesses precisely 5 trillion tokens, valued at $110.70 million based on current exchange rates.

SIX SHIB Addresses
SIX SHIB Addresses

This discovery has piqued the curiosity of the community, leading market participants to speculate whether this occurrence is merely coincidental or if all the addresses are affiliated with a single entity, particularly an exchange. However, no on-chain data points to an affiliation with an exchange.

Critical Look at the Shiba Inu Addresses

Interestingly, further examination of the addresses indicates a discernible pattern confirming their association with the same entity. One of the six addresses initially acquired 30 trillion Shiba Inu tokens on March 31, 2021, seven months after the launch of SHIB. At that time, the assets were valued at $1.8 million but have since appreciated to a staggering $663 million.

After receiving the 30 trillion tokens, this genesis address held onto the tokens for eight months without offloading any of them. Then, from Nov. 4 to 6, 2021, the wallet sent 5 trillion tokens to each of the other five addresses, while retaining a share of 5 trillion for itself.

None of the six addresses, including the genesis address, has sold any tokens since November 2021, maintaining ownership of the 5 trillion SHIB for over two and a half years amid market volatility and fluctuations. This consistent behavior raises further speculation regarding their intentions and the entity behind them.

Moreover, in addition to their substantial SHIB holdings, none of the addresses holds a significant amount of another cryptocurrency, and none has made any transactions since November 2021. By collectively holding 30 trillion tokens, these addresses are in possession of 5% of the entire Shiba Inu circulating supply.

As of now, determining the entity linked to these addresses remains challenging. However, the data suggests the involvement of an early investor with a commitment to holding their position. Notably, at SHIB’s peak value of $0.00008845, the 30 trillion tokens were valued at an impressive $2.65 billion.
Shiba Inu Breaks Below Bull Pennant, is $0.0000348 Still Feasible?

0

Shiba Inu has broken below a bull pennant formed on the 6-hour timeframe, raising questions of its ability to mount a recovery toward the initial $0.0000348 target.

The ongoing crypto market downtrend, which picked up on April 8, has persisted for over a week now, leading to massive declines in cryptocurrency prices. SHIB has taken a hit along with the rest of the altcoin market, dropping below crucial support levels to trade at $0.000022.

At the start of the latest downturn, market analyst MBM Crypto confirmed on April 9 that Shiba Inu had formed a bullish pennant on the 6-hour chart following its drop from $0.000045 on March 5. This bull pennant held for five weeks, with no breakout to either side in sight.

Shiba Inu Breaks Below Bull Pennant

During his initial analysis, the analyst suggested that SHIB could record a breakout to the upside when the ongoing market correction slows. According to him, if Shiba Inu pushes toward $0.0000301, investors should enter the market, as this price would serve as the launchpad for a breach above the upper trendline.

He then set three modest price targets that market participants should expect after this breach occurs, with the first target stationed at $0.00003130, the second at $0.00003280 and the third one along the March 14 high of $0.0000348. 

Shiba Inu 6H Bull Pennant

Notably, bull pennants typically feature breakouts to the upside, solidifying MBM Crypto’s conviction of an imminent uptrend. However, as the bears exerted more pressure on the broader market, Shiba Inu faced greater selloffs. As a result, SHIB eventually broke to the downside of the pennant when it slumped below the $0.000026 on April 12.

The analyst had set a support zone between $0.00002446 and $0.00002670, which he expected to hedge against any further declines in the event of a downward breakout. However, SHIB further breached below this support zone amid the downturn, collapsing to $0.000022.

Analysts Remain Optimistic

Shiba Inu’s slump below the bull pennant and the crucial support zone has triggered questions on the feasibility of a reclamation of the $0.0000348 target. Despite the downward push, SHIB still has the potential to recover to the $0.000034 territory, largely dependent on when the broader market rebounds.

Notably, chart data confirms SHIB is currently leaning toward undervalued territories, with its CCI currently at -118.30 and RSI sitting at 39.51 on the daily timeframe. This signals room for potential growth. In addition, Shiba Inu is now witnessing a resurgence of interest, with Open Interest recording a considerable surge.

Shiba Inu Undervalued

Multiple industry commentators expect Shiba Inu to engineer a recovery from these lows, with projections of price targets at $0.0001. Some analysts expect SHIB to surpass this level and reach $0.001 after the Bitcoin halving. SHIB currently trades for $0.00002225 at the reporting time.

Shiba Inu Can Surge 884,400% to $0.19 if SHIB Repeats Post-halving Uptrend of 2021

If Shiba Inu repeats its post-halving uptrend of 2021, it will record an extraordinary gain of 884,400% to reach a price of approximately $0.196.

Shiba Inu encountered a substantial obstacle after the commendable March rally that took it to $0.000045. Its price first stalled around the $0.00003 threshold for the rest of March. SHIB further relinquished more gains to the bears, collapsing by 59% from the March peak to as low as $0.00001853 last week.

However, enthusiasts are now pinning their hopes on the Bitcoin halving this week for Shiba Inu’s potential recovery. They draw optimism from historical precedents, particularly the pattern of bullish runs that often follow Bitcoin’s halving events.

For instance, Bitcoin halved in May 2020 at $8,374. Five months later, its price embarked on a bullish trajectory and maintained it into the new year. BTC reached $64,863 by April 2021 before a temporary pullback.

The premier crypto resumed its bullish momentum until November 2021, when it reached a new all-time high of $68,789. This impressive surge represented a staggering rally of over 721% since the halving event.

Shiba Inu Trajectory Post-halving 2021

Interestingly, Shiba Inu was not even in existence at the time of Bitcoin’s May 2020 halving. SHIB made its debut three months later with as much as nine leading zeros. 

Initially, SHIB saw minimal trading activity during Bitcoin’s initial surge in late 2020. It was not until January 31, 2021, that Shiba Inu saw a significant trading volume of $5,708,932, with a price of $0.00000001.

Shiba Inu 2021 History
Shiba Inu 2021 History CoinMarketCap

From that point onward, SHIB consistently maintained trading volumes of thousands of dollars and sometimes millions. By the time Bitcoin reached its first $64K peak in April 2021, SHIB had set its own record price of $0.00000417.

Remarkably, while Bitcoin reached its new high at $68,789 in November 2021, Shiba Inu had already achieved its own peak at $0.00008845 in October 2021. From January to October that year, Shiba Inu experienced an incredible surge of 884,400%.

Shiba Inu Repeating History

If Bitcoin were to replicate the 721% surge it experienced post-halving, with its current price around $63,000, it would reach a price above $500,000. Similarly, if Shiba Inu were to repeat history and surge by 884,400%, with its current price at $0.00002221, it would theoretically reach $0.196.

However, prominent forecasting platforms do not foresee Shiba Inu reaching this price in the next two decades, let alone during this bullish season. As a result, market participants should not regard this evaluation as investment advice.

Open Interest for Shiba Inu Soars on Bitget, Huobi, OKX After 9.75% Gain

Shiba Inu has seen notable upswings in Open Interest on top exchanges today after rallying 9.75% in the last 24 hours.

Earlier today, Shiba Inu momentarily flashed signs of recovery from the recent landslide dip by rallying to a high of $0.00002296. This figure marked a 9.75% gain from the low of $0.00002092 SHIB recorded yesterday, April 16.

The increase in Shiba Inu’s value mirrors a gradual resurgence of investor interest in the asset after the Saturday restest of the $0.000018 range. According to insights from Coinlyze, there has been a significant rise in Open Interest (OI) for Shiba Inu on leading exchanges. 

Soaring Open Interest for Shiba Inu on Exchanges

Specifically, SHIB Open Interest on Huobi soared to $15.7 million, while OKX recorded a figure of $14.6 million. Other tracked exchanges, such as Kraken, BitMex, and Bitfinex, witnessed below $1 million in Shiba Inu Open Interest.

Shiba Inu Open Interest on exchanges
Shiba Inu Open Interest on exchanges Coinlyze

For context, Open Interest refers to the total number of outstanding Shiba Inu contracts that have not been settled. It indicates the level of market activity and investor interest in SHIB futures contracts on these exchanges.

This metric suggests that beyond the usual optimism surrounding returns, an increasing number of risk-tolerant traders anticipate significant movement for SHIB soon. However, the Long/Short Ratio, which currently has a value of 0.9406, suggests that more traders are betting on a Shiba Inu price drop.

Notably, data from Coinglass offers more insights into the current trend of leveraged trading for Shiba Inu. In particular, the statistics indicate that Open Interest for Shiba Inu across exchanges Bitget, Huobi, OKX, BingX, CoinEX, Kraken, and BitMex stands at 2.39 trillion SHIB tokens. 

Bitget leads with 814 billion tokens, showing a 0.41% gain in the last hour. BingX and CoinEx had the most significant positive 24-hour changes, 8.45% and 4.5% increases, with OI of 117 billion and 33 billion SHIB, respectively. 

However, the overall cumulative Open Interest for Shiba Inu across all tracked exchanges in the last 24 hours is negative, at 3.81%.

More Bullish Factor for SHIB

Another bullish indicator for Shiba Inu evident on-chain is the consistent decline in SHIB tokens held on exchanges since the bull market’s start in October 2023. 

Shiba Inu CryptoQuant
Shiba Inu Exchange Reserve | CryptoQuant

This trend has persisted even as Shiba Inu experienced dips in March and April, indicating that long-term investors maintain a positive outlook on SHIB. 

Cardano Poised for Surge Above $3, Analyst Predicts

0

Market analyst Trend Rider analyzes Cardano’s potential for growth amidst market volatility, highlighting key support levels and historical patterns.

Cardano (ADA) is experiencing significant volatility, primarily driven by geopolitical tensions and the forthcoming Bitcoin halving.

Despite this, Cardano’s trajectory has been marked by a steady, though slow, rise, catching the eye of market analysts and investors alike.

Trend Rider, a recognized cryptocurrency analyst, recently brought attention to ADA’s potential for a significant uptick. Drawing parallels with its performance in October 2020, when ADA fell to $0.10 only to climb to a peak of $3, Trend Rider suggests a similar bullish run could be on the horizon.

“ADA appears to be on the brink of its ultimate support test, much like before its previous monumental rise,” he noted.


The latest RSI analysis indicates a pivotal moment for Cardano as it faces a crucial support test. Historical data shows that RSI crossovers have reliably signaled the start of bull and bear markets for ADA. The RSI is again interacting with its moving average, which was previously followed by significant price movements.

Trend Rider’s weekly analysis of ADA reveals a critical juncture as it finds a ‘sweet spot for longs’ between $0.45 and $0.50, deemed crucial for sustaining the uptrend. If ADA holds this zone, the next bull run phase could be triggered, with eyes on the $1.00 critical level. Conversely, a break below could quickly fill the gap to $0.25, a critical level that could come into play.

Trend Rider weekly analysis (source:X)

Market Dynamics and Community Response

Trend Rider elaborated on the community’s reaction to the recent price dip, stating, “While fear has certainly crept into the community, the underlying support levels are stronger than ever, setting the stage for a potential bullish breakout.”


Moreover, if ADA manages to sustain these levels, it could trigger a rally, echoing its past resilience and rewarding its patient investors. This scenario underscores the cyclical nature of cryptocurrencies, where historical patterns and technical indicators often guide future performances.

In the last 24 hours, Cardano’s ADA has demonstrated notable volatility, swinging to a peak of $0.4722 and establishing support at approximately $0.45. ADA later settled near $0.46, showcasing a rebound from intraday lows. The market sentiment is cautiously optimistic as ADA tests resistance levels.

Shiba Inu Set for Super Cycle, Says Team Market Lead

0

According to the Shiba Inu ecosystem market lead Lucie, SHIB is set for a super cycle following the completion of Bitcoin’s (BTC) latest re-accumulation cycle in 2023.

Lucie revealed her BTC analysis chart in a recent post on X, portraying market movements from 2014 up to a speculative 2025. The marketing lead highlighted three distinct phases in the BTC market — the ‘Bottom’, the ‘Re-accumulation’ phase, and finally the ‘Bull Market.’

For context, the market bottom forms when a market downtrend stops, finding support at a specific price, and then reversing the trend to the upside. In Lucie’s chart, the latest BTC market bottom formed in November 2022 when BTC dropped to $15,479. However, SHIB did not bottom until June 2023, when it hit lows at $0.000005.

Re-accumulation phases signify stabilization of the market as investors start to re-enter the market — following the establishment of a market’s bottom. The chart shows that Bitcoin’s latest re-accumulation phase started in March 2023 and concluded in late 2023.

Within this period, BTC traded within a range of $24,840 and $31,875. Similarly, Shiba Inu also saw a price uptick shortly after it bottomed in June 2023. However, SHIB’s re-accumulation phase did not feature a substantial price growth.

With the re-accumulation phase now over and the market slipping into the bull run, Bitcoin’s price has increased, surpassing the 2021 ATH. In late February, SHIB price also began to increase, reaching highs of around $0.000045 — up 450% and just over halfway to its all-time high (ATH) of $0.00008845.

SHIB Price Market Sentiment

Despite the recent market collapse, the upcoming halving event is expected to further bolster price actions. Lucie previously noted the expectation that SHIB would reach its ATH soon before or shortly after the Bitcoin (BTC) halving event, expected by April 20.

SHIB currently trades around $0.000022 at the time of writing, meaning Lucie’s prediction still has at least until May to be proven correct or false. She has previously mentioned her long-standing belief in the project’s future and its potential to reach $0.01. 

What To Expect

As a result of recent events — including building tensions surrounding Federal Reserve rate alterations and geopolitical tensions in Israel — SHIB price is down almost 20% on the month alongside the rest of the market.

Crypto Gem Finder, a market analyst, reinforces Lucie’s predictive analysis, suggesting that SHIB may be set for potential bullish momentum as the BTC halving event looms just days away. 

However, in light of institutional liquidity involvement in the market and the introduction of the Bitcoin ETF in January, there is no historical precedent reflective of the upcoming BTC halving. 

Research Platform Unveils 14 Altcoins Set for 100X Gains

Token Metrics, the AI-powered investment research platform, has revised its selection of cryptocurrencies poised to potentially yield gains up to 100 times in light of the recent market downturn.

This time, the platform spotlighted 14 cryptos it believes can set investors financially free when the bulls re-emerge. In an earlier post, Token Metrics pinpointed 27 cryptocurrencies worth investing in for a potential 10,000% gain.

100X Potential Tokens

In the latest disclosure, leading the pack for 100X potential tokens are low-cap emerging cryptocurrencies such as LCX, Nexera (NXRA), Swarm Markets (SMT), and Astra DAO.

Notably, the listed tokens in the category have been standout performers since last year, except ASTRADAO. For instance, amid recent market declines, SMT maintains a 530% gain in its one-year trajectory. Meanwhile, ASTRADAO shoulders a staggering 81% decline over the past year. 

Yet, Token Metrics believes ASTRADAO and others in this group can potentially net investors over 10,000% gains in this bull market.

Tokens with 50x Potential

Token Metrics’ category of assets with 5,000% potential this season includes some notable projects such as Injective (INJ) and MultiversX (EGLD). INJ now shoulders a substantial 38% loss in its 30-day trajectory amid the Saturday crash. Yet, it retains a one-year growth of over 180%.

Conversely, EGLD is a notable underperformer, wielding losses across the last 30 days and one year. Nonetheless, the research platform believes EGLD could expand its price by over 50X between now and next year. Other cited tokens in this category include emerging projects NEXA and Neurai (XNA).

Coins with 10x to 30x Potential

This category includes notable tokens Kaspa (KAS), Chainlink (LINK), and Quant (QNT). KAS and LINK have demonstrated a capability for a commendable performance in a bull market. For instance, KAS retains 336% gains in its one-year trajectory while LINK holds 60%.

Meanwhile, QNT has been an underperforming asset since last year. The recent market dip invalidated the gains accrued in March and late 2023. Token Metrics’ outlook for KAS, LINK, and QNT is to witness 1,000 to 3,000% gains by next year.

Tokens with 3x to 10x Potential

This tier comprises top ten ranking projects Solana (SOL), XRP, and Dogecoin (DOGE). Despite the market-wide dip, Dogecoin retains an over 7% gain in its 30-day trajectory. Dogecoin emerged as a standout performer in the bull market in February and continues to trade at price points last seen in 2021.

Meanwhile, Solana has established itself as potentially the best performer among the top ten, with its steady uptrends since 2023. 

Token Metrics anticipates that DOGE, SOL, and XRP may experience gains of up to tenfold during this season. While SOL and DOGE have demonstrated their potential, XRP has yet to establish a compelling track record for significant gains in this bullish market.

Analyst Reveals XRP Breakout Signal as Monthly Bollinger Bands Tightens to Historical Levels

0

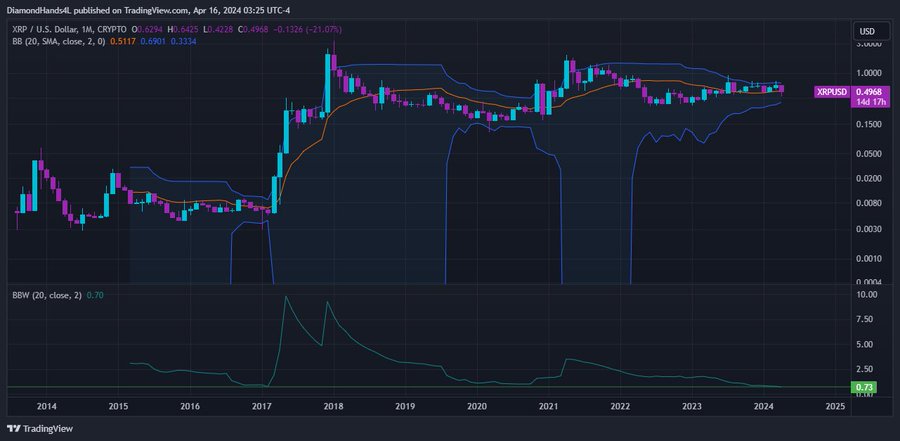
According to crypto analyst Charting Guy (CG), XRP monthly Bollinger Bands (BBs) have reached a historical record-breaking range at a width of 0.70—the tightest they have been since hitting 0.73 in 2017.


When the XRP monthly BBs previously reached the 0.73 level in February 2017, it preceded a significant price surge from a low of $0.005 that month to the all-time high of $3.3 in January 2018, marking a 65,900% upsurge in a year.

XRP Bollinger
Image Source: https://twitter.com/ChartingGuy/status/1780429759534845960

What This Tells Us

The analytical BBs indicator is a popular tool employed by traders that helps determine how volatile a market price is for any given asset. The wider the range of the BBs indicator, the more volatile the market price. 

However, as in the case of XRP’s monthly BBs, the narrowing of this range indicates a reduction in volatility and, often, a breakout to the upside. 

At a range of 0.70 — surpassing the lowest and tightest range it has been since the previous breakout to the upside — the BBs indicate XRP may be set for a significant rise in price. 

XRP Price Market Sentiment

Shortly after CG presented his charts on X, the community market sentiment varied in response to the analysis. Community concerns included the possibility of a price breakout in either direction and apprehensions of a possible dump.

CG responded to both concerns by stating that the upward slope of the 20 SMA (depicted by an orange line) strongly indicates a potential breakout to the upside.

Here, CG is referring to the 20-day Simple Moving Average (20 SMA), an indicator that calculates the average price over 20 days. With the 20-SMA moving upward, it suggests that average daily closing prices are progressively increasing, indicating an uptrend in price.

What To Expect

The narrowing of the BBs to historical all-time lows (ATLs) for XRP price is indicative of minimal volatility in price, but it should be considered carefully. As just one indicator of expected volatility, it should be considered against ongoing events.

Amid the Israel-Iran conflict, the Ripple vs. SEC lawsuit, and general market volatility incited by geopolitical tensions, indicator signals may not be reflective of future market expectations.

Ripple Partner Tranglo Uses XRP in All Real-time Transactions

Prominent XRP community figure Chad Steingraber recently raised awareness of how the Ripple Payments (formerly ODL) partner Tranglo uses XRP for real-time transactions.

Steingraber shared the update in line with Tranglo’s effort to facilitate real-time settlement systems across various countries using the Ripple Payments solution, which leverages XRP.

Tranglo XRP-based Payment Process

Notably, Tranglo’s payment process, which uses Ripple’s solution for real-time settlement, involves just five steps.

The first step involves the remittance licensee requesting bulk pre-funding via RippleNet at Tranglo. Then, for the second step, the remittance source draws down the requested amount in XRP from a digital wallet, Ripple’s On-Demand Liquidity service.

In the third step, XRP is sent to Tranglo’s Exchange account and exchanged for fiat currency. Fourthly, the licensee’s wallet in Tranglo’s system is credited with the requested amount for remittance payout. Lastly, Ripple issues an invoice to the licensee for payment.

Notably, Tranglo’s adoption of Ripple’s ODL service across all its payment routes dates back to March 2022. This move enabled remittance providers to facilitate swift cross-border payments without the burden of expensive pre-funding.

Tranglo had acknowledged that it embraced Ripple’s ODL following the successful pilot deployment in September 2021. During the initial 100 days, the pilot processed 250,000 transactions totaling $48 million.

Following its partnership with Ripple, Tranglo allowed small and medium enterprises to process $970 million in 2022 through Ripple’s ODL. This figure represented a remarkable 1,729% increase from the $53 million Ripple’s ODL processed earlier.

Also, while Tranglo processed $1.3 billion in 2018, the figure ballooned within four years to $3.3 billion in 2022 amid the Ripple partnership. According to records on its official website, the Ripple partner has witnessed 46 million transactions with a total transaction value of $11.81 billion.

Tranglo notably facilitates real-time settlement for countries like Singapore, Malaysia, and the Philippines.

Impacts on XRP Price

In a subsequent update, Chad Steingraber suggested that XRP barely witnessed any price impact amid these ODL payments utility because the transactions occur over-the-counter (OTC) rather than public crypto exchanges.

Other prominent community figures, like Panos Mekras, have also emphasized this view. Besides, Ripple has acknowledged that it engineered ODL to have a demand-neutral effect on XRP.

XRPL AMM Pools Surpass 315, Locked XRP Now Above 2,200,000

0

The latest on-chain data indicates a significant increase in XRP tokens locked within the XRPL AMMs, reaching a high of 2,272,919 XRP in the last 24 hours.

Over the weekend, the XRPL experienced remarkable growth in its decentralized finance (DeFi) sector. AMM pools increased from 277 to 316, indicating rising user engagement. Concurrently, the volume of XRP locked within these pools witnessed a robust increase, going from 1.8 million to 2.15 million.

Recent data from XRPScan shows a sharp increase this week. The ecosystem currently boasts 209 total assets, 203 unique tokens, and 184 XRP pairs available for trading. The active pool count has also surged to 324, with the total XRP locked crossing 2.27 million.

This escalation underscores growing confidence in XRPL’s DeFi capabilities and liquidity provisions. The surge in active pools and the locked XRP tokens points to a dynamically expanding ecosystem.

The Impact of Liquidity on Market Dynamics

Despite the modest proportion of the total XRP supply locked in XRPL AMMs, analysts observe the potential for this increasing trend to contribute to market shifts. The USDC/XRP pool currently holds the highest volume, with experts cautiously anticipating how this locked liquidity could affect the XRP market.

Media personality Zach Rector states that while an immediate XRP supply shock isn’t expected, the growing use of XRP for diverse utilities, development of bridges, and strong holders are progressively reducing its liquid supply, with a potential supply shock scenario unfolding over the next 5-10 years.

In the last 24 hours, XRP price action has shown a volatile yet bullish trend. After a dip to $0.4884, XRP rebounded, peaking above $0.50. The fluctuations reflect active market trading, with XRP sustaining gains near this upper level, consolidating around $0.498 at the reporting time.

This pattern of liquidity growth within the XRPL AMMs reflects the progressive nature of the network’s DeFi engagements. The impressive surge in locked XRP comes merely a week after the ecosystem approved an amendment fix to address an issue observed in the AMM code.