Home Blog Page 1537

Top Investigator Claims Ripple Sells XRP to Buy Bitcoin

A crypto investigator, widely recognized as “Mr. Huber” on X, claims that Ripple often liquidates its XRP holdings to buy Bitcoin, especially during times of significant market upturns for BTC.

Mr. Huber recently reestablished this claim as market participants continue to scrutinize XRP’s underperformance amid its monthly inflation due to Ripple’s persistent escrow unlocks and sales.

The crypto sleuth initiated the conversation on X by calling attention to XRP’s supply increase compared to other assets like Bitcoin, Ethereum, Cardano, and Solana, which have been top performers in this emerging bull run.

Responding to the post, BTC enthusiast Franco Cappello pointed out a graph of XRP’s performance in relation to Bitcoin. The graph depicted a pronounced downtrend for XRP against BTC since July 2023 after XRP briefly rallied to $0.93.

Considering XRP’s downtrend against BTC, Cappello alleged that Ripple increased its Bitcoin holdings through the period. He claimed XRP’s underperformance resulted from Ripple exchanging XRP for Bitcoin.

“Ripple says they let XRP ‘breathe’ in XRP/USD, but I propose they let XRP breathe in XRP/BTC,” Cappello remarked.

However, Capello had no concrete evidence to back up his claims, ascribing it to “common sense.” He claimed that since Ripple understood BTC’s value was bound to take impact amid ETF approvals, it was logical to assume Ripple liquidated XRP to buy Bitcoin. 

Crypto Investigator Agrees

Famous XRP community investigator Mr. Huber attested to the claim, similarly arguing that it is inferable that Ripple sells XRP for Bitcoin. However, he provided more background to his argument.

Mr. Huber highlighted that Ripple is in a liquidity business that requires it to hold Bitcoin, Ethereum, and other crypto assets. He noted that XRP accounts for the firm’s most liquid crypto holding.

Accordingly, he noted that Ripple must liquidate XRP for other crypto assets used in their On-Demand Liquidity service (now Ripple Payments).

Furthermore, Mr. Huber claimed that when Ripple’s XRP liquidity notably decreases, the company would sell off other assets to repurchase XRP “to build price momentum.” Moreover, he asserted that Ripple typically repeats this process in a cyclical manner.

“[They have been] selling XRP for years to buy BTC. But who am I to create these conspiracy theories,” the crypto sleuth submitted.

Notably, Mr. Huber has been a longstanding champion of the view that Ripple repeatedly sells an underperforming XRP for a better-performing Bitcoin. A few weeks ago, he speculatively attributed Bitcoin’s surge to Ripple by claiming:

“[Ripple] might also be the ones pushing Bitcoin up by buying Bitcoin with XRP first, to then sell Bitcoin at its peak to buy XRP.” 

Analyst Sets XRP Cup and Handle Target of $31, with Fib Target of $50

0

A market analyst and prominent chartist set multiple price objectives for XRP, leveraging several chart patterns. The ultimate Fibonacci target is $50.

Cryptobilbuwoo, a widely known analyst, remains optimistic about XRP’s potential despite the downturn the crypto asset currently faces. Recall that XRP suddenly spiked to a new yearly high of $0.7442 on March 11, closing the day with an impressive 18.84% gain.

However, the token faced a major rejection at the $0.74 territory, leading to a massive retracement that saw it collapse 4.88% the following day. This correction has continued, with XRP currently down 8.4% from the $0.7442 high.

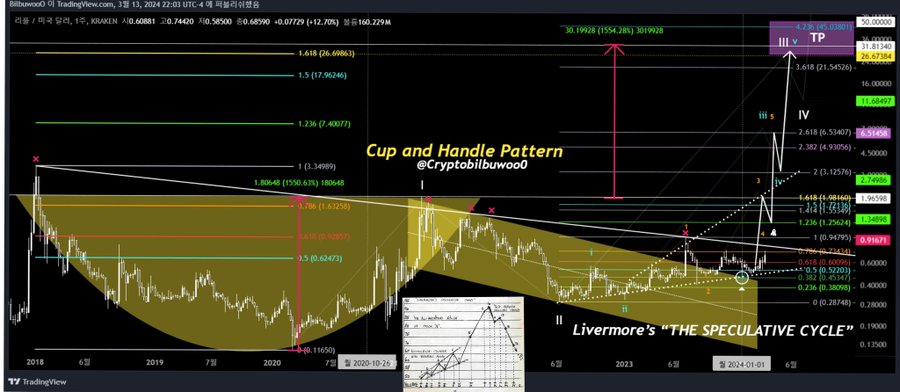
Cryptobilbuwoo believes XRP’s current underperformance is temporary and anticipates a price uptrend in the future. To this end, he leveraged three patterns on the weekly chart to identify a range of ambitious price targets for XRP when this uptrend begins.

XRP Cup and Handle Pattern: $31 Target

The most visible setup on the chart is the cup and handle pattern. This bullish pattern typically forms when an asset’s price experiences a rounded bottom (cup) followed by a consolidation period (handle) before breaking out to the upside.

Data from the analyst’s chart shows that XRP formed the cup when it collapsed from $3.3498 ATH in January 2018 to a bottom price of $0.1165 in March 2020 and then recovered to a value of $1.9659 in April 2021.

Image Source: https://twitter.com/Cryptobilbuwoo0/status/1768099266181136389

The asset formed the handle amid the consolidation trend recorded since the slump from the April 2021 high. Taking insights from the cup and handle pattern, Cryptobilbuwoo sees XRP soaring to a $31 target, marking a 4,449% rise from its current price.

Fibonacci Targets from $21 to $50

Besides the cup and handle pattern, Cryptobilbuwoo also leveraged an Elliott Wave structure. This structure typically features five waves, and the analyst believes XRP is currently trading within Wave 3. According to him, the third wave would end with a surge to the Fibonacci range of 3.618 to 4.236.

This Fibonacci range aligns with a price target ranging from $21.54 (Fib. 3.618) to $45.04 (Fib. 4.236). XRP must rally 3,061% to hit the $21.54 price level, but a more substantial 6,509% surge would be required to clinch the $45.04 price.

Despite the ambitious nature of these targets, Cryptobilbuwoo sees higher goals for XRP. The analyst’s last pattern is the long-term pivotal Fibonacci zone of 1.618. The chart shows that this Fibonacci ratio aligns with the XRP price range of $26.6 to $33, with an ultimate overshooting target of $50.

Meanwhile, XRP trades below the $1 level, changing hands at $0.6814. Amid the sustained decline since March 11, market interest has reduced, with the token seeing a 35% decline in volume over the last 24 hours to $2.348 billion.

Crucial Date in Ripple V SEC Lawsuit Approaches 

0

The SEC v. Ripple lawsuit is fast approaching a critical date that could determine the appropriate penalty Ripple would pay for violating U.S. securities laws.

Prominent XRP lawyer James K. Filan called attention to the development in an X post today.

SEC to File Remedies Opening Brief on March 22

Specifically, the SEC is expected to file its opening brief with respect to remedies by March 22. Recall that the opening brief was initially scheduled to be filed on March 13, 2024.

However, the court extended the deadline earlier this month based on the SEC’s request. With just eight days left before the brief is submitted in a New York federal court, lawyers for the commission are expected to tender relevant facts that could prompt the judge to impose a heavy penalty against Ripple.

The SEC previously noted that it needed the extension to review Ripple’s audited financial statements. Therefore, the SEC might cite some relevant portions of the financial statement in its opening brief.

Ripple Opposition and SEC Reply to Follow

After the SEC submits its opening brief, Ripple will file an opposition to it by April 22. The date was initially set for April 12 but was extended at the SEC’s request. In its remedies-related opposition brief, the leading crypto payments company is expected to counter the SEC’s claim in a bid to receive a lesser penalty.

Afterward, the SEC will file its reply by May 6, a date that was initially scheduled for April 29, 2024. This upcoming motion would address some arguments made by Ripple’s lawyers and emphasize why a massive penalty should be imposed against the company.

Upon completing the remedies briefing, the court will set a date for the verdict and issue the appropriate penalty for Ripple’s violation of securities laws via its institutional XRP sales.

Potential Fine

The monetary value of the XRP Ripple sold to institutional clients was $770 million. However, a prominent lawyer and U.S. Senatorial candidate, John Deaton, believes Ripple would not pay up to $200 million as a fine. 

On the other hand, prominent crypto analyst Zach Rector speculates that the company could pay up to $3 billion if the court finds ODL-related XRP sales to be securities.

Analyst Expect Solid Strikes for XRP with $5.85 Target

A technical analyst believes XRP could be engineering another explosive rally amid a recent breakout, targeting $5.85 in the coming weeks.

XRP saw a notable surge on March 11, with its value skyrocketing by over 20%. In particular, the asset climbed from approximately $0.61 to surpass a new yearly high above $0.7440.

This rapid surge in XRP’s value was particularly noteworthy as it unfolded within a mere four-hour window, contrasting with its previously lackluster performance.

Moreover, XRP’s shocking price rally propelled it to become a top gainer in the market on Monday evening. Nonetheless, following this surge, XRP experienced a corrective pullback.

Yet, it maintains a notable 13% surge in its seven-day performance. With its current value at $0.69, XRP continues to trade at levels last seen in 2023. Amid this development, prominent analysts such as Dark Defender have issued an update on their XRP target for this bull season.

XRP Now Closer to $1.35 Target

In a recent post on X, Dark Defender highlighted that the March 11 breakout occurred just as expected. He noted that XRP’s candlestick patterns on the 30-day timeframe had flashed the much-awaited bullish signal.

Furthermore, the analyst emphasized that the 20% surge has enabled XRP to surpass the stern resistance level of around $0.6649, which is now confirmed by the asset’s daily timeframe. Dark Defender suggested that what remains now is confirmation of XRP’s weekly and monthly timeframes.

Accordingly, the analyst contends that XRP is now closer than ever to reaching its mid-resistance target of $1.33. Given its current market value, achieving this $1.33 target would imply another imminent 90% rally. He urged XRP holders to anticipate this significant move soon.

$5.85 in the Coming Weeks

Furthermore, Dark Defender has set even higher targets for XRP in this bull season, aiming for $5.85 “in the upcoming weeks.” Achieving this extraordinary price level would demand a bullish rally of 747% from XRP’s current market value of $0.69. 

Meanwhile, Dark Defender is not the only prominent crypto analyst foreseeing XRP rallying more than 747% soon to $5.85. Analyst DustyBC has pointed out that XRP is now breaking a 6.5-year downtrend following the recent surge. In parallel, market watcher Mikybull remarked that XRP is set for the $6 target.

Can Shiba Inu Hit $0.01 With Burns As SHIB Rallied 27523% to $0.00003 Without Shibarium Burns

0

Shiba Inu has the potential to record an impressive bull rally amid the ongoing Shibarium burns, having skyrocketed 27,523% to $0.00003 in 2021 without any burns.

The crypto market is fast slipping into the bull run phase, and some analysts expect impressive rallies from major altcoins. Shiba Inu has captured the attention of the broader community, with multiple projections of an imminent rally amid the bull run.

Market watchers have adjusted these projections to more ambitious targets following SHIB’s recent sudden price spike. The crypto asset rallied by nearly 300% to the $0.000045 top, rejuvenating investor optimism and reigniting predictions of a rally to the $0.01 price level.

While most proponents have dismissed this target as wishful thinking, others point to the current dynamics surrounding the Shiba Inu ecosystem as a possible trigger. These include the growth of the ecosystem, pivotal partnerships, and Shibarium burns. 

The Shibarium burns are an avenue through which the ecosystem team looks to drastically reduce Shiba Inu’s circulating supply, a trend capable of bolstering an upward push in Shiba Inu’s price when mixed with sufficient demand. 

Shiba Inu Rallied 27,563% Without Burns

Due to the importance placed on burns, Shiba Inu enthusiasts have long believed that Ethereum co-founder Vitalik Buterin’s historic 410 trillion token burn was the major catalyst of Shiba Inu’s monumental surge during the 2021 bull run.

However, The Crypto Basic confirmed last September that while Buterin’s burn contributed to the 2021 price surge, it was not the sole catalyst. According to Shibburn, a community-driven burn tracker, demand was one of the factors that catalyzed the price run.

Notably, it bears mentioning that Shiba Inu did record an impressive run even before Buterin’s burn occurred. Notably, as of April 12, 2021, SHIB traded for $0.00000011. Interestingly, the token skyrocketed to a high of $0.00003043 on May 12, 2021.

This upsurge marked a massive 27,563% rally in just a month. Shiba Inu witnessed this impressive price run before Buterin’s burn. The surge also came at a time when there was no burn mechanism, underscoring the asset’s potential for monumental rallies.

Could SHIB Hit $0.01?

Now that Shiba Inu has witnessed periodic burns from community members, ecosystem projects, and Shibarium, market watchers expect it to perform even better. Recall that Shiba Inu developers burned a whopping 13.4 billion SHIB last week.

For now, the Shibarium burns are manual, requiring a minimum of $25,000 accumulated in BONE to trigger a manual burn. With the network allocating 70% of its base transaction fees to burn Shiba Inu, more transactions would result in more burns. However, the ecosystem team already plans to automate the burn process. This would ensure that the network automatically executes burns when the necessary conditions are met.

As these burns continue to pile up, with sufficient contributions from Shibarium, discussions around the $0.01 price goal have resurfaced. For context, SHIB would need to rally 30,688% from its current price of $0.00003248 to reach the $0.01 price.

Components now believe this 30,688% surge in this bull run could be possible, considering Shiba Inu surged 27,53% in the previous bull run without any burns. However, the asset’s supply is its biggest hindrance, as the $0.01 price would lead to a $5.8 trillion at the 589 trillion circulating supply.

Milei Moneda Revives Market Excitement On New Launches While Injective And SUI Struggle To Make Gains

0
  • $MEDA is the best crypto to invest in in 2024 as investors have
  • Over the past year, Injective has increased by 1,515.01%; it could be a top crypto to buy in
  • SUI may see a 54% increase by 2025.

Injective and SUI have been struggling in the crypto market, with INJ dropping 1.07% in price over the past week, according to CoinMarketCap data. Meanwhile, SUI could only manage a 2.02% increase over the past week. However, the market is excited over the birth of Milei Moneda, which investors have tipped to be among the best cryptocurrency to invest in.

Economize LikeMilei: Invest in $MEDA!

Milei Moneda Reviving Market Excitement With Its Presale

With the vision to transform the crypto ecosystem by enabling transparent exchange, Milei Moneda embodies the spirit of free-market economies. Milei Moneda provides investment opportunities for savvy investors while integrating market-based valuations and promoting transparency.

Milei Moneda‘s deflationary token, popularly known as $MEDA, is placed in a liquidity pool where it will be locked till October 2027. Furthermore, holders of $MEDA are vested with voting rights. Even with huge returns expected for the token, Milei Moneda operates with zero percent taxes.

$MEDA is considered to be among the best crypto for beginners. Milei Moneda stands out from other tokens as it is not subjected to external influence. It is proof of the positive impacts of unregulated markets and financial autonomy.

In the ongoing presale, $MEDA, which is in Stage 1, is valued at $0.010. $MEDA will go for $0.0125 in Stage 2 and $0.015 in Stage 3. Then, $MEDA will launch at $0.020 on major exchanges. This indicates a 100% return on investment (ROI) from its initial price.

Economize LikeMilei: Invest in $MEDA!

Injective (INJ) Price Analysis & Prediction: Will INJ Price Bounce Back Soon?

Over the past month, Injective (INJ) saw an 18.01% rise in price, and compared to its price a year ago, INJ has increased by 1,515.01%. Recently, Injective (INJ) has been struggling, losing 1.07% of its value over the past week. However, there is every reason to be optimistic and believe Injective (INJ) will bounce back soon and become one of the top crypto coins of 2024.

Technical indicators reveal that Injective (INJ) is in bullish sentiment, with 24 indicators revealing bullish signals with just two indicators signaling bearish signals. Also, INJ is in Extreme Greed after having a score of 79 in the Fear & Greed Index. Furthermore, over the past month, Injective (INJ) recorded 16/30 green days (53%) with price volatility of 8.35%.

Experts predict that by 2025, the Injective (INJ) price could have a minimum and maximum value of $41.21 and $195.82, respectively.

SUI Price Analysis & Prediction: Will SUI See More Gains?

Over the past month, SUI’s price dropped 6.70% and, when compared to its price a year ago, has also declined by 64.62%. However, SUI has made gains over the past week, increasing its price by 2.74%. This increase may be the start of something special, and we can only hope SUI can become one of the best cryptos to invest in.

SUI is one of the altcoins with Extreme Greed after having a score of 79 in the Fear & Greed Index. Also, over the past month, SUI has recorded 14/30 green days with price volatility of 6.53%.

Considering SUI’s historical price movements, experts believe that SUI could have a yearly low value of $1.61 and a high of $7.59 by 2025. Therefore, if SUI reaches its upper-value target, its price could see a 379.54% increase by 2025.

Got $MEDA curiosity? Visit us or chat on Telegram for the inside scoop. Fast, fun, and informative!

Disclaimer: This article is provided by the Client. The Client is solely responsible for this page’s content, quality, accuracy, products, advertising, or other materials. Readers should conduct their own research before taking any actions related to the material available on this page. The Crypto Basic is not responsible for the accuracy of info and any damage or loss caused or alleged to be caused by the use of or reliance on any content, goods, or services mentioned in this article.

Please note that The Crypto Basic does not endorse or support any content or product on this page. We strongly advise readers to conduct their own research before acting on any information presented here and assume full responsibility for their decisions. This article should not be considered investment advice.

Bitcoin Adds 277K Small Holders In 2 Weeks Amid ATH

0

The recent rally that pushed the price of Bitcoin to an all-time high (ATH) above $72,700 has catalyzed the emergence of addresses with less than 0.1 BTC.

According to data from crypto analytics platform Santiment, over the past 2 weeks, addresses holding at most 0.1 BTC have surged by at least 277,000. The retail adoption of Bitcoin across different categories of small holders shows different data.

As a complement to the jump in 0.1 BTC holders, addresses with at least 1,000 BTC dropped within the same timeframe.

Bitcoin Holder Count by Class

With Bitcoin surpassing ATHs, FOMO might be inevitable, thus accounting for the retail boost. Per the Santiment data, the number of wallets with less than 0.1 BTC has grown by 0.6% in 2 weeks. As of March 12, 48.04 million wallets are holding 0 to 0.1 BTC.

The number of wallets with 0.1 to 10 BTC took a 0.8% plunge in the last 14 days. As a major complement, the wallets with 10 to 1,000 BTC saw a 0.5% drop over the same period. While the wallet addresses in the 0.1 to 10 BTC class come in at 4.37 million, the count of those holding between 10 and 10,000 BTC is 151,180.

The Bitcoin whales or addresses holding at least 1,000 are down by 105, having recorded a 4.9% slump in the past 2 weeks. These addresses which have the likes of MicroStrategy Incorporated and El Salvador sum up to 2053.

Bitcoin Profitability Overview

As reported earlier, the profitability of Bitcoin addresses has topped the 100% benchmark, an influence of the ATH price now pegged at $73,637.

With the Bitcoin halving and continuous accumulation of the coin by ETF issuers, the growth prospects of the premier digital currency are enormous. Despite the latest price surge, there are projections for more growth ahead.

Expert Asserts XRP Will Not Miss This Bull Run

Renowned crypto commentator Zach Rector has voiced conviction that XRP will be a notable performer in this bull market despite the heightening pessimism.

Recent statistics show that XRP lags behind 61 digital assets among the top 100 most valuable tokens. Since October 2023, XRP only grew 50% from $0.4878 to its recent yearly high of $0.744.

Through the same window, BNB has surged 191% from $205 to a new multi-year high of $598. Similarly, Solana (SOL) exploded 670% from a mere $22 last October to a peak of $154 this month. A comparable 300% gain is observable with Cardano, Dogecoin, and Avalanche, which all rank in the top ten.

Emphatically, nearly six months into this bull season cycle, XRP stands alone, among the top ten, in its struggle to achieve market-wide compensable performance. XRP’s subpar trajectory continues to stir frustration among enthusiasts who fear missing out on this bull season.

XRP Will Not Miss This Bull Run

However, market pundits like Zach Rector boldly assert that XRP holders will secure their fair share of profitability from the ongoing bull run through XRP.

“I understand it has been a tough ride. [But] I don’t believe XRP will miss this bull run,” Rector remarked in a recent clip.

Rector emphasized that although holding XRP can be challenging, enthusiasts should consider the fundamentals and maintain faith in the asset’s potential. He argued that XRP boasts one of the best value propositions among all crypto projects in the crypto sphere. 

Moreover, he challenged viewers to identify crypto projects with better fundamentals and genuine adoption than XRP.

Essentially, Rector stressed that while other crypto assets have been performing admirably, XRP’s moment will surely emerge. He cited XRP’s Monday rocket launch to $0.74 from around $0.61 as backing that XRP would record pivotal surges in the bull run.

XRP Missed Recent Past Bull Run

Significantly, XRP missed the 2021 bull season, failing to approach its all-time high of $3.84 set in 2018. Many in the crypto community attribute this failure to the SEC lawsuit hindering XRP’s progress. 

However, XRP’s lackluster performance after securing a legal victory has heightened the pessimism about its potential. Nonetheless, prominent market watchers maintain optimism, suggesting that the asset could reach $10 during this bull season.

BlackRock Leads as US Bitcoin Spot ETFs See $1B Record Inflow In One Day  

0

On March 12, the 10 Bitcoin spot ETFs saw a record inflow of $1.04 billion, with BlackRock’s IBIT accounting for $849 million of the total figure. 

Yesterday was another record-breaking day of inflows for the 10 Bitcoin (BTC) spot-based exchange-traded funds (ETFs) in the United States. 

New Daily Inflow Record 

According to data from BitMEX Research, the net inflows to the Bitcoin spot ETFs surpassed $1 billion on March 12. In Particular, the total inflow recorded yesterday was worth $1.04 billion. This marks the largest inflows recorded in a single day since these investment products started trading on January 11. 

The previous daily record inflow was registered on February 28, when the 10 Bitcoin funds attracted $673 million worth of investments. 

BlackRock Sees $849M Inflows in a Single Day

Interestingly, BlackRock’s iShares Bitcoin Trust (IBIT) attracted the largest inflow to the tune of $849 million. As a result, the total assets under management (AUM) within the IBIT fund spiked to $15.42 billion, ranked only behind Grayscale Investments’ Bitcoin Trust ETF (GBTC) ETF, which holds $27.68 billion.

Meanwhile, Ark 21Shares Bitcoin ETF (ARKB) and VanEck Bitcoin Trust (HODL) were behind IBIT. While ARKB saw an inflow of $93 million, HODL’s inflow stood at $82.9 million.  

VanEck’s ETF ranked third after the company announced a 0.20% sponsor fee waiver until March 31, 2025, or once the fund records its first $1.5 billion AUM. The fund currently boasts $515 million in assets under management.

Furthermore, Fidelity’s FBTC was the fourth Bitcoin ETF that saw the most inflow yesterday. The fund attracted $51.6 million, bringing its AUM to approximately $9.2 billion. 

Expectedly, GBTC continued to record outflow. However, the company saw a meager outflow of $79 million on March 12 compared to the previous day’s record of $494 million. 

Bitcoin Sets New ATH 

The surge in ETF inflows comes on the heels of Bitcoin setting new all-time highs (ATH). Since breaking its previous ATH of 2021, Bitcoin has registered new ATHs over the past eight days. The current ATH of $73,637 was registered on March 13. 

These significant surges to new all-time highs have persisted despite the halving being a few weeks away. While BTC’s recent performance has been outstanding, crypto bull Samson Mow asserted that Bitcoin has not yet commenced its price run. 

He noted that faces will be atomized when the asset’s price run takes place. Mow also expects Bitcoin to reach a $1 million price target in the future, emphasizing that the goal was set when the U.S. SEC approved multiple Bitcoin spot ETFs in January. 

Bitcoin Price Surge Could Continue Despite Record Highs, CryptoQuant Analysis Suggests

0

Bitcoin (BTC) has the potential to record more substantial price surges, according to a CryptoQuant analysis, despite recently hitting a new all-time high above $73,000.

A recent report from Axel, a CryptoQuant Research and Data Analyst, indicates that Bicoin could continue its upward trajectory, even after surpassing the $73,000 mark. Notably, BTC surged to a new ATH of $73,650 today after breaching $72,000 two days ago.

The leading crypto asset has faced a mild drop following the $73,650 high, but the CryptoQuant analysis suggests the uptrend is in its infancy. The analysis focuses on a metric known as the UTXO P/L Supply Ratio Momentum and its correlation with Bitcoin’s price movements.

History Repeats Itself

The UTXO P/L Supply Ratio Momentum looks at the average profit or loss that Bitcoin holders are experiencing over a week, and then compares it to the average profit or loss over a year. Essentially, it tracks the ratio of profits and losses realized by Bitcoin holders over time. 

Citing data from the CryptoQuant chart, Axel pointed out that this metric has recorded two notable spikes since 2014. Interestingly, both of the spikes materialized during bull market phases, coming up after Bitcoin had witnessed its bottom price for the cycle.

When this momentum indicator spikes, it indicates that there has been a significant change in how profitable Bitcoin holders are, potentially signaling a shift in investor behavior from short-term profit-taking to long-term holding. During these phases.

Bitcoin Could Rally Further

Data from the chart suggests a correlation between sharp changes in the indicator and significant Bitcoin price movements. The report indicates that such spikes often align with periods of growth, indicating mid-bull rally stage. However, BTC typically faces a mild correction before the upsurge.

Speaking on the analysis, CryptoQuant Chief Ki Young Ju stressed that despite reaching new record highs, Bitcoin’s bullish momentum may still have room to run, potentially leading to further price appreciation in the near future.

According to Ki Young Ju, the on-chain data suggests the imminent arrival of new capital to kickstart another round of price surges. Bernstein analysts hold similar sentiments, emphasizing that they are now “confident” Bitcoin could skyrocket to $150,000 by next year.

Meanwhile, Bitcoin currently trades for $72,794, up 1.18% over the past 24 hours. Trade volume has continued to clinch record highs, as the crypto asset sees increased interest triggered by the spot Bitcoin ETF products. BTC’s 24-hour trade volume currently sits at $62.5 billion.