
Home Blog Page 1645

Top Analyst Says VeChain Is a Top Pick in 2024, Forecasts VET to Rally to $1.14 By October

0

Popular crypto analyst AJ asserts that VeChain (VET) is a top pick in 2024, projecting that the asset’s price could surge to $1.14 by October. 

Several crypto analysts have been highly bullish on VeChain (VET) in recent weeks, as they project that the coin would rank among the top performing cryptos in 2024. 

VET Could Surge to $1.14 By October 2024 

One of the analysts who share this sentiment is prominent expert and trader AJ. In a recent X post, AJ pointed out that VET flashed a crucial bullish signal on December 30, 2023. 

According to AJ, VET recently made a GOLDEN CROSS on the 2-Day chart for the first time since June 19, 2020. AJ noted that following the emergence of a GOLDEN CROSS on the VET 2-Day chart in June 2020, the crypto asset surged by a whopping 3,062% over the next 300 days. 

Interestingly, AJ speculated that if the same pattern repeats itself, VET price could spike to $1.14 by October 25, 2024. 

While AJ’s prediction looks enticing, it is imperative to note that past performance does not often guarantee future returns, given the massive volatility of the crypto market. 

However, market experts consider the appearance of a golden cross on any asset’s charts to be a bullish signal. 

VET’s Crucial Support Level 

In the meantime, VET was down 6.6% over the past 24 hours to $0.029. The crypto asset is down 89.70% from its all-time high of $0.28, which was recorded on April 19, 2021. 

Yesterday, VET lost a crucial support level at $0.03. Reacting, popular crypto analyst Teshkid speculated that the asset could plunge further to around $0.024, which is the next major support. 

However, he projected that if VET breaks through the $0.03 support, it could rally to $0.035. 

Other Favorable VET Predictions 

Meanwhile, several crypto analysts have issued favorable predictions for VET in recent times. As reported earlier, popular YouTuber Ben Armstrong forecasted that VET has the potential to become a top 10 to 20 mover among the 100 crypto assets. 

However, he recommended that VET should not exceed more than 10% of an investor’s portfolio. Last month, renowned market analyst EGRAG speculated that $1.6 is a feasible price for VET.   
XRP Fair Valuation Calculator Puts XRP at $7 on $30B Volume

0

The XRP Athey and Mitchnick calculator, which seeks to calculate XRP’s fair valuation, has put the crypto asset’s price at $7.57 on a $30 billion trading volume in a year’s time.

XRP looks to revolutionize the cross-border payments scene due to its role in Ripple’s ODL (now Ripple Payments) product. As a result of its potential and utility, several industry commentators believe the asset is largely undervalued.

Some of these pundits have pointed to the SEC’s lawsuit, which began in December 2020, as one of the major factors being XRP’s price suppression.

Notably, the asset was unable to leverage the market-wide bull run of 2021 which saw multiple tokens, including Bitcoin (BTC), hit new all-time highs.

Amid the speculation regarding XRP’s value, Susan Athey and Robert Mitchnick, researchers at Stanford University, introduced a framework for valuation of crypto assets based on certain metrics, including their utility and other economic factors.

In 2018, they released a paper presenting a formula that gauges the intrinsic value of XRP, considering factors such as transaction volume, store of value, and supply.

Utilizing this model, Unbanked Freedom, a platform committed to advancing financial inclusion, developed an online calculator.

The calculator allows users to input their own assumptions and parameters and see how they affect the value of XRP. The Crypto Basic recently leveraged the calculator to gain insights into XRP’s projected fair market value based on certain factors.

XRP Metrics Considered

The first metric is the daily XRP transaction volume. This refers to the money flowing through XRP every day. We assumed a $30 billion volume.

This assumption is realistic, seeing that XRP’s largest 24-hour volume is $36.95 billion. The asset achieved this feat in April 2021 while trading above the $1 price threshold.

Secondly, we considered the time between each XRP transaction, which highlights the average days an XRP sits idle before the next use. For this metric, The Crypto Basic assumed a 5-day interval, representing the default value.

We then turned to XRP’s store of value, representing funds held in the asset. For this scenario, we set up a $300 billion valuation. Notably, this figure is only 10 times XRP’s current market cap, putting it in the realm of possibilities. 

The calculator allows participants to insert the duration they believe XRP could reach the assumed metrics, especially the projected transaction volume. In this case, we put up a 1-year period, reflecting an optimistic but plausible projection.

The circulating supply for the 1-year duration was also considered. Notably, XRP currently has a circulating supply of 54.2 billion tokens at the time of reporting, per CoinMarketCap data. 

XRP Fair Valuation Calculator

Considering Ripple retains 200 million tokens out of the 1 billion released monthly, the supply will increase by 2.4 billion tokens in 12 months. This translates to a circulating supply of 56.6 billion tokens in the next one year. 

We also analyzed the discount interest rate for XRP. This metric calculates the annual discount interest rate used to calculate present XRP value. We assumed a 5% rate, the default value, and a sensible measure for risk-free investments.

XRP at $7.57

Based on the provided parameters, the calculator estimates XRP’s value to be $7.57. Notably, XRP currently trades for $0.5641 amid a 1.86% 24-hour drop. For the token to reach $7.57, it would need to appreciate 1,241% from its current value.

Here’s How Much Shiba Inu You Need to Make $1M, $9M, or $20M If SHIB Hits $0.001

0

With investors projecting that Shiba Inu could rally to $0.001 in the bull run, we have detailed how much you need to invest now in order to rake in millions if the price materializes. 

Earlier this week, many Shiba Inu investors went underwater after SHIB plunged below the $0.00001 territory. Recall that the Matrixport research report, which claims that the U.S. SEC would deny all spot Bitcoin ETF applications, wreaked havoc on the prices of crypto assets, including Shiba Inu. 

While several investors are disappointed with the latest downturn, others see the development as an opportunity to increase their SHIB holdings, as they hope to become millionaires when the token rallies to around $0.001 in this bull market. 

Notably, the major question remains how much people need to invest now in order to rake in millions when SHIB hits the projected price of $0.001. 

Amount Needed to Make $1M, $9M, or $20M 

For an investor to rake in a million-dollar profit when Shiba Inu hits $0.001, they would need to scoop 1 billion units of SHIB. With a unit of SHIB trading at $0.00000953, purchasing 1 billion tokens would require a capital of $9,530. 

Similarly, if Shiba Inu surges to $0.001, an investor would need to hold 9 billion tokens to rake in a profit of $9 million. Acquiring 9 billion SHIB at the current price of $0.00000953 would require an investment of $85,770. 

Additionally, if Shiba Inu eventually hits the coveted price of $0.001, 20 billion Shiba Inu tokens would be valued at $20 million. Purchasing 20B SHIB tokens at the current price requires an investment of $190,600. 

SHIB to $0.001? 

While some investors believe Shiba Inu could surpass its previous ATH and hit the $0.001 mark, there is no guarantee that the canine-themed token would ever achieve this feat. 

Consequently, it is imperative to know that this article is for informational purposes and not an investment guide. 

Meanwhile, the $0.001 price level is way above Shiba Inu’s all-time high (ATH) of $0.00008616, which was recorded on October 28, 2021. 

In the hours leading up to press time, Shiba Inu was changing hands at $0.00000953, down 88.7% from its ATH. At the current price, Shiba Inu will need to rally 10,493% to reach the $0.001 mark. 

Here Are 2024 Trends to Monitor for Ripple IPO

0

Pre-IPO investment platform Linqto has highlighted trends to watch in 2024 for companies like Ripple looking to embark on an initial public offering (IPO) journey. 

As the curtains rise on the 2024 IPO market, Linqto, a platform facilitating pre-IPO investments, has shared insights into the economic trends shaping the investment landscape. 

In a recent post on X, Linqto highlighted that the IPO scene for the previous year had been largely quiet. However, it noted investors are gearing up for potential opportunities this year. To this end, it outlined key promising trends to monitor for the projected 2024 IPO market boom.

Encouraging Economic Indicators

According to Linqto, the economic outlook for 2024 appears promising, with positive indicators across various fronts. In particular, it highlighted an upswing in Gross Domestic Product (GDP), indicating an expanding economy. 

Furthermore, the pre-IPO investment platform cited a reduction in unemployment rates. This suggests increased job stability and consumer confidence. Also, Linqto noted an uptick in consumer spending. 

The platform believes these factors support a favorable environment for companies considering initial public offerings.

Easing Market Fluctuations

Furthermore, Linqto noted investors can take comfort in the decreasing levels of market volatility, as indicated by the Volatility Index. It argued that a more stable market creates an optimal climate for companies to contemplate IPOs as it provides a sense of security and confidence for potential investors.

Rising Capital Needs

According to data sourced from Pitchbook, there has been a noteworthy surge in the U.S. VC capital-to-demand ratio, standing at 2.76 times for late-stage startups. 

Linqto believes this trend signifies a growing need for capital among startups, potentially driving an inclination towards IPOs as a strategic avenue for further expansion and development.

Ripple IPO Outlook

It is worth noting that the San Francisco-based crypto payment firm Ripple is among the leading crypto businesses with IPO plans. The Crypto Basic has repeatedly called attention to instances that suggested the company is laying the ground for an IPO. 

As anticipation grows amid the projected 2024 IPO market boom, a financial analyst on Wall Street foresees the possibility of a Ripple IPO unfolding in May 2024 or, alternatively, in 2025.

Yet, other expert voices within the crypto community have cautioned against firm predictions on the timeline for this anticipated event. They cited Ripple’s legal issues with the U.S. regulator as an obstacle. 

Grayscale Adds XRP to its GDLC Fund, is XRP ETF Next?

0

Grayscale has re-added XRP to the Digital Large Cap Fund, one of its largest investment products by AUM, sparking anticipation of a possible XRP ETF product in the near future.

The digital asset investment firm disclosed this in a press release last night. Notably, the announcement detailed a quarterly rebalancing of some of Grayscale’s investment products, including the Grayscale DeFi Fund, the Grayscale Digital Large Cap Fund, and the Grayscale Smart Contract Platform Ex-Ethereum Fund.

The Grayscale Digital Large Cap Fund, which aims to give investors exposure to some of the largest crypto assets by market capitalization, contained Bitcoin (BTC), Ethereum (ETH), Solana (SOL), Polygon (MATIC), Cardano (ADA) and Avalanche (AVAX).

However, the company disclosed in the latest announcement that they had sold off some components to procure more Avalanche tokens and XRP tokens as part of the quarterly rebalancing move. Subsequently, they have re-added XRP to the fund, replacing MATIC.

As a result, XRP now commands 2.54% of the entire market cap of the fund, only below Bitcoin (69.15%), Ethereum (21.90%), and Solana (3.65%).

The GDLC Fund is the third largest investment product from Grayscale, commanding a whopping $378.4 million in assets under management.

Grayscale Previously Removed XRP

Recall that Grayscale already had XRP in the fund before the SEC’s lawsuit against Ripple and its executives.

Nonetheless, after the regulatory agency charged Ripple for allegedly engaging in unregistered securities offerings, XRP witnessed intense selloffs that saw its market cap drop.

In response, Grayscale removed XRP from the fund on Jan. 4, 2021, amid the legal battle. The firm sold off its XRP shares and leveraged the proceeds to procure other assets in the fund.

However, following the pivotal ruling in July 2023 that declared XRP a non-security, calls have intensified for Grayscale to reintroduce the asset.

It bears mentioning that these calls emerged as major U.S.-based exchanges such as Coinbase and Kraken relisted XRP. In its recent announcement, Grayscale affirmed that the ruling helped XRP meet the criteria for inclusion in the GDLC Fund. 

Possible XRP ETF?

The recent development has triggered elation among XRP proponents, with some individuals now looking to welcome a spot XRP ETF.

Notably, while leading asset managers have turned their eyes to Bitcoin and Ethereum for spot ETFs, XRP has been largely ignored despite being the only altcoin with legal clarity in the U.S.

Industry commentators have questioned why asset management firms such as BlackRock have not pushed to launch a spot XRP ETF.

News of a fake BlackRock iShares XRP ETF surfaced last November, leading to a spike in XRP price. However, the token dropped in value when the product was found to be fake.

Grayscale had previously sponsored a crypto watch display on CNBC involving the prices of BTC and ETH along with XRP. This further raised speculation of a looming XRP ETF. 

Recall that Grayscale also liquidated its XRP Trust in January 2021 on the back of the SEC’s lawsuit. Now that the investment firm has reintroduced the crypto asset to the GDLC Fund, market watchers anticipate the introduction of an XRP ETF. However, the firm has not hinted at such a product as of press time.

Shiba Inu Price Outlook: Key Support and Resistance Levels 

0

With Shiba Inu plummeting below the $0.00001 price mark this week, here are key support and resistance levels that could determine SHIB’s movement in the coming days. 

Shiba Inu (SHIB) has experienced massive price swings in recent times. This week, the canine-themed cryptocurrency plunged below the $0.00001 price level. 

Recall that Shiba Inu was trading around $0.00001090 at the beginning of the year. However, the token experienced a major downturn on January 3, following reports that the SEC would deny all applications for spot Bitcoin exchange-traded funds (ETF). 

The FUD (Fear, Uncertainty, & Doubt) pushed SHIB to around $0.00000930, with several investors registering heavy losses. At press time, SHIB was changing hands at $0.00000970, down 1.4% over the past 24 hours. 

Shiba Inu Key Support and Resistance Levels  

Following the massive volatility that rocked the crypto market, the price of Shiba Inu broke through the 50 EMA. Market analysts consider this type of move to be a bearish trend. 

Looking at Shiba Inu’s price chart, it is evident that the canine-themed token could soon hit an important support level. Interestingly, Shiba Inu might initiate a rebound if it sees substantial support and the appropriate trading volume. 

Notably, Shiba Inu’s current support level sits around the $0.00000950 mark. Staying above this level could pave the way for a potential recovery move. 

On the contrary, if SHIB plunges below the $0.00000950 level, it could result in more sell-offs, thus causing the price to decline further. 

At the moment, Shiba Inu’s resistance levels currently sit near $0.00001000. If this level is breached upward, the canine-themed token could usher in an optimistic trend reversal. 

Potential for a Major Recovery  

In the meantime, Shiba Inu’s on-chain activities suggest that positive developments are happening behind the scenes. Cryptocurrency whales are taking advantage of Shiba Inu’s low price to accumulate the asset. 

Although Shiba Inu has experienced massive corrections this week, SHIB is currently staying above key technical support levels. Hence, there is a potential for an imminent recovery that could take the asset above $0.00001 and beyond. 

A crucial factor that can make this a reality is Shibarium-powered burns. As reported earlier, the Shibarium team hopes to automate burns on Shibarium starting this month, with many speculating that the portal could burn up to 9.25T SHIB monthly. 

Furthermore, altcoins like Shiba Inu could benefit from the potential approval of multiple spot Bitcoin ETF applications. 

Here Is Something Massive for XRP According to Wall Street Financial Analyst

0

Wall Street Financial expert Linda Jones has stressed the immense potential for XRP, consenting that an insane wealth of value could hit the asset soon.

In a statement, Linda Jones, a financial analyst on Wall Street, emphasized the immense potential for XRP, stating that adopters are merely in the initial stages of a game-changing development. 

According to Jones, the digitization of commerce presents a far greater opportunity than the digitization of communications did in its early days.

Jones’s recent remarks come in response to a comment from an XRP enthusiast regarding her perspective on the investment opportunities associated with Ripple and XRP following an interview. 

Something Massive for XRP

In the interview, Jones highlighted the importance of identifying future leaders when considering investments. According to her, XRP stands out because it focuses on cross-border payments, a major utility recognized by Ripple’s CTO, David Schwartz. 

Furthermore, she emphasized Ripple’s pivotal role in assisting governments with creating central bank digital currencies (CBDC), underscoring the unparalleled magnitude of such association. In her words:

“When you’re investing money at the government level, it doesn’t get any bigger than that. It’s trillions and trillions of dollars. That is the most exciting and largest investment opportunity you can usually think of.”

Moreover, Jones stressed the disruptive nature of XRP Ledger’s advanced technology in the banking and financial services sectors. She noted it helps businesses save time and money. As a result, she characterized XRP as a technology capable of disrupting traditional financial services systems.

Also, she highlighted the timing of the investment cycle. According to her, 2024 is crucial for blockchain, cryptocurrencies, fintech, and artificial intelligence, aligning with the impending vertical shift in the innovation S-curve. 

Ultimately, Jones affirmed that Ripple and XRP excel in all key aspects, making them a compelling investment choice.

In reaction, an XRP enthusiast remarked, “This is massive. The amount of wealth that is about to come to the XRP Ledger will be insane.” The Wall Street financial analyst sided with the sentiment.

XRP Records Largest Drop in 5 Months, But a Potential Rise Looms: Details

0

XRP recently witnessed its biggest price drop in five months, but the token’s technicals currently point to a potential price reversal and an imminent rise.

The crypto market recorded one of its most substantial crashes in a long while on Jan. 3. Several assets, including Bitcoin (BTC) and Ethereum (ETH) witnessed massive losses. XRP did not escape the onslaught, dropping 20% from $0.6354 to $0.5040 in less than four hours.

This slump marked XRP’s largest price decrease since Aug. 17, 2023 when it collapsed to a low of $0.4309. Despite staging a recovery from the latest drop, XRP ended Jan. 3 with a 6.69% loss amid sustained bearish pressure in the broader market.

XRP Faces Bearish Pressure

The recent price collapse resulted in XRP dropping below the 50-day exponential moving average (EMA) currently at $0.6139.

This development signals bearish momentum for the crypto token in the short term. Jan. 3 saw massive selloffs, marked by liquidation of shorts and a surge in 24-hour trade volume to $3.4 billion.

While short-term momentum remained largely bearish, XRP’s long-term outlook is currently indecisive, as the crypto asset now trades around the 200-day EMA at $0.571. The bulls would need to push the token well above this level to retain the long-term bullishness.

Amid the downward spiral, XRP has defended the $0.569 support threshold, attempting to seal its position above the $0.57 territory. Market participants have begun re-entering the scene, with growing demand, as investors look out for a potential recovery. 

Trade volume, which collapsed 57% yesterday amid a lack of investor interest, has now witnessed an uptick, rising to $1,507,502,496 as of press time. Nonetheless, open interest (OI) remains 5% down within the derivatives market, as traders continue to lick the wounds of the recent mass liquidation.

XRP Open Interest
XRP Open Interest | Coinglass

Technicals Suggest a Reversal

Despite this, optimism is slowly returning to the market, as technicals indicate a potential price rise. Notably, the Commodity Channel Index (CCI), a momentum oscillator for identifying overbought and oversold conditions, recently dropped to -218.

XRP 1D CCI
XRP 1D CCI

A CCI value of -218 indicates a significant oversold condition for XRP, possibly suggesting that the recent decline might have been too rapid and the asset could be due for a rebound. 

Interestingly, XRP’s Relative Strength Index (RSI) has also slumped to 34.71 as of press time. This metric, combined with the CCI of -218, strengthens the indication that the asset has slipped into oversold territories and might be due for a potential reversal or a bounce-back.

XRP 1D RSI
XRP 1D RSI

XRP is down 3.86% today, having relinquished the gains of yesterday. The crypto asset’s first resistance level at this stage currently sits at $0.5786, at the Fib. 0.382 point.

XRP Fibonacci Retracement

This marks the last resistance point below $0.60, as the next roadblock currently resides at the pivotal Fib. 0.5 level ($0.6013).

Ethereum (ETH) Whales on Accumulation Spree, Bullish Price Move?

0

An Ethereum (ETH) whale has started accumulating a large quantity of the coins, signaling a potential bullish outlook for the coin in the mid-term.

Just like Bitcoin (BTC), Ethereum is currently in a recovery mode following the meltdown the market recorded earlier this week. The selloff Ethereum experienced pushed its price to a low of $2,181 before bouncing back to $2,236.77 which it currently trades at.

Ethereum’s recovery was signaled by the reduced selloff with the rate of growth in price and market capitalization staying at 0% in the past 24 hours. 

Insight Into the Whale Ethereum Accumulation

According to data from the crypto analytics platform Spot On Chain, the whale with the address ‘0x931’ spent $48 million to buy a total of 21,192 ETH at an average price of $2,265 a couple of hours before writing. This brings the valuation of the stash to $47,999,880.

The whale has no special preference for centralized exchanges as the accumulation thus far has been conducted through Binance and Decentralized Exchanges.

Per the data shared, since January 13, 2023, the whale has purchased a total of 79,500 ETH at an average price of $1,790 with a total of $36.84 million.

One interesting pattern in this whale’s accumulation strategy is that they buy ETH by targeting specific retracement points to maximize subsequent uptrends. This has proven to be effective considering the win rate.

The whale’s purchases have come from different sources including revolving loans from Aave lending protocol and Liquidity.

Per Spot On Chain’s observations, the Ethereum whale appears to be long on Ethereum and the accumulation thus far has yielded a total of 25.9% in unrealized profit.

Ethereum Retracement Underway?

The accumulation of Ethereum by this whale mimics related bullish moves of Michael Saylor, the Chairman of MicroStrategy, the firm that recently acquired $615 million worth of Bitcoin.

However, the committed capital is potentially not large enough to cause a significant shift that can trigger Ethereum’s long-sought bullish retracement.

Discounting this accumulation, the hype surrounding Bitcoin spot ETF has the potential to trigger a rally in the price of Ethereum as the bullish sentiment that might accompany a likely approval might send prices of all assets correlated with BTC to new heights.

Top Analyst Uses 7 Charts to Predict Bitcoin Surge to $532,000

0

Renowned YouTuber and crypto analyst PlanB shared insights into his Bitcoin price prediction, utilizing seven key charts to support his forecast. 

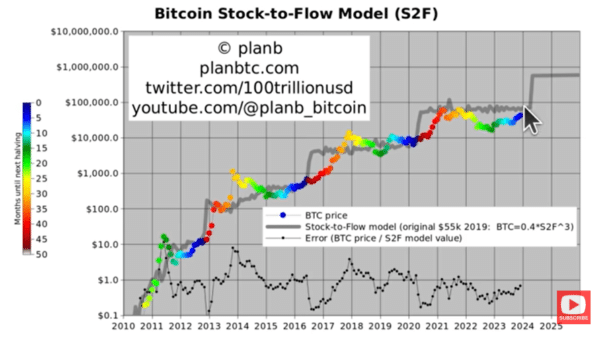
The first chart discussed was the Stock-to-Flow (S2F) model, a known indicator for price projections. The analyst cited three key insights deducible from the S2F model about Bitcoin’s future price. 

S2F Suggests a $532k Model Value

First, PlanB highlighted that the model value after the Bitcoin halving, per the S2F model, is $532,000. Elaborating on the target, the analyst pointed out that Bitcoin’s price has historically aligned with the model value following 2012, 2016, and 2020 halving. 

According to him, it is particularly true when the market dynamics transition from the accumulation phase to the bull market phase. A similar trend is observed to be gradually playing out for 2024.

PlanB Bitcoin prediction chart

According to PlanB, the current model value is between $50,000 and $60,000. He anticipates a gradual increase in Bitcoin’s price leading to the April 2024 halving to mirror the model value.

Bitcoin Market Cycle Model

The second chart PlanB discussed was the Bitcoin Market Cycle Model (MCM). He described it as a detection model indicating the different phases in Bitcoin’s market cycle.

The MCM suggested Bitcoin is currently in the accumulation phase, with a transition to the bull market phase the next in line.

According to the analyst, earlier bull markets experienced 100x returns, though the rate of return has diminished in recent cycles.

Despite this, PlanB expressed confidence in a substantial tenfold return in Bitcoin, citing the relatively low adoption rate of 2-3%. Moreover, he cited Metcalfe’s law that diminishing returns are not expected until Bitcoin surpasses 50% adoption.

Bitcoin RSI 

PlanB’s third discussed chart was a technical analysis chart, the Relative Strength Index (RSI). This tool reveals momentum, indicating overbought and oversold situations, symbolizing greed and fear in the market.

It essentially acts as a gauge for bull and bear markets, representing the two extremes of emotion in trading.

PlanB draws two significant insights from this chart. Firstly, he anticipates an uptrend in the next four months leading to the halving.

Secondly, after the halving, the chart indicates the possibility of encountering high RSI values, suggesting a steep uptrend. However, the chart provided no specifics on how high this uptrend might go.

Other Charts

Other charts the analyst highlighted include Bitcoin’s 200-week moving average (200WMA), Bitcoin realized price, Bitcoin holders in profit, and Bitcoin stock-to-flow trading rule. 

In essence, each of these charts collectively indicated a positive momentum, both leading up to and following the April 2024 halving.