Home Blog Page 18

XRP Must Defend This Price Level to Keep the Bullish Vision Alive

0

Amid the ongoing pullback following the August rally, XRP must defend its current price level to maintain its bullish trend.

XRP has reached an important point as it tries to hold on to its recent recovery. Currently, XRP trades at $1.39, with a market capitalization of $86.94 billion. The token has also fallen 1.79% over the past 24 hours. This decline follows XRP’s 28.5% gain in August, its strongest August performance in five years.

However, XRP has struggled to keep that momentum going. The token briefly moved above $1.42 during its recovery before falling back toward $1.396. With the price now sitting close to a key support area, the next few trading sessions could determine whether buyers can keep the recovery on track or sellers push the price lower.

XRP Faces Test Around $1.39

The broader crypto market has also made the situation more difficult for XRP. Total crypto market capitalization has dropped 3.12% to about $2.69 trillion, while Bitcoin dominance has climbed to 59.12%. When Bitcoin takes up a larger share of the market, altcoins such as XRP often struggle to attract the same level of buying interest.

At the same time, the Fear & Greed Index stands at 71, which keeps overall sentiment in the Greed category despite crypto prices pulling back. 

XRP has entered a period of consolidation below several moving averages after traders took profits near resistance. Still, the token remains slightly above its 200-day simple moving average (SMA 200) at $1.3927.
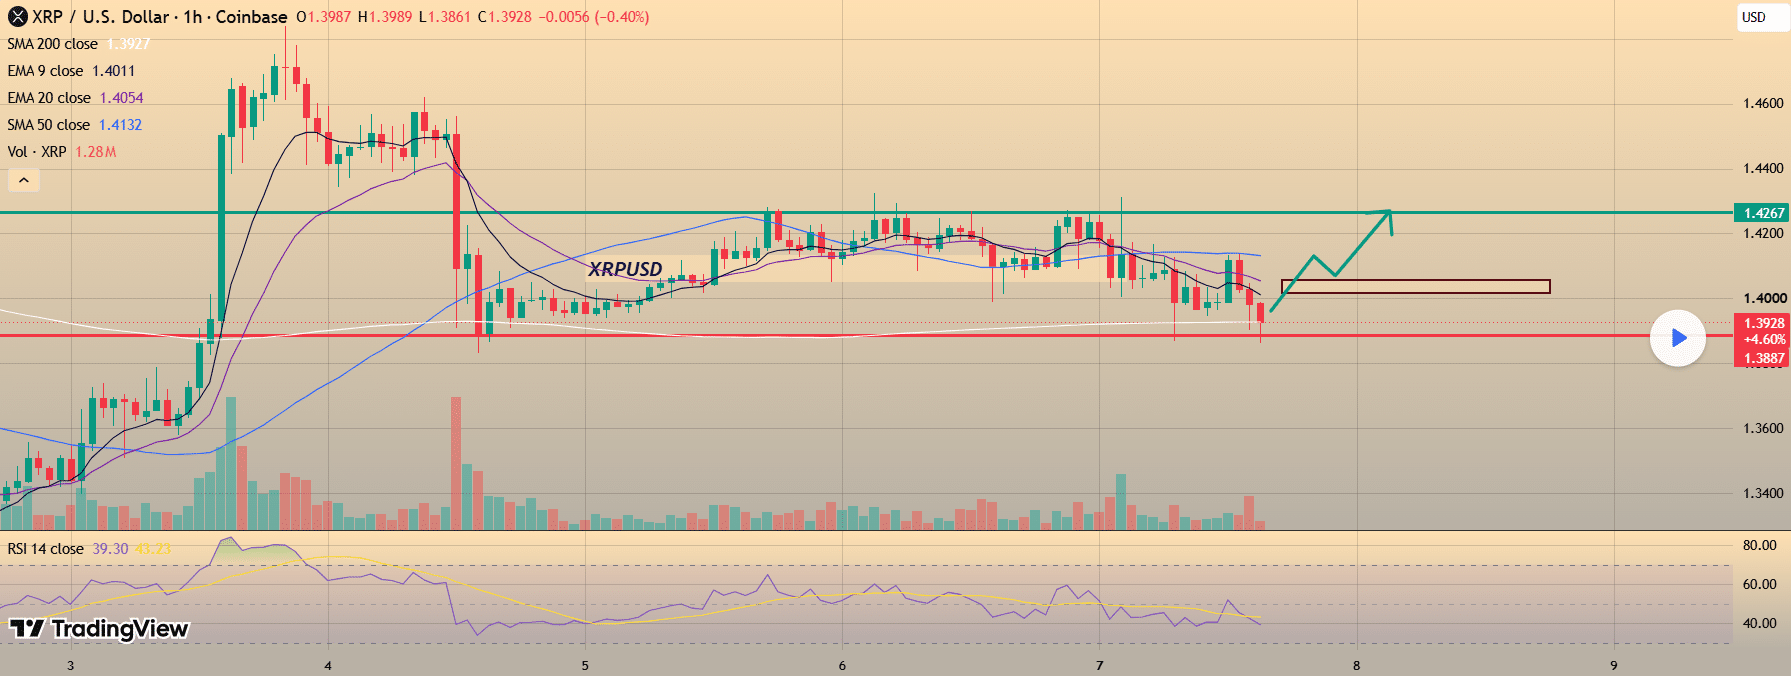
XRP 1h Chart
XRP 1h Chart

This makes the $1.39 area especially important. XRP currently has immediate support at $1.3887. A confirmed break below this level could weaken the current price structure and open the way toward the $1.36-$1.35 area, which several analysts consider the next major demand zone.

The momentum indicators also show that buyers have lost some strength. The XRP RSI sits around 41, showing weaker momentum but remaining above oversold levels. The daily MACD histogram reads -0.01, which also indicates a slowdown in bullish momentum.

XRP Needs to Reclaim $1.40

XRP’s range from the previous trading session shows that the token reached $1.41 at its highest point and fell to $1.38 at its lowest. This places the $1.38-$1.42 range at the center of the current price action.

For XRP to regain stronger upward momentum, buyers need to push the token back above the $1.4018-$1.4057 range and hold that area. A successful move above this zone could put $1.4132 next, followed by $1.4267.

Until XRP moves back above the $1.4057-$1.4132 range, the recent rebounds could remain short-term recoveries rather than signs of a renewed uptrend. As a result, buyers have two clear tasks: defend $1.3887 and reclaim the $1.4018-$1.4057 area.

If XRP loses $1.3887, however, selling pressure could increase quickly. In that case, traders could turn their attention to $1.36-$1.35, where the next major support area sits.

XRP ETFs Continue to Attract Capital

While the short-term chart looks uncertain, XRP continues to receive support from the institutional side. Spot XRP ETFs recorded $18.96 million in net inflows during the week ending Sept. 4, extending their positive streak to eight consecutive weeks.

The latest inflows came after an even stronger week. Specifically, during the week ending Aug. 28, XRP ETFs recorded $110.49 million in net inflows, marking their largest weekly intake of 2026. Cumulative net inflows have now reached about $1.68 billion.
Chainlink Nears 100% Rally as LINK Gains Renew XRP Overtake Speculation

0

Chainlink nears a 100% rally as LINK gains 80% since June amid renewed speculation that it could eventually flip XRP. 

Chainlink has posted two consecutive months of strong gains, nearly doubling from around $7 as buying momentum continues to build. This sustained advance has strengthened Chainlink’s market position and renewed speculation that LINK could eventually challenge XRP for market-cap dominance.

Chainlink Gains 80% Since June Low

On June 26, LINK traded at a low of $7.02 as the broader crypto market remained under pressure. However, it quickly rebounded as market sentiment improved and eventually reached an eight-month high of $13.68 yesterday.

Although LINK has since retraced to around $12.67, it has retained most of its gains and remains 80.48% above its June 26 low.

XRP, meanwhile, has posted a more modest recovery over the same period. The token traded at $1.00 on June 26 before climbing to a multi-month high of $1.68 on August 22, representing a 68% increase. XRP has since pulled back to around $1.39, leaving it 39% above its June low.

LINK Still Faces a Huge Gap With XRP

Despite LINK’s stronger performance, Chainlink still has a substantial market-cap gap to close before it can overtake XRP.

LINK currently ranks as the 13th-largest cryptocurrency, with a market cap of $9.45 billion. XRP, by comparison, ranks fifth with a valuation of around $86.91 billion.

Therefore, LINK would need to increase its market cap by roughly 820% to reach $87 billion and challenge XRP. Assuming its circulating supply remains unchanged at 748.1 million tokens, such a valuation would put LINK at about $116 per token.

For now, XRP maintains a commanding lead. Nevertheless, LINK’s rapid appreciation shows how quickly the gap between major cryptocurrencies can narrow during a strong market cycle.

XRP Eyes $1.46 Breakout

Meanwhile, analyst Ali Martinez sees a potential breakout forming for XRP while warning that Chainlink’s recent rally could be losing momentum.

Martinez said XRP appears to be forming a descending triangle on the hourly chart. He is watching for an hourly close above $1.40, which could confirm a breakout and potentially push XRP toward $1.46. 

Martinez Highlights Three Warning Signals for Chainlink 

At the same time, Martinez identified three signals suggesting that LINK could enter a cooldown following its sharp 95% rally from around $7 to $13.

First, the TD Sequential indicator flashed a weekly sell signal, pointing to a rising risk of profit-taking. Second, whale activity has declined sharply. Transactions worth more than $1 million fell from roughly 59 over the past two weeks to about 10, indicating weaker large-holder activity.

Finally, 1.75 million LINK have moved onto exchanges. As a result, exchange balances increased from 269.25 million to roughly 271 million LINK, potentially signaling greater selling pressure. 

XRP Rich List Shrinks Again: Just 2,120 XRP Now Puts Wallets in Top 10%

0

The amount of XRP an investor needs to rank among the top holders has fallen again.

Roughly 2,120 XRP is now enough to place a wallet in the top 10% of XRP Ledger accounts. At XRP’s current price of around $1.40, 2,120 XRP is worth approximately $2,968.

The latest figures show how XRP wallet distribution has changed as the XRP Ledger continues to add accounts. Notably, the total number of wallets on XRPL is 8,121,349.

2,120 XRP Reaches the Top 10%

According to the latest XRP rich-list data, the thresholds increase as investors move toward the upper tiers.

XRP Holdings Approximate Ranking
2,119 XRP Top 10%
7,433 XRP Top 5%
10,019 XRP Top 4%
44,490 XRP Top 1%

Current independent rich-list data puts the top-10% threshold at 2,119.55 XRP and the top-1% threshold at about 44,490 XRP as of September 8. That means a wallet holding 10,000 XRP, worth roughly $14,000 at $1.40, would already sit considerably higher than the top 10% threshold.

XRP Wealth Distribution Is Changing

The shift coincides with the rapid expansion of the XRP Ledger’s account base. The network now has more than 8.12 million wallets, according to current rich-list data.

However, the number of accounts should not be interpreted as the number of individual XRP holders. One person can control multiple wallets, while exchanges and other custodians can hold XRP on behalf of many users.

There is also a major concentration effect at the top. Current data indicates that accounts below 1,000 XRP represent about 85% of the total, yet collectively hold only a small fraction of the XRP in those accounts.

For instance, 4,13 million accounts hold 0-20 XRP with a collective balance of 24.168 million tokens. Also, 2.55 million wallets hold 20-500 XRP with a collective balance of 220.8 million coins.

Could 2,120 XRP Become a Significant Position?

A 2,120-XRP wallet may not look particularly large today. At $1.40 per XRP, it represents less than $3,000. But its ranking within the XRP Ledger appears significant.

If the value of XRP someday reaches $10, the same portfolio will rise to $21,200 or $212,000 at $100 per coin.

That does not mean 2,120 XRP is guaranteed to become a valuable portfolio in the future. XRP’s future price remains uncertain, and wallet rankings can change as holders accumulate or sell.

Visa Stablecoin Settlement Run Rate Crosses $20B as Card Payment Volume Jumps Nearly 200%

0

Visa’s stablecoin-linked payments business is scaling rapidly, with the company now processing settlement activity at a pace equivalent to more than $20 billion annually.

The annualized settlement rate has increased more than 15-fold year over year, reflecting the broader expansion of stablecoin-powered card products across Visa’s network. During the company’s fiscal second quarter, Visa had more than 160 such programs live worldwide, with payment volume nearly tripling from the prior year.

Stablecoin Card Growth Creates a Financing Challenge

The rapid expansion of these programs has also created a working-capital challenge for some issuers.

Card providers generally need capital available to meet daily settlement payments, even though customer payments may not arrive until later. According to Visa, this timing mismatch can become particularly difficult for younger programs that require relatively small amounts of financing but need to access those funds frequently.

Conventional warehouse financing can be inefficient for businesses operating at that scale. As a result, Visa said access to appropriately structured working capital — rather than customer demand or payment-network capacity — can become the limiting factor for some emerging card programs.

Credit Coop Uses Settlement Receivables to Support Lending

Credit Coop and Visa have developed a financing model that seeks to address that gap through revolving credit denominated in stablecoins.

Settlement receivables back the borrowing arrangement. Visa’s daily settlement data helps determine funding needs, while Credit Coop’s Spigot system automates repayments.

As more lenders have grown willing to finance these arrangements, programs using them are securing funding on better terms. Visa said financing expenses have dropped by up to 30%.

Rain provides one example of how the structure has been deployed at scale. The Visa Principal Member began using the facility for its daily network settlement requirements in August 2023 and has financed roughly $2 billion through it to date.

That activity includes roughly 7,000 on-chain repayments across more than 2,000 borrowing transactions, with no recorded defaults.

Credit Coop Financing Volume Exceeds $2.5 Billion

Credit Coop’s cumulative financing volume since 2023 has surpassed $2.5 billion. The platform has processed over 9,000 on-chain repayments and facilitated more than 3,000 borrowing transactions.

Karta has also used Credit Coop financing while building its travel-card business before separately securing $140 million in new funding in June 2026.

The financing combined a $125 million institutional credit facility from Community Investment Management with $15 million in Series A funding, for which Galaxy Ventures served as the lead investor.

Visa also sees an opportunity to integrate settlement information directly into financing decisions. Giving lenders access to settlement data could enable same-day funding, with financing tailored to the net amount a card program owes during each settlement cycle.

Cronos Rolls Back Chain After $120.4M Tectonic Exploit, $9.19M Remains Unrecovered

0

Cronos reversed nearly two hours of blockchain history following the Aug. 30 Tectonic exploit, restoring balances tied to about $111.2 million of the incident’s $120.4 million exposure. 

Another $9.19 million had left the network before validators stopped block production and was therefore outside the scope of the rollback.

The Crypto.com-associated Layer 1 blockchain detailed its response in an incident review published Monday. According to Cronos, the exploit affected nine Tectonic lending markets and resulted in approximately $120.4 million being borrowed. 

Cronos Returns Chain to Pre-Exploit Checkpoint

Instead of continuing from where the network had been paused, validators resumed Cronos from block 90,896,188. Cronos described that height as the finalized checkpoint immediately preceding the exploit.

Restoring that earlier version of the ledger reversed changes associated with roughly $111.2 million in affected assets. However, the rollback was limited to activity recorded within the portion of the chain that was replaced. 

By the time validators suspended the chain at block 90,907,150, assets worth $9.19 million had already been moved beyond Cronos. The outstanding amount represents 7.6% of the total value affected by the exploit. 

Cronos said validators faced a choice between preserving the chain state recorded when block production stopped and recovering assets still exposed to the exploit. Continuing from the later state, according to the incident review, would have preserved the unauthorized borrowing rather than reversing it.

The recovery had consequences beyond the exploit itself. To restore the network to its pre-attack state, validators moved the chain back by 10,961 blocks, effectively reversing nearly two hours of blockchain history. That action also nullified activity processed within the reverted window, including transactions entirely unrelated to the Tectonic incident.

TONIC Price Manipulation Preceded $120.4M in Borrowing

Cronos said the exploit began after new contracts were deployed and TONIC’s market price surged sharply. TONIC is Tectonic’s governance token, and its relatively thin liquidity allowed the price movement to substantially increase the apparent value of the collateral being used in the protocol. 

Around 10 minutes after the manipulation began, the inflated collateral value was used to obtain approximately $120.4 million in loans across the affected markets. 

Roughly 36 minutes into the incident, the unusual on-chain behavior came to Cronos’ attention. Validators subsequently paused the network, stopping new block production while the teams involved coordinated their response.

Block production remained offline for approximately 11 hours before Cronos resumed operation from the earlier finalized checkpoint. 

Exchanges and Infrastructure Providers Reconcile Restored Chain

Bringing the blockchain back online did not immediately resolve the disruption for platforms connected to Cronos. The network said it continues to coordinate with exchanges, cross-chain bridges, and other affected service providers as they reconcile their systems with the restored ledger.

For users, Cronos said no action is currently necessary. Its blockchain explorer is accessible again, while public RPC infrastructure, indexing services, and subgraphs are functioning. 

Cronos’ incident review did not attribute the exploit to a named individual or group. It also left unresolved the ultimate recovery prospects for the $9.19 million that moved beyond the portion of blockchain history validators could reverse.

XRP Golden Cross Nears as Bullish Setup Mirrors Rally From $2.20 to $3.60

0

XRP is showing a bullish signal as its short-term moving average gets closer to its long-term moving average.

The 50-day Simple Moving Average (SMA) is moving toward the 150-day SMA. If the 50-day average crosses above the 150-day average, it would create a golden cross.

Notably, traders see a golden cross as a sign that momentum may be turning bullish. Traders are watching this setup because the last time XRP formed a similar pattern, its price climbed from around $2.20 to above $3.60, a gain of more than 63%.

If the current moving averages eventually cross, traders may look to that previous move as a possible reference for what could happen next.

XRP Golden Cross Is Not Confirmed Yet

It is important to note that XRP has not formed a golden cross yet. As of September 8, XRP was trading around $1.39, up 2.10% over the past week.

The 50-day moving average is about $1.197, while the 150-day moving average is around $1.238. This shows that the two averages are very close.

XRP is now at an important point. If the 50-day average moves above the 150-day average, it could strengthen the bullish outlook and attract traders expecting a recovery.

However, if the 50-day average fails to move above the 150-day average, the golden-cross setup could disappear, and XRP may not see the expected price increase.

BINANCE: XRP/USD Chart
BINANCE: XRP/USD price Chart

Can XRP Repeat the $2.20-to-$3.60 Rally?

XRP’s previous rally is interesting, but it does not mean the same thing will happen again.

For XRP to continue rising, buyers would need to push the price higher while keeping it above the key moving-average levels. A strong price breakout accompanied by higher trading volume would make the bullish signal stronger.

XRP Stuck Between $1.30 and $1.50

Meanwhile, according to analyst ChartNerd, XRP has been trapped in a tight range between $1.30 support and $1.50 resistance for about three weeks. He says this pattern looks similar to a range XRP traded in earlier in 2026, before the price eventually dropped.

XRP hit a low in February, then recovered toward $1.50 and moved sideways for several months. In May, it reached its 20-week moving average but failed to break above it and later fell to a cycle low of around $0.98.

Since then, XRP has recovered, moved back above the 20-week moving average, and climbed toward the 50-week EMA, which is now the main resistance level.

The 50-Week EMA Is the Key Test

The two important levels are the weekly moving averages:

  • 50-week EMA: around $1.53
  • 20-week EMA: around $1.28

This puts XRP between two important levels, with the $1.50 area acting as the main resistance. Breaking back above the 20-week EMA is already a positive sign because XRP previously failed at this level in May before falling toward $0.98.

However, the 50-week EMA remains the bigger challenge. ChartNerd also pointed out that XRP faced the 50-week EMA in January near $2.50 and then dropped sharply. Because of this, how XRP reacts around the current 50-week EMA could be important.

For now, the analyst believes traders should wait for confirmation. A break above $1.50 could signal further upside, while a drop below around $1.20 could signal weakness.

Hunter Biden to Launch LAPTOP Memecoin, Send Tokens to TRUMP Investors

0

Hunter Biden is preparing to enter the memecoin market with LAPTOP, a token scheduled to launch Wednesday that will distribute part of its supply to investors who lost money on President Donald Trump’s Official Trump (TRUMP) cryptocurrency, according to The Wall Street Journal.

Hunter Biden, whose father is former U.S. President Joe Biden, revealed the $LAPTOP ticker on X on Monday. The project will have a total supply of one billion tokens, with 20% allocated to eligible recipients, including TRUMP investors who lost money, people on a mailing list, and Biden’s Substack subscribers, the Journal reported. 

The planned distribution connects the new token directly with one of Trump’s crypto ventures. TRUMP has lost roughly 97% of its value since hitting a record high in January 2025.

Token Burns Tied to Bitcoin, Politics and TRUMP Valuation

LAPTOP’s creators will retain a 30% share of the token supply and could later burn as much as three-tenths of all tokens in circulation if certain future milestones are reached, according to the report.

The triggers include a Bitcoin (BTC) setting a new record high, a Democratic candidate winning the 2028 U.S. presidential election, and LAPTOP achieving a fully diluted valuation greater than TRUMP’s.

Beyond its tokenomics, LAPTOP also draws directly on Biden’s political history. The token takes its name from Biden’s computer, which attracted intense public attention ahead of the 2020 presidential election as his father ran against Trump for the White House. The controversy surrounding the device has remained a recurring topic among conservative commentators. Biden has also filed two lawsuits alleging violations of his privacy rights stemming from the episode.

The project also comes as Biden has become more vocal about cryptocurrency and blockchain since his father left office in early 2025.

In August, Biden accused World Liberty Financial, the crypto venture backed by members of the Trump family, of corruption and described its activities as unprecedented in scope. He compared its conduct with that of the failed crypto exchange FTX and raised concerns about its connections with foreign governments, including the United Arab Emirates (UAE).

His broader position on the technology has been more favorable. In June, Biden said he considered decentralized digital currencies and blockchain to be an inevitable part of the future.

Liquid Recovers 3,400 BTC Worth $270M as Network Prepares to Restart

0

Liquid has regained control of 3,400 BTC after a weekend security incident drained nearly 4,000 BTC from the Bitcoin sidechain’s reserves.

The recovered coins were worth approximately $270 million at the time and make up about 85% of the Bitcoin removed during the incident. The federation wallet had held around 4,200 BTC beforehand, leaving only a fraction of its previous balance after the withdrawal.

The latest recovery does not account for all of the missing Bitcoin. Samson Mow, a former Blockstream executive and CEO of JAN3, said approximately 598 BTC remained with the actors behind the incident.

According to Mow, the large repayment followed progress in securing the affected infrastructure. Blockstream had confirmed that the necessary patch was in place on the relevant bridge nodes, while communication with the actors continued.

The return also restores most of the Bitcoin reserves lost during the episode. That matters because LBTC circulating on Liquid is designed to maintain verifiable one-for-one backing with BTC secured by the federation on Bitcoin’s mainchain.

Liquid, however, had not immediately resumed normal service. Updated software had been rolled out as federation participants coordinated the work needed to bring the sidechain back into operation.

Software Flaw Linked to Withdrawal

Details surrounding the incident point to Elements, rather than the theft of a SideSwap authorization credential, as the source of the problem.

The withdrawal passed through SideSwap’s peg-out service using its Peg-out Authorization Key. SideSwap and Liquid maintained that the credential remained secure. SideSwap said the L-BTC involved in the transaction instead stemmed from a vulnerability affecting Elements, the blockchain software on which Liquid is built.

Meanwhile, Blockstream opened a line of communication with the actors by exchanging cryptographically authenticated messages over Bitcoin. The group presented its actions as a security intervention rather than a theft.

Its proposal conditioned the release of most of the BTC on fixing the software flaw across the network. The actors wanted the vulnerability addressed and the relevant node software updated before releasing most of the coins.

Technical work continued even after the repayment. Mow said federation participants were implementing additional security measures and addressing a chain split as part of efforts to resume Liquid operations.

Users were also urged to wait before making new BTC peg-ins. Mow said Bitcoin should not be sent through that route until Liquid’s return to service had been officially confirmed, while indicating that no other action was required from users.

Remaining Bitcoin Puts White-Hat Label Under Scrutiny

The roughly 600 BTC that was not part of the main repayment has complicated the actors’ characterization of themselves as white hats.

Ledger CTO Charles Guillemet challenged that description, focusing on whether the retained coins might amount to compensation arranged during private blockchain-based communications.

In Guillemet’s view, retaining such a large amount as compensation under those circumstances would blur the line between a legitimate white-hat disclosure and coercion.

However, neither Liquid nor Blockstream has publicly confirmed that the remaining BTC was approved as compensation. Neither organization has announced repayment conditions or an agreed bounty covering those coins.

Could Shiba Inu Surge 156% to Reach $0.000014 Target

0

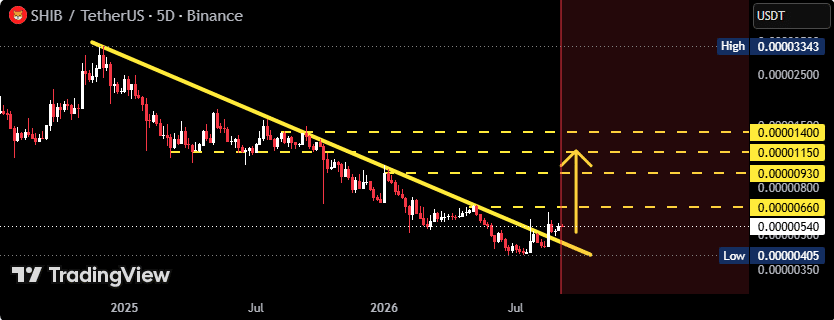
Shiba Inu may be approaching a significant technical turning point after breaking above a long-term descending trendline that has pressured SHIB since 2024.

According to crypto analyst CryptoNuclear, Shiba Inu traded beneath the descending trendline after reaching a multi-month high of $0.00003343 in December 2024. Since then, SHIB has formed a series of lower highs and lower lows, reinforcing its broader bearish structure.

However, recent price action has changed that setup. CryptoNuclear noted that SHIB has now broken above the descending trendline on the 5-day chart, marking an important technical development.

The analyst said a sustained breakout could signal a transition from the long-term bearish trend into an accumulation and recovery phase. However, SHIB must hold above the broken trendline to confirm the reversal.

SHIB Path to $0.000014 

If the breakout holds, CryptoNuclear identified $0.00000660 as the first major resistance level. A decisive break above that level could strengthen the bullish structure and open the way toward $0.00000930 and $0.00001150.

Meanwhile, the analyst’s highest marked target stands at $0.000014. From SHIB’s price of around $0.00000546, reaching that level would require a 156% upsurge.

Notably, Shiba Inu last traded above $0.00001 in early January 2026, making a return to that level an important milestone for the token. 

Shiba Inu Bulls Target Surge to $0.000014

What Could Confirm the Breakout? 

Despite the bullish breakout, CryptoNuclear highlighted a potential retest of the broken descending trendline as one of the most important developments to watch.

The classic bullish sequence would involve a breakout, followed by a retest, a successful hold, and then continuation. If SHIB pulls back toward the former trendline and buyers defend the area, the old resistance could turn into new dynamic support.

Such a reaction would provide stronger confirmation that Shiba Inu has genuinely shifted from its long-term bearish structure, according to CryptoNuclear.

Conversely, an immediate rejection back below the trendline could undermine the bullish setup. CryptoNuclear identified $0.00000500–$0.00000520 as immediate support, while $0.00000405 remains the critical structural level. A decisive break below $0.00000405 could invalidate the reversal thesis and revive the broader bearish trend.

CoinJar Sees Potential Accumulation Phase

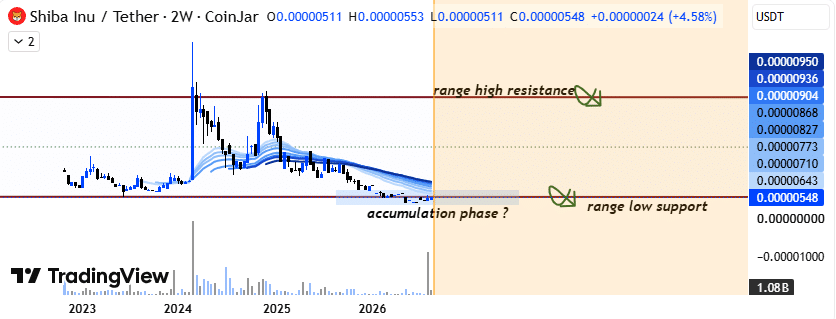
The technical outlook also aligns with a recent analysis from CoinJar exchange. Over the weekend, CoinJar analysts noted that Shiba Inu was trading near the lower boundary of a long-term range, with the prolonged consolidation potentially signaling an accumulation phase.

However, CoinJar stressed that stronger buying volume and price confirmation are still needed before traders can establish a sustained breakout.

If SHIB reclaims and holds the range-low support at $0.00000548, increased buying participation could propel the token toward the range’s upper boundary and resistance near $0.00000904. Conversely, failure to regain that support could keep SHIB in consolidation and expose it to further weakness

CoinJar Says SHIB Is In Accumulation Phase

Current SHIB Price Action and Burn Activity

At press time, Shiba Inu was trading near the key support at $0.000005423, down 1.96% over the past 24 hours as the broader cryptocurrency market weakened.

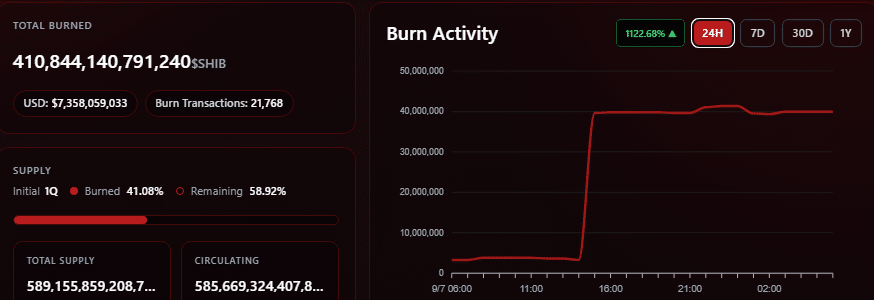
Meanwhile, SHIB’s burn activity has provided a notable boost to its deflationary efforts. More than 39 million tokens were permanently removed from circulation over the past 24 hours, with 40.09 million SHIB burned across 12 transactions.

As a result, the daily burn rate surged by 1,122%. The largest transaction accounted for 36.33 million SHIB. Despite the increased burn activity, Shiba Inu still has a massive circulating supply of approximately 589.15 trillion tokens, meaning sustained demand and stronger market participation remain crucial to any long-term recovery.

Shiba Inu Burn Rate Spikes

XRP May Be Facing a Whale Transfer Risk as 3M Tokens Flow into Binance

0

XRP may be facing some whale transfer risk as large holders move more tokens to Binance without making similar transfers out. 

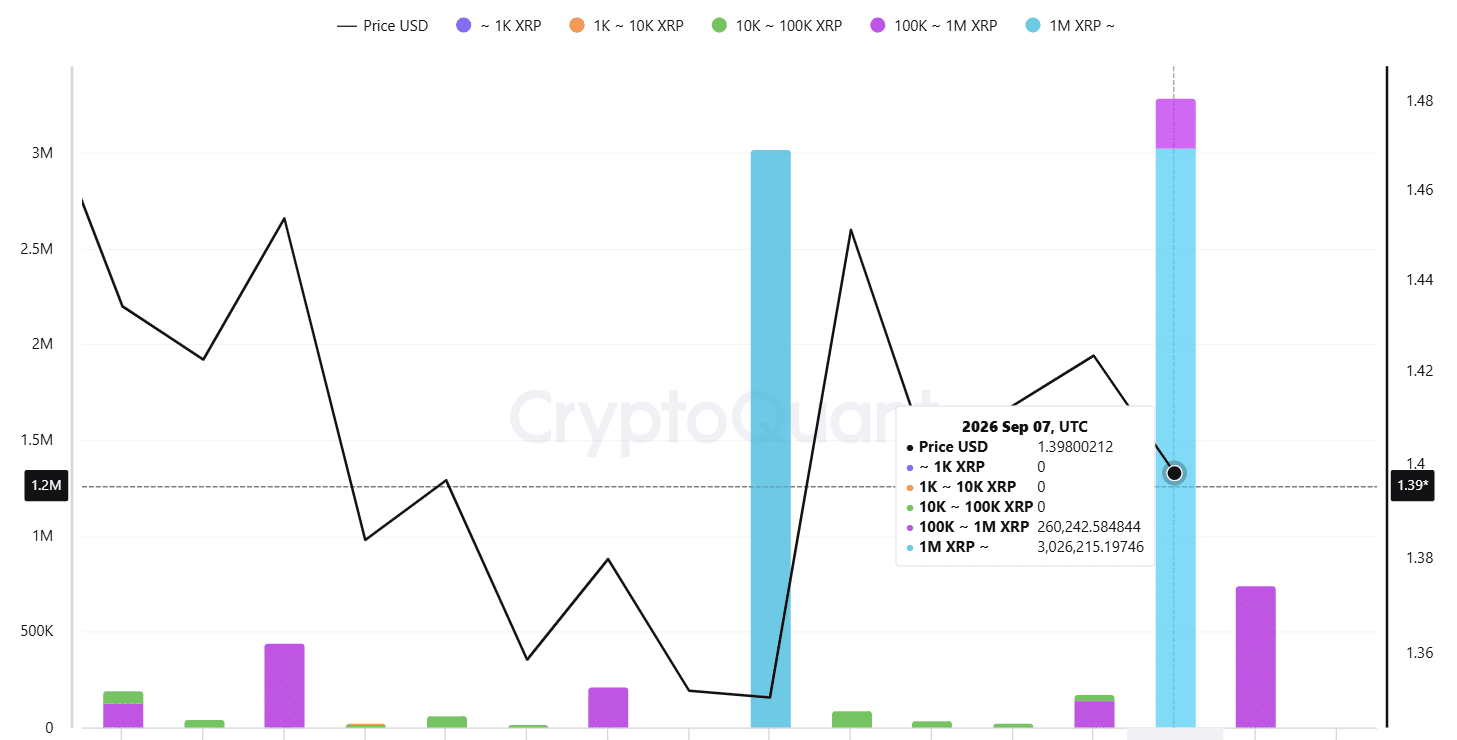
The latest data shows that whales moved more than 3 million XRP to Binance on Sept. 7, while no XRP left the exchange from the same large-holder group.

XRP Whale Inflows to Binance Spike

Specifically, the chart tracking transfers between 100,000 and 1 million XRP shows about 260,000 XRP flowing into Binance on Sept. 7, while outflows stood at zero. 

At the same time, transactions involving at least 1 million XRP moved about 3 million XRP to Binance. This group also recorded no outflows from the exchange. 

XRP Inflows to Binance

By itself, this could suggest that more XRP is moving to Binance for possible short-term selling, which could add some pressure to the price.

However, the broader picture looks less concerning. Notably, XRP inflows and outflows have stayed fairly quiet since July compared with the larger spikes seen earlier. This suggests that whales are not currently showing strong signs of either accumulation or distribution.

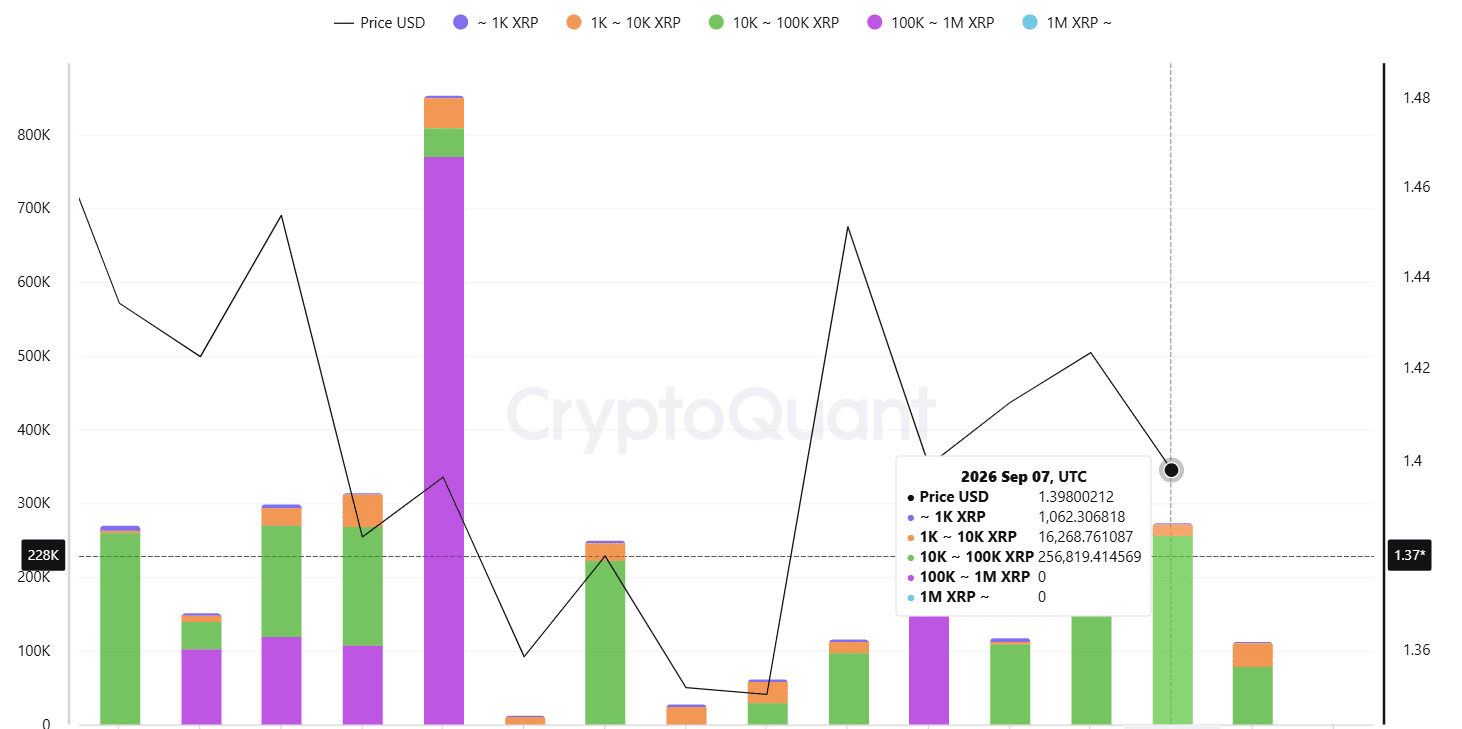
Interestingly, retail investors have been moving more XRP out of Binance as larger holders send tokens to the exchange. On Sept. 7, transactions involving between 1,000 and 10,000 XRP moved 16,268 XRP out of Binance.

Transactions involving between 10,000 and 100,000 XRP also recorded notable outflows, with 256,819 XRP leaving Binance on the same day. This activity helps balance the whale transfers, as smaller investors are withdrawing XRP while larger holders are sending tokens to the exchange.

XRP Outflows from Binance

XRP Technicals Give Bulls a Small Edge

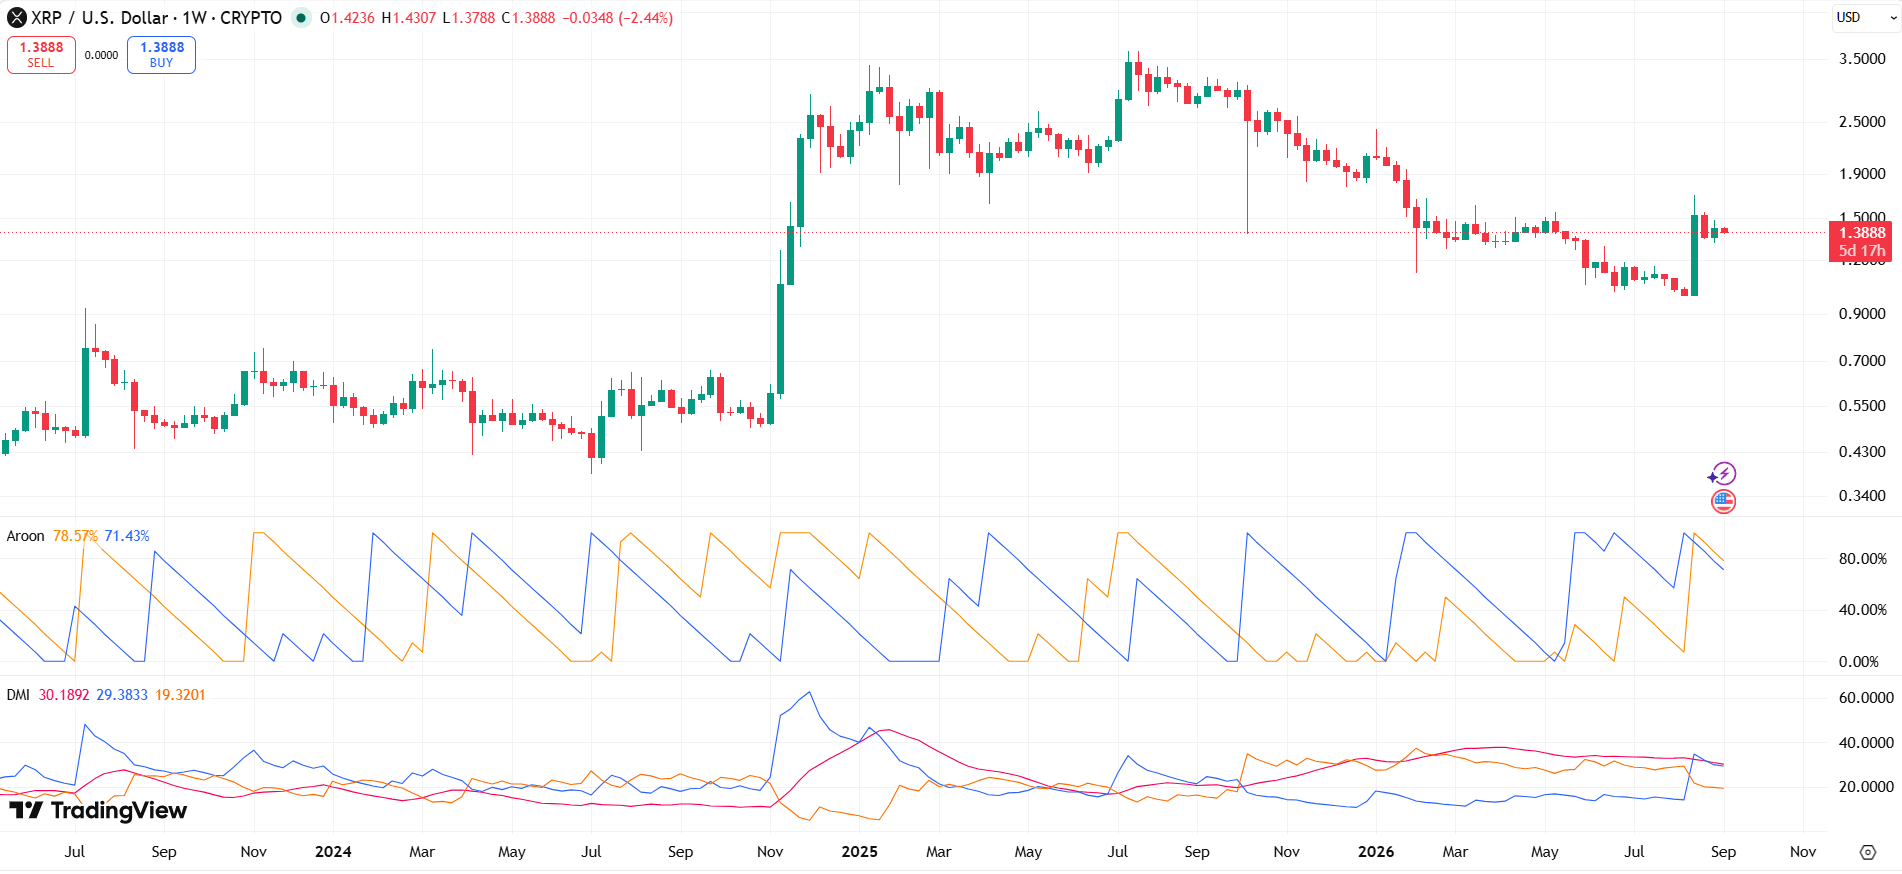
Meanwhile, XRP’s technical indicators also show a mixed trend while giving bulls a small edge. The Aroon Up reading stands at 78.57%, while Aroon Down sits at 71.43%. This gives XRP a mild bullish bias because the latest significant high occurred more recently than the latest significant low.

However, the gap between the two readings is only about 7 percentage points. That is not enough to show strong buying pressure or confirm that a major trend reversal is underway. Neither line has a lead, and their close readings suggest uncertainty.

For the Directional Movement Index, the +DI stands at 29.38 and remains above the -DI at 19.32, giving buyers a directional advantage. Meanwhile, ADX is at 30.18, showing that XRP remains in a trending market since readings above 25 generally show a strong enough trend.

XRP Weekly Chart
XRP Weekly Chart

XRP Trend Could Be Losing Strength

Despite the lead held by the +DI, the three DMI readings are all weakening. The +DI is falling, the -DI is also falling, and ADX is moving lower. These readings suggest that the current trend is losing strength and could move toward consolidation or a new directional move.

This makes XRP’s exchange flows worth observing. If inflows to Binance continue to rise, the risk of stronger selling pressure and a price pullback would increase. In contrast, if outflows begin to exceed inflows, it could be more positive for the price.

For now, XRP’s structure remains neutral to mildly negative in terms of exchange flows. A stronger signal would require clear net inflows or outflows to continue for several days instead of relying on activity from a single day.

Meanwhile, for the technical outlook to turn more clearly bullish, XRP needs a decisive weekly close above $1.50. Also, Aroon Up would need to widen its lead over Aroon Down, while ADX may need to stabilize or move higher to show that the trend is gaining strength again.