Home Blog Page 217

Winklevoss Brothers Move 1,750 Bitcoin to Gemini

0

Tyler Winklevoss and Cameron Winklevoss, the billionaire co-founders of Gemini, recently transferred more than 1,700 Bitcoin to the trading platform. 

The transaction, which occurred over the past week, has fueled speculation that the crypto billionaires may be preparing to sell part of their Bitcoin holdings.

Key Points 

  • Tyler Winklevoss and Cameron Winklevoss transferred 1,750 Bitcoin to hot wallets on Gemini, fueling speculation that the billionaires may be preparing to sell part of their holdings.
  • The brothers have already moved over 2,500 BTC to Gemini in recent weeks, suggesting a continued trend of trimming their Bitcoin holdings.
  • Despite these transfers, the twins still hold more than $600 million worth of Bitcoin.
  • Their massive Bitcoin stake dates back to 2013, when they invested about $11 million in BTC.

Winklevoss Brothers Move 1,750 Bitcoin to Gemini 

According to blockchain data from Arkham Intelligence, a wallet linked to the Winklevoss twins moved roughly 1,750 BTC, worth about $130 million, to a Gemini hot wallet since last week.

The transfers occurred in two transactions. First, the wallet sent a small test transaction of 0.00191 BTC. Shortly afterward, it moved the remaining 1,750 BTC in a larger transfer. 

Image

Typically, transfers to exchange hot wallets precede trading activity, which has led analysts to speculate that the twins could be preparing to sell part of their Bitcoin holdings. However, it remains unclear whether the billionaires have already sold the Bitcoin or moved the funds to the exchange for other purposes. 

Initial Investment in Bitcoin 

Meanwhile, the Winklevoss twins rose to prominence in the crypto industry after investing heavily in Bitcoin during its early years. In 2013, they reportedly invested about $11 million in Bitcoin when it traded at around $120. 

The purchase was partly funded with proceeds from a $65 million settlement with Mark Zuckerberg, the founder of Facebook. That investment positioned them among the largest individual Bitcoin holders at the time.

Over the years, the twins have periodically trimmed their holdings. For instance, reports indicate that they sold portions of their Bitcoin to help launch the Gemini crypto exchange. In addition, they have used some of their crypto wealth for political donations. In 2024, both brothers donated $1 million each to Donald Trump during the U.S. presidential campaign cycle.

Current Holdings 

More recently, their wallet activity suggests continued selling. Over the past month, addresses linked to the twins have transferred more than 2,500 BTC to Gemini, while receiving only 136 BTC during the same period.

Despite these sales, the Winklevoss twins remain significant crypto holders. At press time, their known wallet held about 8,757 BTC, valued at roughly $619 million, underscoring their continued exposure to Bitcoin. Additionally, they maintain a sizable position in Ethereum, holding approximately 70,588 ETH, valued at approximately $145 million. 

Image

Their latest transaction comes amid heightened volatility in the crypto market. Last week, Bitcoin traded around $66,000 amid intensified geopolitical tensions in the Middle East. However, the asset has since rebounded above the $70,000 level as market sentiment improved. At press time, Bitcoin trades at $70,700, up 0.45% over the past 24 hours. 

Software Engineer Explains What does Holding XRP Mean to Him, Aims for $100 to $1,000 XRP

Pro-XRP software engineer Vincent Van Code has argued that XRP’s relatively modest price growth since 2021 does not reflect the technology’s long-term potential.

He recently shared this perspective on X, explaining that he first bought XRP in early 2021 when the token traded around $0.50. About five years later, with the asset trading near $1.40, he noted the investment represents roughly a 300% gain.

While acknowledging that the increase is not life-changing given the size of his holdings, Van Code said his conviction in XRP grew after studying the underlying technology. 

According to him, examining the codebase, experimenting with the network, and analyzing the ecosystem led him to view the technology as a disruptor to legacy financial infrastructure.

Key Points

  • Software engineer Vincent Van Code says his XRP investment grew about 300% since 2021 but believes the asset’s true potential is still ahead.

  • After studying the XRP Ledger’s code and ecosystem, he views the technology as a disruptor to legacy banking systems.

  • Critics argue XRP has lagged behind faster-growing assets like Solana and BNB during recent crypto market cycles.

  • Despite the debate, Van Code says he is targeting a long-term XRP price range between $100 and $1,000.

XRP Ledger as Banking Disruptor

Van Code argued that the XRP Ledger could eventually challenge outdated banking systems that still rely on decades-old technologies such as COBOL.

Drawing a comparison to the transformation brought by Tesla in the automotive sector, he suggested blockchain networks like the XRP Ledger could similarly modernize global value transfers. He emphasized that XRP and its ecosystem are already influencing how money can move across borders.

The developer also pointed to two core factors investors should understand: that XRP technology is already disrupting value transfer mechanisms and that the crypto market often experiences heavy price manipulation.

Community Pushback Over Price Performance

However, not everyone agreed with his outlook. An X user known as Tensa Gizzla argued that XRP’s price action has lagged behind other major cryptocurrencies over the past decade.

The user pointed to assets such as Solana and BNB, which experienced significantly larger price surges during various market cycles. From that perspective, the commenter said many investors focus primarily on price momentum rather than technological fundamentals.

“Risk vs Reward” Approach to XRP

In response, Van Code first noted XRP traded around $0.007 a decade, which implies over 200X today. Meanwhile, he said many investors are drawn to stories of tokens delivering rapid 1,000x gains. To him, those outcomes are often speculative and closer to gambling than investing.

Instead, Van Code said he evaluates crypto assets through a risk-versus-reward framework. In his view, XRP carries relatively low downside risk compared with smaller speculative tokens, while the potential upside could be substantial if adoption grows.

Van Code also argued that investors often make the mistake of buying assets based on past performance rather than identifying those that may currently be undervalued. 

Determining true value, he said, requires years of research into technology, use cases, partnerships, and the problems a network aims to solve.

Long-Term Outlook Extending Beyond 2030

Despite acknowledging that his XRP holdings are modest, the developer said he plans to hold the asset well beyond 2030. Based on his research and long-term expectations for the ecosystem, he said he personally targets a price range between $100 and $1,000 for XRP.

He emphasized that the projection reflects his own research and journey as an investor, noting that every participant in the crypto market must make decisions based on their own financial goals and risk tolerance.

Hyperliquid (HYPE) Price Prediction for 2026, 2027, 2028, 2029, and 2030

0

Several platforms, including Telegaon and CoinCodex, have projected the price of one Hyperliquid (HYPE) token for 2026-2030.

HYPE, the native token of the decentralized perpetual futures exchange Hyperliquid, has demonstrated strong resilience despite the recent downturns.

On February 28, HYPE briefly plunged to $26 amid renewed hostilities in the Middle East. However, the token quickly rebounded above the $30 level and currently trades around $35.3.

Moreover, recent performance highlights strong market momentum. HYPE has climbed 13.48% over the past 24 hours and 10.96% over the past month. Over the past year, the token has surged 142%, even as the broader crypto market faced persistent volatility.

Key Points 

  • Hyperliquid continues to surge even as the crypto market recovers from recent bearish pressure.
  • HYPE has climbed 13.48% in the past 24 hours and 10.96% over the past month.
  • Analysts at CoinCodex project that HYPE could rally to $93 this year and reach $146 by 2030.
  • Telegaon forecasts a longer-term price range of $100 to $202, while ChatGPT sets moderate targets of $54 – $138.

Investors’ Confidence Strengthens HYPE’s Bullish Performance 

For context, the Hyperliquid decentralized exchange launched on its proprietary blockchain in 2023. Later, in November 2024, the project introduced the HYPE token. 

The founding team, which includes Jeff Yan, formerly of Hudson River Trading, distributed approximately 30% of the total token supply through an airdrop to early users who accumulated points by trading on the platform.

Since then, HYPE’s strong performance, even during periods of market pressure, has continued to boost investor confidence. As a result, many market participants expect further upside in the coming years. 

Possible Price Targets for HYPE by 2026, 2027, 2028, 2029, and 2030 

Amid this bullish sentiment, analysts from several platforms, including CoinCodex and Telegaon, have issued forecasts estimating HYPE’s potential price trajectory from 2026 through 2030.

CoinCodex’s Forecast 

According to CoinCodex, HYPE could maintain its upward trajectory and reach $93.56 by the end of 2026. However, the analytics platform expects a significant correction afterward, projecting that the token could decline to around $51 by the end of 2027.

Furthermore, CoinCodex anticipates continued weakness into 2028, when HYPE could return close to its current levels and trade around $38 by year-end. Nonetheless, the platform expects the token to recover afterward, projecting a rebound to $49.65 in 2029 and eventually climbing to $144.66. 

Telegaon’s Projections 

Meanwhile, Telegaon predicts that HYPE could trade above $100 starting later this year and maintain triple-digit valuations through 2030.

Specifically, Telegaon forecasts that HYPE could reach an all-time high of $102.89 by the end of 2026. Afterward, the token could set successive peaks of $121 in 2027, $148 in 2028, and $175 in 2029. 

Furthermore, Telegaon expects HYPE to trade between $177 and $202 by 2030. From the current price of $35.3, the token would need to rally approximately 472% to reach the upper target of $202. 

Hyperliquid Price Prediction Telegaon

ChatGPT Prediction 

Meanwhile, projections from ChatGPT present a more moderate outlook. Unlike other forecasts, the AI model does not expect HYPE to reach a new all-time high this year. Instead, it projects a bullish target of $54.87, which remains below the token’s September 2025 peak of $59.39.

However, the model anticipates stronger growth afterward. Specifically, ChatGPT forecasts that HYPE could reach a new all-time high of $61.58 in 2027 and climb further to $79.02 in 2028.

Interestingly, the AI model also predicts that HYPE could enter triple-digit territory by 2029, with a projected peak of $102.68. If the rally continues, ChatGPT estimates that the token could reach a new high of around $138 by 2030. 

ChatGPT Hyperliquid Prediction

Although these projections appear promising, there is no guarantee they will materialize. As a result, investors should not treat this analysis as financial advice. 

XRP Sharpe Z-Score Hit 8-Month Peak: What Does This Mean for Prices?

0

The XRP Sharpe Z-Score hits an 8-month peak, suggesting improvement in risk-adjusted performance.

XRP is going through its longest run of price declines in nearly ten years, having recorded five straight months of losses for the first time since late 2016 to early 2017. The price has dropped 50% during the current period and now trades at $1.4, as retail sentiment turns sour.

Despite this, XRP’s Sharpe Ratio and Sharpe Z-Score indicators have seen impressive upticks in recent times, suggesting that risk-adjusted sentiments may be improving across the board.

Key Points

  • XRP has recorded five consecutive months of price losses for the first time since 2016 to 2017, shedding 50% of its value to currently trade at $1.4.
  • Despite the ongoing price decline, data shows the Sharpe Z-Score has risen to 1.62, its highest reading since last July, as risk-adjusted performance improves.
  • The 7-day momentum has turned positive, and the 30-day Sharpe Ratio stands at 0.098, both moving in a direction that suggests early stabilization.
  • XRP still trades below its 200-day moving average of $2.19, and would need to gain 56% just to retest that level.
  • When both the Sharpe Ratio and Sharpe Z-Score rise together after a downturn, it aligns with early market stabilization or an accumulation phase.

XRP Sharpe Z-Score Hits 8-Month Peak

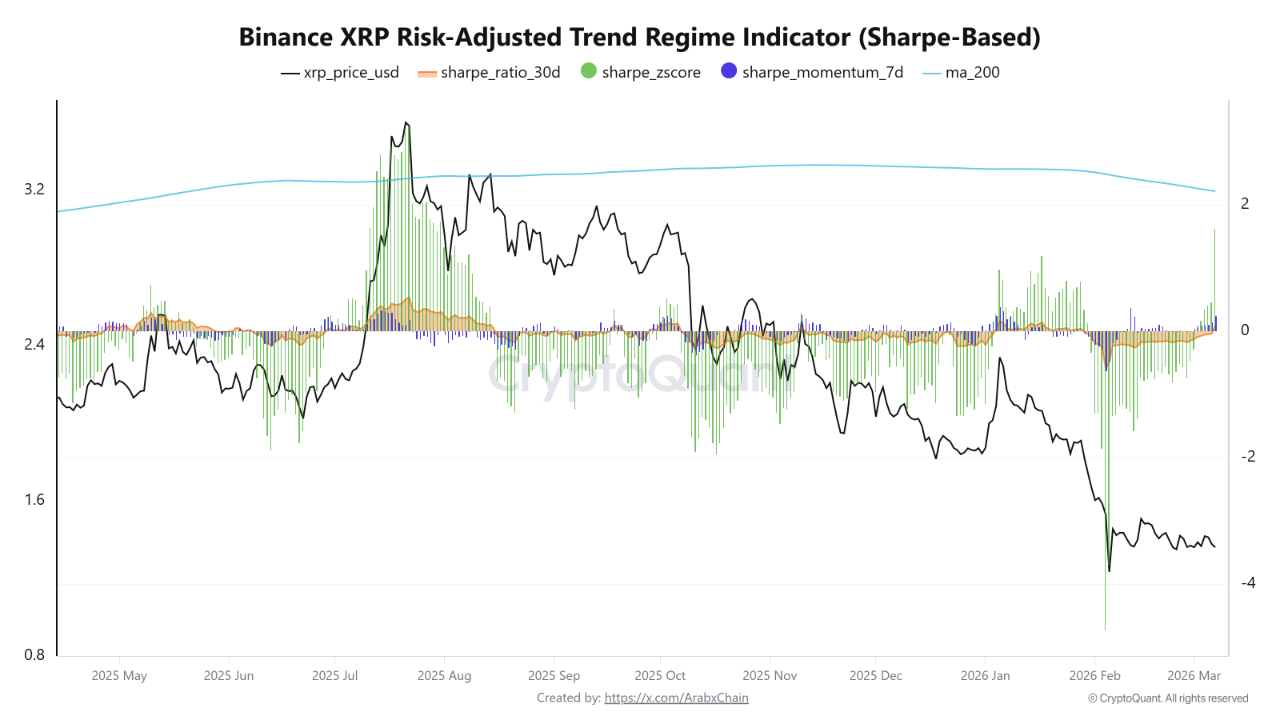
XRP community figure and market watcher Xaif recently called attention to these metrics. Citing data provided by CryptoQuant analyst Arab Chain, Xaif pointed out that XRP’s Sharpe Z-Score has climbed to its highest level since last July, now registering a reading of 1.62. This marks an 8-month peak.

In addition to this, the 7-day momentum has turned positive, and the 30-day Sharpe Ratio now sits at 0.098. While Xaif admitted that the Sharpe Ratio at 0.098 represents a small number on its own, he clarified that the direction it is moving remains bullish for prices.

XRP Sharpe Indicators CryptoQuant
XRP Sharpe Indicators | CryptoQuant

Amid these improvements in risk-adjusted metrics, Xaif stressed that the situation represents evidence of a structure that is slowly but gradually turning. According to him, this sort of directional change tends to appear before the broader market catches on.

XRP’s 200D MA Remains a Major Hurdle

Despite the encouraging signs, Xaif pointed out that XRP still trades well below its 200-day moving average, which currently stands at $2.19. For context, XRP slipped below this pivotal moving average on Oct. 10, 2025, when a broad crypto market crash sent prices tumbling 15.32% in a single day.

From Oct. 26 to 29, 2025, XRP made several attempts to climb back to the 200-day MA, but sellers turned it away on each try around $2.6. By the close of October 2025, XRP had fallen firmly below the average and has not come anywhere near retesting it since. 

XRP Trading Below 200D MA

With the token now at $1.4, it would need to rise 56% just to touch the moving average again. Considering the gap between XRP and the MA, Xaif stressed that the long-term trend has not reversed despite the improving Sharpe Z-Score and that anyone claiming it has is not telling the truth.

What Does This Mean for the XRP Price?

For the uninitiated, the Sharpe Ratio measures risk-adjusted return by taking an asset’s return, removing the risk-free rate, and dividing the result by the standard deviation of returns. A higher reading tells you the asset is generating better returns for the amount of risk it carries.

Meanwhile, the Sharpe Z-Score compares the current Sharpe Ratio to its own long-term average. This gives market participants a way to judge whether risk-adjusted performance is running unusually strong or weak relative to its own history. 

When both metrics start rising together after a downturn, it means returns are growing faster than volatility. This pattern typically shows up in the early stages of market stabilization or an accumulation phase, as the balance between risk and potential reward begins to move in favor of buyers.

Recovery Not Yet Guaranteed

However, Xaif admitted that the current situation does not guarantee a recovery. Instead, he stressed that it may represent a possible turning point for XRP that the data is beginning to support. 

According to him, recoveries do not start when everything looks good, but they start in quiet, low-sentiment moments like this one, when the numbers begin to move while most people are still looking the other way. 

Shiba Inu Forecast for Mar 10: SHIB Shoots 6%, but Weak Open Interest Raises Concerns

0

Shiba Inu rallies as market activity returns, but subdued derivatives open interest signals limited trader conviction behind the recent momentum.

Today, Shiba Inu (SHIB) recorded a 24-hour gain of about 6.2%, reflecting renewed buying activity across the crypto market. The intraday chart shows a gradual upward climb, with a range between $0.000005322-$0.000005658. 

Short-term performance data suggests improving momentum, with Shiba Inu posting gains of 0.7% over the past hour and 4.5% in the last seven days. However, the broader trend still reflects lingering pressure, as SHIB remains down 4.9% over 14 days and 8.5% in 30 days.

Shiba Inu is rising again. However, is this the start of a real recovery or just another short-lived rally?

Is this Shiba Inu’s Moment?

The daily chart for Shiba Inu shows the token attempting a modest rebound after an extended downtrend, though the broader structure remains bearish. Price currently trades below the 50-day EMA ($0.00000638) and the 100-day EMA ($0.00000726), indicating that longer-term momentum still favors sellers. 

Shiba Inu Price Analysis

These moving averages now act as overhead resistance. SHIB would need a sustained push above these levels to confirm a stronger recovery trend rather than a temporary bounce.

Meanwhile, the Commodity Channel Index sits near -37, recovering from deeper negative readings earlier in the cycle. This shift toward the neutral zone suggests that selling pressure is beginning to ease and momentum is stabilizing. 

However, because the CCI remains below zero and far from the +100 bullish threshold, the indicator signals that the current move likely represents early-stage recovery.

Shiba Inu Open Interest

Elsewhere, data from Coinglass shows that open interest in Shiba Inu derivatives has remained relatively subdued in recent weeks compared with earlier peaks. The chart indicates that open interest surged above $145 million in early January.

Shiba Inu Open Interest

However, it has since declined and now fluctuates closer to the $53–$60 million range, signaling reduced speculative activity in the futures market. For a stronger and sustained price rally to develop, open interest would likely need to rise significantly from current levels.

For perspective, increasing derivatives participation often reflects fresh capital entering the market and stronger trader conviction behind upward momentum.

DAG CEO Says XRP is Now the Safe Haven as Bonds React to Middle East Conflict

0

The CEO of DAG has suggested that XRP may now represent the new safe haven as bonds react strangely to Middle Eastern conflicts.

The escalating Israel-Iran conflict has rattled financial markets, and the bond market is showing one of the most surprising reactions. Amid declines in bond prices, the CEO of Digital Ascension Group (DAG) says XRP now acts as the reliable safe haven.

Key Points

  • The Israel-Iran conflict has pushed the 10-year US Treasury yield to 4.15%, defying the normal pattern where geopolitical crises drive investors toward bonds.
  • Surging oil prices are stoking inflation concerns that are overpowering the traditional safe-haven demand for Treasuries.
  • Amid this turn of events, the CEO of DAG argued that XRP, not Treasuries, is now the true safe haven for investors.
  • Since the conflict began on Feb. 28, XRP has gained 3.7%, outperforming gold (-3.46%), silver (-5%), and the S&P 500 (-1.2%).
  • Despite its short-term resilience, XRP remains down 23.6% year-to-date, and its recent gains may reflect the broader crypto market recovery.

Bonds’ Strange Reaction

Jake Claver, an XRP community figure and CEO of Digital Ascension Group, made these statements while responding to Michael A. Gayed, a Chartered Financial Analyst and Portfolio Manager for the Free Markets ETF.

Notably, Gayed pointed out that the 10-year US Treasury yield has climbed to 4.15%, jumping 18 basis points in just one week. Since bond prices and yields move in opposite directions, this rise indicates that investors have begun selling bonds instead of buying them.

10Year Treasury Yields

This is a strange phenomenon. Specifically, when the economy looks shaky, investors normally pour money into US Treasuries because they consider them a safe place to park their cash. 

The buying pressure pushes yields lower. But right now, the opposite is happening. Gayed emphasized that the ongoing situation breaks the playbook, indicating that the rules that investors have long relied on may no longer hold up.

Why the Conflict Is Driving Inflation Fears Instead of Safety

The Israel-Iran conflict escalated around Feb. 28, after US and Israeli strikes on Iran, which led to Iranian retaliations that dealt a blow to regional stability and raised concerns about energy supplies. 

Under normal circumstances, a conflict of this scale would push more investors toward Treasuries, driving yields down. Instead, the conflict has sent oil prices higher due to fears that supply routes, particularly through the Strait of Hormuz, could face serious disruptions. These inflation worries are now stronger than the urge to seek safety in bonds.

With a spike in energy costs, broader price pressures would build across the economy, pushing investors to demand higher yields to protect themselves against inflation. This essentially forces bond prices down further. 

What is emerging now looks increasingly like a stagflationary environment that makes it harder for the Federal Reserve to cut interest rates without making inflation worse. The bond market is now moving through terrain it rarely encounters, and there is no simple roadmap for what comes next.

Is XRP the New Safe Haven?

With the bond market behaving so unpredictably and suffering declining prices and rising yields, Jake Claver has argued that he believes XRP, not Treasuries, is now the real safe haven. 

This is not the first time Claver has gone against the idea of traditional safe investments. In May 2025, he argued that a 100-year study shows that following the crowd into conservative investments is actually the quickest way to lose wealth. Then last September, he suggested that investors face two clear paths: hold crypto and grow their wealth, or watch fiat currency slowly eat away at it. 

XRP Performance Since the Conflict Began

Recent performances since the Israel-Iran conflict started partially support Claver’s arguments. Specifically, XRP has gained 3.7% since the conflict started on Feb. 28, trading at $1.40 at press time, putting it ahead of several well-known assets over the same stretch. 

Gold, which most people think of as the go-to safe haven, has actually fallen 3.46% to $5,181 per ounce. Silver has done even worse, dropping 5% to $88.90 per ounce. The S&P 500 has slipped 1.2%, sitting at 6,795 points. Among all the assets in this comparison, only oil has beaten XRP, with WTI crude jumping 31% to $88 per barrel.

Despite this, calling XRP a confirmed safe haven right now may be a stretch. Notably, XRP is still down 23.6% for the year, which means it has underperformed every asset mentioned above when looking at the bigger picture. 

Moreover, XRP’s recent gains may have little to do with safe-haven demand and more to do with a wider crypto market recovery driven by Bitcoin, with the total global crypto market cap climbing 5.7% since the conflict began.

Cardano Prediction for Mar 10: ADA Stuck Below $0.296 Resistance as Weak Network Activity Raises Concerns

0

Cardano remains below key resistance as limited DeFi activity and slower ecosystem growth raise momentum concerns.

Cardano (ADA) trades near $0.2616, posting a 1.79% daily gain and showing a gradual upward trend on the intraday chart. The price repeatedly rebounded from the $0.253–$0.256 support zone, suggesting buyers stepped in to defend this level during short-term pullbacks.

This behavior indicates mild accumulation, as traders pushed the price back toward the $0.262 area after several brief dips. Despite this short-term strength, broader performance remains weak, with ADA down 5.65% in the past week and 44.43% over the last 90 days. 

In the near term, the $0.255 level acts as key support, while a move above $0.265–$0.27 could signal stronger recovery momentum if buying pressure continues. Where’s ADA headed?

Cardano Price Analysis

The daily chart from TradingView shows Cardano trying to recover after a downtrend over the weekend. ADA is now trading below the recent SAR resistance near $0.296, indicating that buyers still need stronger momentum to confirm a sustained recovery.

Cardano 1D Chart
Cardano 1D Chart

Meanwhile, the Bull Bear Power indicator remains negative at -0.011, showing that sellers still maintain a marginal advantage despite occasional bullish spikes. The histogram has gradually moved closer to the zero line compared with the deeper negative readings from early February, indicating that selling pressure may be easing. 

If BBP crosses into positive territory while price breaks above the $0.28–$0.30 resistance zone, it could signal strengthening bullish momentum. Until then, the indicators suggest ADA is attempting to stabilize, with the market transitioning from strong bearish pressure toward a possible accumulation phase.

Here’s Why Cardano Remains Stuck

Elsewhere, crypto analyst Ali Martinez warns that $0.245 remains the critical support level for Cardano. According to Martinez, a decisive break below this threshold could accelerate selling pressure and open the door to significantly lower targets. 

He suggests that if the support fails to hold, ADA could slide toward $0.112 or even $0.051, implying a potential 50% to 80% decline from the $0.245 zone.

Cardano 3D Chart
Cardano 3D Chart

Additionally, in his thread, Martinez highlighted concerns about limited on-chain activity within the Cardano ecosystem. He noted that although ADA ranks among the largest cryptos by market cap, the total value locked in its DeFi ecosystem has never exceeded $1 billion, according to DefiLlama. 

This suggests that much of the asset’s valuation may still rely on speculative demand rather than sustained network usage. Martinez added that Cardano continues to face strong competition from other networks, while its late introduction of smart contracts in 2021 allowed rival ecosystems more time to build stronger developer adoption and network effects.

Ripple Senior VP Says ETFs Are Unlocking New Capital for XRP

Ripple’s Senior Vice President of RippleX, Markus Infanger, believes XRP ETFs are playing a major role in expanding capital flows into the ecosystem.

Speaking in a recent podcast, Infanger discussed how XRP and the XRP Ledger (XRPL) have evolved over the years and how institutional adoption is becoming a key focus for RippleX’s roadmap.

Key Points

  • RippleX SVP Markus Infanger says XRP ETFs are opening new capital channels, helping institutions access the XRP ecosystem.

  • The XRP Ledger’s real-world asset market has grown to about $2B as RippleX pushes institutional DeFi adoption.

  • New XRPL tools like lending, atomic swaps, and programmable escrow aim to expand financial use cases.

  • Infanger believes XRP could become a key settlement and liquidity layer as crypto and traditional finance converge.

Institutional DeFi and XRPL Growth

Infanger explained that one of RippleX’s main priorities is advancing institutional decentralized finance on the XRP Ledger. According to him, the network has seen increasing momentum in bringing high-quality financial assets onto XRPL.

He noted that the real-world asset (RWA) market capitalization on the XRP Ledger has grown to around $2 billion. This places the network among the top ecosystems supporting tokenized assets.

RippleX is now developing financial infrastructure that allows these assets to be used more effectively across decentralized finance. The roadmap includes financial primitives that enable new use cases such as collateral mobility, stablecoin payments, and lending services.

Recent developments on XRPL include the launch of a lending protocol and upgrades such as atomic swaps, privacy features, and programmable escrow capabilities. These tools seek to expand the business and financial logic that can be executed on the network.

ETFs as a Bridge Between TradFi and Crypto

Infanger also highlighted the role of ETFs in the future of XRP adoption. He described ETFs as a mechanism that connects traditional finance with digital assets by opening new capital channels.

According to him, ETFs act almost like a “free trade agreement” between traditional finance and the crypto ecosystem. They allow institutional capital to flow more easily into assets like XRP.

By making the asset more accessible to investors, he believes ETFs could support builders and innovators developing applications within the XRP Ledger ecosystem.

Infanger added that growing institutional recognition could eventually position XRP as a complementary asset within the financial system alongside traditional instruments such as U.S. Treasury securities.

XRP’s Long History in the Crypto Market

Reflecting on XRP’s evolution, Infanger noted that the asset has remained among the top cryptocurrencies for much of its existence and is one of the earliest digital assets following Bitcoin.

He emphasized that XRP was designed primarily for payments, with the ability to settle transactions within seconds and at extremely low costs. These characteristics continue to support Ripple’s payment infrastructure and financial applications.

Infanger believes the asset could play a major role as financial markets converge with decentralized finance, serving as an efficient settlement, liquidity, and collateral layer for global finance.

He also observed that awareness of XRP has grown significantly over the years. Earlier in his career at Ripple, he said many people were unfamiliar with how the asset worked. However, recognition has now increased as digital assets gain traction within governments and financial institutions.

Overall, Infanger sees the crypto industry moving toward a more mature phase, with assets like XRP increasingly integrating with traditional financial systems.


Cardano Founder Says This Is the Worst Sentiment Period in Crypto History

0

Even market veterans like Cardano founder Charles Hoskinson have not seen periods of poor crypto sentiment like the current market.

Hoskinson noted in a recent YouTube podcast that in his 15 years of active participation in the crypto space, no period has seen as much fear, doubt, and uncertainty as now. This comes particularly as the crypto market struggled for months, and an internal crisis strengthened.

Key Points

  • Hoskinson noted that in his 15 years of active participation in the crypto space, no period has seen as much fear, doubt, and uncertainty as now.
  • The Cardano founder noted that hope is fading in the digital asset space, with crypto sentiments turning largely negative.
  • Hoskinson mentioned that the negative sentiment has persisted since the October 10 crash.
  • However, the Cardano founder suggests the sector can recover from this setback by being better and different.

Worst Crypto Sentiment Ever?

Charles Hoskinson noted that hope is fading in the digital asset space, with crypto sentiments turning largely negative. Bitcoin fell from $126,200 in October to $60,000 in February before reclaiming $71,000 at the time of writing. Altcoins, which didn’t even perform well by prior-cycle standards, recorded steeper declines, with over 38% of them currently near all-time lows.

This has caused investors to panic and exit the market. While this is not the first time such corrections have occurred, this time seemed different. Data shows that the Fear and Greed Index dropped to a new all-time low of 5 last month, signaling extreme fear.

What could have caused this worsened sentiment? Hoskinson mentioned the October 10 crash. Notably, the market capitulation of that day holds the record as the sector’s largest liquidation event, wiping out over $19 billion in 24 hours.

On the surface, it looked like Donald Trump’s 100% tariff hike on Chinese imports was the major cause of that bloodbath. But developments have seen industry leaders like OKX CEO Star Xu accuse Binance of causing the October 10 crash with its aggressive marketing of the Ethena USDe. Binance has since denied this, but this remains unconfirmed.

Meanwhile, the market has not recovered from that event, with assets trending even lower. The bloodbath saw investors lose large sums of money, creating skepticism and affecting sentiment towards the sector in general. Hoskinson noted it was the lowest he has seen crypto sentiment go in his 15 years following the sector.

How We Can Get Out: Cardano Founder

However, the Cardano founder suggests the sector can recover from this setback. In the podcast, he recommended doing something better and different.

“How we get out of it is by being better and being different and giving people a reason to have good sentiment,” Hoskinson stated.

For Cardano, Hoskinson stated that the ecosystem should work together, harnessing all its exceptional governance capabilities to build utility and enhance user experience. He added it is “theirs to lose,” as doing so would show the strength of their decentralized governance system over other centralized systems.

If the Cardano ecosystem heeds this clarion call, Hoskinson noted that it would be a flagbearer and “vanguard” of the new cryptocurrency space. The chain would also record its strongest year in history.

Dogecoin Price Analysis for Mar 10: What’s Next as DOGE Holds ‘Best Buy’ Zone and $1.2 Target in Focus

0

Dogecoin falls below a long-term Fibonacci extension as an analyst highlights a historic buy area.

Dogecoin (DOGE) trades near $0.09175, posting a modest 0.4% gain over the past 24 hours. DOGE is moving within a narrow band between $0.0897 and $0.0923, with price action repeatedly testing both ends of the range throughout the session. 

Earlier in the day, the asset dips toward the lower boundary near $0.089, but buyers gradually return, lifting the price back above the $0.091 level as short-term sentiment improves.

With the price hovering just below the $0.092 resistance area, the market now watches whether sustained buying pressure can push DOGE toward a stronger breakout. On the flip side, others are watching if it will keep it locked within its recent consolidation range.

What’s Next for Dogecoin?

Elsewhere, on the weekly chart, Dogecoin is attempting to stabilize after a prolonged downtrend that followed its previous rally. Price action remains below several key Fibonacci retracement levels derived from the earlier upward move, with the 0.786 retracement around $0.1678, the 0.618 level near $0.1975, and the 0.382 zone close to $0.2392 all acting as overhead resistance.

Dogecoin 1W Chart
Dogecoin 1W Chart

The market previously broke below the 1.0 Fibonacci extension level around $0.1300, which historically serves as an important structural support area. DOGE is now attempting to reclaim this $0.1300 level, which could determine whether the market begins forming a stronger recovery structure.

Further, the Average True Range on the weekly timeframe continues trending downward toward 0.027, signaling that volatility has been gradually decreasing. This contraction often reflects a period of reduced market activity before a larger directional move develops.

If Dogecoin successfully regains the $0.1300 Fibonacci extension, the next potential recovery targets could emerge toward the $0.167–$0.197 region. Failure to reclaim this level may leave the asset consolidating in the lower support zone.

Dogecoin’s Best Buy?

Elsewhere, crypto analyst Trader Tardigrade points to a notable development on Dogecoin’s long-term chart. He highlights that the asset is currently holding within a support channel on the monthly timeframe above the $0.085 level. 

Dogecoin Prediction
Dogecoin Prediction

According to the analyst, Dogecoin remains positioned near what he describes as a historically significant “best buy” level. The chart suggests that DOGE is once again testing this lower boundary of the long-term trend structure while maintaining support above the channel.

Notably, the analyst notes that this marks the third major “best buy” point in Dogecoin’s history, citing earlier periods in which similar pullbacks to the same trendline preceded large upward moves. 

By holding this support region, Dogecoin may be maintaining the broader bullish structure that has developed over multiple cycles and could push it toward $1.2. To reach $1.20, Dogecoin would need to surge by about 1,208% from the current price of $0.09175.