Home Blog Page 251

Multiple Breadcrumbs XRP Has Always Left for Investors Since 2013

0

Market data indicates that XRP has left breadcrumbs or macro formations to ascertain its position in every cycle since 2013.

The crypto market has taken a heavy hit this year, shedding $662 billion in value, and XRP has not escaped the pressure. Despite the declining prices, market data shows the current downturn follows a bigger and familiar pattern, and XRP could recover promptly.

Notably, XRP has consistently left “breadcrumbs” that investors could leverage across each cycle. These breadcrumbs refer to repeatable macro formations that signal where the price stands in its cycle.

Key Points

  • While XRP has continued to collapse over the past five months, market data shows it has persistently left “breadcrumbs” since 2013.
  • These breadcrumbs refer to macro formations or clues across multiple cycles that indicate where the price stands in each cycle.
  • The macro formations have ranged from sharp vertical upsurges, like in 2017, to long compressions like in 2018 to 2020.
  • Currently, XRP trades within the descending flag or falling channel formation, which indicates that prices could recover promptly.

The Ignition Coil

Market watcher EGRAG Crypto highlighted these breadcrumbs in a recent analysis. Notably, he called XRP’s early phase “The Ignition Coil,” which covers the period from 2013 to 2016. 

During these years, the price printed tight, overlapping monthly candles while volatility slowly compressed. XRP briefly climbed to $0.03 in December 2014, but the move did not hold. Instead, the price corrected and formed a descending triangle that stretched for nearly three years. By March 2017, XRP had dropped to $0.005.

XRP Ignition Coil EGRAG Crypto
XRP Ignition Coil | EGRAG Crypto

EGRAG said the key breadcrumb here was the descending triangle. According to him, every major XRP rally begins with long compression. Without that coiled pressure building over time, the explosive move that follows simply does not happen.

The Vertical Ignition

Once XRP broke above the compression in 2017, it entered what EGRAG names “The Vertical Ignition.” In this phase, the price action moved quickly. Bullish monthly candles stacked with very little overlap, indicating strong expansion. Notably, XRP surged from $0.005 in March 2017 to $0.4536 by May 2017.

For EGRAG, the breadcrumb in this phase is the indication that when XRP breaks out of compression, it moves fast and aggressively. The expansion does not play out slowly, but happens with force.

Controlled Decompression

After the 2017 surge, XRP moved into the “Controlled Decompression,” spanning 2018 to 2020. Here, the price met resistance at the May 2017 high of $0.4536 and then pulled back slightly. From June 2017 to November 2017, XRP consolidated between $0.1242 and $0.2159, forming an orderly channel.

EGRAG believes the breadcrumb here is the “The Flag.” Notably, instead of collapsing, XRP bled within the structure. Selling looked systematic rather than emotional, and the price never fully retraced the prior impulse.

The Vertical 1-Month Candle

The next formation after the decompression is the “Vertical Expansion/Ignition Candle.” During this formation, XRP broke out of the decompression by December 2017 and printed a massive monthly candle, rallying 740% in that single month. The move extended into January 2018, when XRP reached $3.5.

EGRAG noted that the breadcrumb tied to this candle shows that XRP often tops or enters a range around such extreme vertical moves. To him, this kind of candle tends to appear near the beginning of the end of a major price uptrend.

The Long Bear Market

After peaking at $3.5 in January 2018, XRP entered the “Long Bear Market,” which EGRAG also calls the “Descending Compression Channel (Macro Cooldown).” From January 2018 to June 2020, the price moved inside a long, downward-sloping channel with overlapping monthly bodies and a slow grind lower. By June 2020, XRP had fallen to $0.1751.

XRP Long Bear Market EGRAG Crypto
XRP Long Bear Market | EGRAG Crypto

EGRAG sees the breadcrumb here in the structure itself. Instead of seeing a sudden collapse, XRP underwent a time-based correction, referring to a controlled decompression after expansion. He noted that every time XRP completes this kind of descending compression channel, it follows with another Vertical Expansion candle.

The Echo Run

EGRAG calls the next rally “The Echo Run.” After recovering from July 2020, XRP broke above the descending triangle and climbed to $1.96 by April 2021. Although this move was less vertical than the 2017 surge, it still marked an impulsive run.

According to him, the breadcrumb here confirms the higher-order trend. He stressed that a second expansion leg validates the broader direction and does not happen by accident.

The Structural Reset

Meanwhile, from the April 2021 high of $1.96, XRP dropped and entered “The Structural Reset.” Between 2021 and 2023, the price drifted lower within a falling channel. Notably, by February 2023, XRP had dropped to $0.3761.

Here, the breadcrumb shows that XRP favors time-based corrections instead of sharp price destruction. The price moved lower in an organized Descending Channel while macro support continued to hold.

The MACRO Range

Following the reset, XRP did not collapse. Instead, it entered the “The MACRO Range,” also known as “The Acceptance Range.” From February 2023 to October 2024, XRP’s price traded sideways between $0.39 and $0.80, forming a horizontal channel with flat.

EGRAG noted that the breadcrumb in this phase relates to digestion and accumulation. Specifically, XRP held its structure and moved sideways rather than down, preparing for a potential expansion into a higher range.

The Breadcrumb Zone

In November 2024, XRP broke out of the horizontal channel and surged to $3.4 by January 2025 following the U.S. presidential election. It later pulled back to $2 and consolidated between $2 and $3. EGRAG calls this stage “The Breadcrumb Zone.”

The Breadcrumb Zone EGRAG Crypto
The Breadcrumb Zone | EGRAG Crypto

He said the breadcrumb here lies in the strong breakout body followed by smaller corrective candles, with the price holding above its prior base. He noted that this structure has appeared before every major continuation.

Following Breadcrumbs

The current formation, which began turning bearish in October 2025, carries the name “Following Breadcrumbs,” which EGRAG also calls the “Descending Flag/Falling Channel (Bullish Continuation).” In this phase, XRP dropped from $2.84 at the start of October 2025 to $1.41, marking a decline of more than 50%.

Despite this, EGRAG believes the structure remains intact. He called it a downward-sloping, controlled pullback with overlapping bodies and no panic selling after an impulsive move higher. 

He insisted that this pattern does not indicate a top, but represents a cooldown inside a broader uptrend. As long as the range holds, he maintains that XRP’s macro rhythm, involving the phases: Ignite, Range, Flag, Expand, remains intact.
Ripple CEO Says Strategic Acquisitions Are Strengthening XRP

0

Ripple CEO Brad Garlinghouse says the company’s recent acquisitions have been carefully designed to strengthen the XRP ecosystem.

In particular, he stated that every move has been aligned with long-term growth on the XRP Ledger. Garlinghouse shared this information while speaking at The Economic Club of New York’s Digital Payments Series Luncheon.

He explained that Ripple’s expansion strategy is not random. Instead, it focuses on building infrastructure and improving utility for XRP and the XRP Ledger (XRPL).

According to him, “Our acquisitions have certainly been very strategic in how we do more things to improve the overall XRP ecosystem”. He added that RLUSD plays a key role in that strategy, as deeper on-chain liquidity benefits developers, institutions, and users building on the network.

Key Points

  • Ripple CEO Brad Garlinghouse says recent acquisitions are strategically strengthening the XRP ecosystem.

  • Speaking at The Economic Club of New York, he stressed long-term growth for XRP and the XRP Ledger.

  • Garlinghouse said Ripple’s bank-first strategy positioned it as key infrastructure for global cross-border payments.

  • He highlighted RLUSD’s role in boosting on-chain liquidity, supporting developers and institutions building on XRPL.

Ripple Strategic Acquisitions

In 2025, Ripple aggressively expanded through acquisitions, including prime broker Hidden Road for $1.25 billion to deepen its institutional services and treasury software provider GTreasury to enhance its corporate finance tools.

It also acquired custody firms Metaco and Palisade to strengthen institutional asset security, alongside stablecoin platform Rail to expand its on-chain payments and liquidity capabilities. According to Ripple’s CEO, these efforts seek to strengthen XRP’s appeal.

Ripple’s Bank-First Strategy

During the discussion, Garlinghouse reflected on Ripple’s early decision to target banks as primary customers. At a time when much of the crypto industry was positioning itself against traditional finance, Ripple took what he described as a contrarian and controversial approach.

From the beginning, Ripple focused on financial institutions as distribution channels for blockchain-based payments. The logic was that banks remain the primary touchpoint for billions of people who interact with financial services. If blockchain technology is to reach the largest audience, integration with banks is essential.

That strategy may have drawn criticism early on, but it has since positioned Ripple as a key infrastructure provider in cross-border payments.

Regulatory Clarity Still Key

Garlinghouse also stressed the importance of regulatory clarity. Clear definitions around what qualifies as a crypto asset, currency, security, or commodity would allow large financial institutions to engage more confidently with digital assets.

He suggested that clearer rules would unlock further institutional participation, accelerating adoption across global markets.

Crypto Winter as a Reset

While acknowledging that the crypto market has experienced a crypto winter, Garlinghouse described the downturn as a constructive reset.

In his view, market corrections force companies to sharpen their focus, refine their value propositions, and prioritize real-world problem-solving. Historically, he noted, each downturn has ultimately left the industry stronger and more mature.

RLUSD and Liquidity on XRP Ledger

Notably, Garlinghouse highlighted RLUSD as part of Ripple’s broader ecosystem strategy. By increasing liquidity on-chain, RLUSD enhances efficiency and usability across the XRP Ledger.

More liquidity, he explained, supports developers building decentralized applications and institutions leveraging blockchain for payments and settlement.

Ultimately, as Ripple continues to expand through strategic acquisitions and infrastructure upgrades, the company focuses on reinforcing XRP’s role in institutional finance while it strengthens the capabilities of the XRP Ledger ecosystem.

XRP Cycle Math Predicts Prices Where XRP Could Bottom

0

Data from XRP’s cycle math shows that the XRP price may still drop lower this cycle before it can find a solid bottom.

The bull market that defined 2025 appears to have given way to a more bearish market environment. The prevalent bearish pressure has dealt a blow to XRP’s price action, leading to a 60% decline from the July 2025 all-time peak of $3.66.

At some point, XRP dropped to a 15-month local low of $1.11 before recovering to the current price of around $1.41. While multiple market participants believe the $1.11 floor marked this cycle’s bottom, cycle math from historical context suggests XRP could drop further to the $0.75 to $0.85 range before finding a bottom.

Key Points

  • Amid the ongoing downtrend that picked up in Q4 2025, the XRP price collapsed to a 15-month low of $1.11 on Feb. 6 before recovering above $1.4.
  • Most market participants believe this floor price may have marked the bottom of the downturn, but data suggests steeper declines could play out.
  • An XRP cycle math which leveraged historical data on past bottoms shows that subsequent cycle bottoms have been 2.8x higher than the immediate past ones.
  • This data indicates that XRP could bottom at $0.78 in the ongoing cycle, translating to a price range of $0.75 to $0.85.

XRP’s Crash to $1.11

Well-regarded market technician EGRAG Crypto highlighted these figures as some investors continue to anticipate the bottom for this cycle. At the same time, another camp insists that the $1.11 low marked the lowest price for XRP.

For context, the broader market’s bearish pressure intensified in early February, with XRP recording a steep 19.62% crash on Feb. 5, as it lost the $1.5 psychological mark on that day. The selloffs spilled into the next day, resulting in a steeper drop to $1.11 on Feb. 6. 

This price level, which marked a 15-month low for XRP, represented a 69.7% drop from XRP’s all-time high of $3.66. Due to the extent of this decline, several market analysts and investors have insisted that the $1.11 low may have marked XRP’s bottom for this cycle.

XRP Cycle Low Could Come in at $0.75 to $0.85

However, in his latest market commentary, EGRAG suggested that the bottom could be lower, aligning with projections from fellow analyst CoinsKid. He presented what he called the XRP cycle math, using data from historical context to assess where XRP could find its bottom in the ongoing downtrend.

Specifically, the market analyst called attention to the fact that XRP saw its market bottom in the 2020 bear market at $0.10. Notably, this low emerged in March 2020. Meanwhile, the 2022 bear market bottom came in at $0.28 when XRP dropped to a low of $0.2870 by June 2022. 

XRP Bottom
XRP Bottom

EGRAG pointed out that the $0.28 bottom in 2022 represented a 2.8x increase from the 2020 bottom at $0.10. This represents a natural effect in the crypto market, as subsequent bear market bottoms often emerge at higher prices than previous ones due to the consistent uptrend crypto assets witness. 

Now, EGRAG has calculated XRP’s subsequent bottoms to be 2.8x higher than the immediate past ones. If this pattern continues, he calculates XRP’s next bottom to come in at $0.78, placing it within the $0.75 to $0.85 range. 

Implication from Current Prices

EGRAG said that in his view, every market cycle pushes XRP to a higher support level, reduces how sharply it can fall, and follows an actual pattern instead of random moves. He added that while markets don’t move in exactly the same way each time, XRP’s trend of setting higher lows keeps repeating.

Currently, XRP changes hands at $1.41, already down 22.48% this year alone. For XRP to collapse to the $0.85 to $0.75 region, its price would need to drop an additional 39.7% to 46.8%. The last time XRP saw this price range was in November 2024.

Goldman Sachs CEO Admits Holding Bitcoin, “Still Trying to Figure It Out”

0

Goldman Sachs CEO David Solomon has acknowledged that he personally owns a small amount of Bitcoin.

Solomon made the disclosure during an appearance at the World Liberty Forum in Palm Beach. Speaking to attendees, he said he is still evaluating Bitcoin’s behavior and confirmed that his holdings are minimal.

The comment gained wider attention after investor Grant Cardone shared it on the social media platform X.

Key Points

  • Solomon personally owns a small, undisclosed amount of Bitcoin.
  • Goldman Sachs holds approximately 13,740 Bitcoin via U.S.-listed spot ETFs worth $920 million after recent price declines.
  • The bank also reports $1 billion in Ethereum exposure, ~$153 million in XRP, and ~$108 million in Solana.
  • Total crypto-linked ETF holdings for Goldman Sachs are roughly $2.36 billion.
  • The bank is exploring blockchain applications, including tokenization, stablecoins, prediction markets, and potential integration into core operations.

Regulatory Filing Details Extensive Crypto Positions

On February 10, Goldman Sachs’ fourth-quarter 2025 Form 13F filing became public. The document provides a detailed snapshot of the bank’s indirect exposure to cryptocurrencies through U.S.-listed spot ETFs.

According to the filing, Goldman has exposure to approximately 13,740 Bitcoin. At the end of the quarter, that position was valued at about $1.7 billion.

However, following a nearly 50% decline in Bitcoin’s price, the stake is now estimated at roughly $920 million. The decrease represents an unrealized loss, and the disclosure indicates the bank has not reduced its Bitcoin allocation.

Beyond Bitcoin, the filing outlines a range of digital asset investments. Goldman reports about $1 billion in Ethereum exposure, alongside approximately $153 million in XRP exposure and $108 million in Solana exposure. Altogether, the firm’s crypto-linked ETF holdings total roughly $2.36 billion.

Broadening Strategy in Digital Assets

These figures suggest that Goldman’s crypto strategy extends well beyond its initial focus. Specifically, during the fourth quarter, the bank added exposure to XRP and Solana following the launch of spot ETFs for those tokens, expanding its footprint beyond Bitcoin and Ethereum.

At the same time, Solomon has highlighted internal efforts to explore blockchain-based finance. During the firm’s fourth-quarter earnings call, he said a significant number of employees are working on tokenization, stablecoins, and other elements of digital market infrastructure. Additionally, he referenced exploratory work involving prediction markets.

Notably, Solomon indicated that the bank is exploring how blockchain-based systems could enhance existing businesses. Rather than seeking to be an early mover, he suggested Goldman aims to integrate digital tools where they align with its core operations.

Furthermore, Solomon pointed to ongoing legislative discussions in Washington, including debate around the CLARITY Act. While cautioning that change is unlikely to happen quickly, he acknowledged that clearer regulation could play a significant role in shaping the future of digital markets.

Taken together, these developments mark a notable shift from the bank’s earlier tone on cryptocurrencies. In previous years, Goldman’s research teams characterized Bitcoin as largely speculative with limited practical use. Today, however, the institution manages billions of dollars in regulated crypto investment products.

Top Crypto Founder Says Three XRP Yield Providers Are ‘Almost’ Ready to Launch

0

Wietse Wind, founder of XRP wallet Xaman Wallet, has revealed that three XRP yield providers are on the verge of going live directly within the wallet’s home screen.

In a recent post, Wind disclosed that users will soon be able to access yield opportunities straight from the Xaman interface. Users will also see deployed capital displayed in the asset list.

He teased the rollout by asking the community which provider would launch first and which one users are hoping for. Shortly after, Xaman’s official account echoed the development with a simple post: “XRP + yield?” 

This essentially signals that native yield access within the leading self-custodial XRP wallet is close.

Key Points

  • Xaman Wallet founder Wietse Wind says three XRP yield providers are nearly ready to launch.

  • Users will soon be able to access yield opportunities directly from Xaman’s home screen.

  • FXRP supply surpasses 100M, showing strong demand for XRP-based DeFi and passive income.

  • Institutional interest grows as Doppler Finance and SBI Ripple Asia explore XRP yield products.

XRP Yield Momentum Builds

The announcement comes amid accelerating momentum around XRP-based decentralized finance. Earlier this week, Flare Network reported that its wrapped XRP asset, FXRP, is nearing the 100 million supply milestone. As of press time, the FXRP supply has now surpassed 100 million.

Indeed, since its launch in September 2025, FXRP supply has continued to surge. Over 85% of the supply is locked across DeFi protocols such as Enosys, Kinetic, BlazeSwap, and Upshift.

According to Flare, more than 37,000 minting transactions have taken place, reflecting sustained demand from XRP holders seeking on-chain utility and passive income opportunities. The majority of FXRP is currently deployed across lending, liquidity, and yield-generating applications within the Flare ecosystem.

This rapid expansion suggests that XRP is moving beyond a payments asset to becoming a yield-bearing instrument within DeFi.

Flare's FXRP supply
Flare’s FXRP supply

Institutional Interest in XRP Yield Products

Beyond retail DeFi, institutional players are also entering the XRP yield narrative.

In December, XRPL-native protocol Doppler Finance announced a strategic partnership with SBI Ripple Asia to develop institutional-grade XRP yield products and advance real-world asset tokenization on the XRP Ledger.

The collaboration marked SBI Ripple Asia’s first partnership with a native XRPL protocol. The move highlights institutional appetite for compliant, yield-focused blockchain infrastructure. 

With regulatory clarity improving in regions like Japan and Singapore, many institutions are exploring XRP-based financial products beyond traditional payment corridors.

Xaman at the Center of XRP DeFi Access

Notably, Xaman has already played a key role in expanding XRP’s DeFi accessibility. In October, Flare integrated Xaman, enabling users to mint FXRP directly from the wallet without transferring assets to external EVM wallets.

Now, with three yield providers reportedly “almost ready” to launch inside Xaman’s home screen, the wallet is set to become a central gateway for XRP-native yield opportunities.

The development also comes as discussions continue around the proposed XLS-66 amendment, which could introduce native lending functionality to the XRP Ledger. 

While some have questioned whether external DeFi platforms would remain relevant, leading community voices argue that multiple ecosystems can coexist and complement each other.

Shiba Inu Finally Breaks Bearish Price Structure: Details

0

The Shiba Inu price has made a decisive move, one which, when confirmed, could mark the start of a recovery phase after prolonged dips.

Indeed, the price of Shiba Inu has retraced considerably over the past few months, mirroring a broader market trend. From its high of $0.00003343 in December 2024, it has corrected 81.4%, reaching lows last seen in several years. Yet, recent price action signals a turnaround could be on the horizon.

Key Points

  • The price of Shiba Inu has made a decisive move, one which, when confirmed, could mark the start of a recovery phase after prolonged dips.
  • A market structure break has occurred on the SHIB/USDT 4-hour chart.
  • Shiba Inu has been in a downtrend, following the classic lower-higher and lower-low pattern, until recent positive price action broke the structure.
  • On February 14, it broke above its previous lower high of $0.00000648, reaching $0.00000725.
  • Following the market structure break, Shiba Inu is now retesting the area, and the outcome of this retest would confirm or invalidate the breakout.

Shiba Inu Breaks Structure

Analyst SwallowAcademy identified a market structure break on the SHIB/USDT 4-hour chart in a recent TradingView analysis. For the uninitiated, this involves moving against the predominant market trend, in this case, the last lower high.

Shiba Inu has been in a downtrend, following the classic lower-higher and lower-low pattern. In early February, it reached a new low of $0.00000507, then rebounded to a lower high of $0.00000648 on February 7.

However, something interesting happened. Instead of another lower low after consolidating, SHIB headed northward, breaking the market structure. On February 14, it broke above its previous lower high of $0.00000648, reaching $0.00000725.

Shiba Inu Structure Retest

Following the market structure break (MSB), the analyst noted that Shiba Inu is now retesting the area. An accompanying chart shows that the token has dropped to the breakout zone and is currently consolidating around it. He called this the long accumulation or retest phase.

Shiba Inu Break of Structure/SwallowAcademy

A successful retest would confirm the market momentum shift and start a renewed bullish price action. Meanwhile, the analyst identified entry points and four upward targets for the meme coin if it does complete this retest.

The chart shows his entry is around $0.00000662, a price SHIB will reach only if it witnesses a successful retest. From there, the commentator expects higher prices of $0.0000079, $0.0000081, $0.0000083, and $0.0000085. From the current market price of $0.00000621, this represents rallies of 27%, 30%, 33.6%, and 36.8%, respectively.

Key Caveat to Note

Notably, this rally depends solely on Shiba Inu holding above this breakout zone. Losing this would invalidate the market structure break and could only mean another lower high formation before a bearish continuation.

Currently, SHIB trades below this zone, and a sustained trend suggests a failed retest. How it reacts around will reflect in the next few candlesticks, which will determine the validity of this pattern.

XRPL Records First Permissioned Offer on XRP DEX

0

The XRP Ledger (XRPL) has reached a major milestone following the creation of the first permissioned offer on the XRP DEX.  

Popular XRPL dUNL validator Vet highlighted the development on Wednesday shortly after the network activated XLS-81, popularly known as the “Permissioned DEX” amendment. 

Key Points

  • The XRPL has reached a major milestone with the creation of its first permissioned offer on the XRP DEX. 
  • Labeled “Offer Create Permissioned,” the transaction embeds compliance conditions directly into the trade. 
  • The transaction comes a few seconds after developers activated XLS-81, or the Permissioned DEX amendment. 
  • The offer involved 5.89 XRP in exchange for 589 RLUSD, referencing the symbolic “589” figure. 

First Permissioned Offer Created on XRPL

In a tweet, Vet confirmed that the first permissioned offer has gone live on the XRP DEX, marking a major step toward compliant on-chain trading. The transaction, labeled “Permissioned – Offer Create,” embeds conditions that restrict who can execute the trade.

Vet explained that this feature allows participants to limit access to their orders, including restricting requirements, to only KYC-verified accounts or regulated entities. Unlike traditional open DEX listings, permissioned offers integrate compliance logic directly into the transaction, enabling automated enforcement without third-party intermediaries.

The accompanying screenshot shows that the offer was created on February 18 at 10:58 (UTC). The user listed 5.89 XRP for 589 RLUSD, signaling a nod to the symbolic “589” figure widely recognized in the XRP community. 

Image 

XRPL Enables Permissioned DEX

Notably, developers activated the Permissioned DEX amendment (XLS-81) just seconds before the first offer went live. This upgrade allows regulated institutions to trade on the XRP Ledger through gated, compliance-driven marketplaces.

Unlike the open public DEX, permissioned domains restrict who can place and accept offers, limiting participation to AML- and KYC-compliant entities. Developers designed the Permissioned DEX specifically for financial institutions, such as brokers and banks, to facilitate on-chain trading and settlement without exposing markets to unrestricted access. 

(XRP Ledger)

Enhancing Institutional DeFi on XRPL

Meanwhile, this development strengthens XRPL’s institutional DeFi strategy. It complements the recently implemented Token Escrow amendment (XLS-85), which expanded escrow functionality to all issued assets, including tokenized real-world assets and stablecoins.

In addition, developers are pushing to implement XLS-66, widely known as the XRPL Lending Protocol, which aims to introduce a native lending framework tailored for institutional DeFi.

Collectively, these upgrades equip regulated financial players with a robust on-chain toolkit, enabling use cases such as stablecoin FX rails, tokenized funds, and compliant secondary markets.  

Shiba Inu Price Forecast for Feb 19: SHIB Needs to Cross Above This Bollinger Band Resistance

0

Shiba Inu trades under pressure as price struggles below mid-band resistance, with subdued open interest signaling cautious sentiment.

Shiba Inu (SHIB) is currently trading at $0.000006216, down by 4.7% over the past 24 hours, reflecting heightened short-term bearish pressure. The 24-hour daily range spans from $0.000006218 to $0.000006525, highlighting a relatively tight but clearly downward-trending session. Price action shows SHIB initially attempted to stabilize near the upper end of its range before gradually sliding lower, now trading near the bottom of the daily band.

Further performance metrics show SHIB is down 3.2% over 14 days, although it remains up 2.5% in the last 7 days, indicating some short-term bounce attempts within a broader weakening structure. Additionally, longer-term pressure remains evident with a 21.8% decline over 30 days. Traders will now be watching whether SHIB can reclaim the upper boundary of its daily range.

Shiba Inu Price Analysis

On the daily chart, Shiba Inu remains under broader bearish pressure, with price trading just below the middle Bollinger Band (around $0.00000638) and well beneath the upper band near $0.00000706. The lower Bollinger Band sits near $0.00000569, which now acts as immediate dynamic support.

Shiba Inu Price Prediction

A breakdown below this area could expose deeper support around the recent swing low near $0.0000051, while a move back above the middle band would be the first sign of short-term recovery strength.

In terms of resistance, the middle Bollinger Band represents the first key hurdle for bulls. If SHIB reclaims and sustains above that level, the next upside target would likely be the upper band near $0.0000070. However, repeated failures near the mid-band suggest sellers are still active on rallies. The overall band structure is currently contracting, indicating volatility is cooling.

Looking at momentum, the RSI (14) is hovering around 41–42, below the neutral 50 level. This places SHIB in weak-to-neutral territory, reflecting lingering bearish momentum but not oversold conditions. For a stronger bullish case, RSI would need to push above 50 and hold, signaling a shift in momentum. 

Shiba Inu Open Interest

Shiba Inu’s open interest data shows derivatives positioning has remained relatively subdued compared to earlier spikes, reflecting cautious sentiment among leveraged traders. As of Feb. 19, open interest sits around $72 million, notably lower than the early January peak when it surged above $140 million alongside a notable price rally. 

Shiba Inu Open Interest

The decline in open interest through late January and early February coincided with weakening price action, indicating long liquidations and reduced risk appetite. While there has been a minor rebound in positioning over the past few sessions, it remains modest relative to previous highs. This implies that traders are not aggressively building new leveraged exposure yet, keeping overall momentum muted.

For a stronger bullish case to develop, a sustained rise in open interest alongside upward price movement would be a key signal, pointing to fresh capital entering the market.

XRP Now on Track to Print 5 Red Monthly Candles: Price Spiked 60,000% The Last Time This Happened

0

XRP is now on track to record five consecutive monthly candles for the first time in a decade. The last time this happened, the price spiked 60,000%.

The crypto market has not fared well since the fourth quarter of 2025, and altcoins such as XRP have felt the biggest impact. Notably, XRP began October 2025 with a price of $2.84, but has since dropped to $1.42 at press time. This represents a 50% decline over the past five months.

However, what stands out is how consistent the declines have been. For context, XRP has recorded four consecutive monthly losing candles since October 2025, and is on track to record a fifth one, with a 13.56% drop this month, February 2026. The last time XRP saw five consecutive monthly losses, its price spiked more than 60,000%.

Key Points

  • XRP has continued to face steep declines over the past few months, down 50% since the fourth quarter of 2025.
  • However, a more interesting find is how consistent the downturn has played out, with XRP now seeing four consecutive monthly red candles.
  • XRP has now dropped 13.56% this month, February 2026, and is currently on track to record its fifth consecutive monthly red candle for the first time in a decade.
  • Historical data confirms that the last time this occurred was from late 2016 to early 2017, and XRP soared more than 60,000% after recovering.

XRP On Track to Record Fifth Monthly Candle in Red

Market analyst CryptoBull was the first to spotlight this trend amid the ongoing market downturn. Notably, after XRP soared to the $3.66 all-time high in July 2025, it faced bearish pressure and has since witnessed consistent declines.

The token first recorded an 8.15% drop in August 2025 before recovering by 2.55% in September of that year. However, when the broader market downtrend emerged in October 2025, things took a turn for the worse. Notably, since October 2025, XRP has only witnessed consistent monthly red candles.

Within this period, the crypto asset recorded four straight monthly red candles, with a decline of 42% across these months. Now, the fifth month, February 2025, seems to be following the same trend, with XRP already down 13.52%, as it changes hands at $1.42. If XRP closes February in the red, that would mark its fifth consecutive losing candle.

Historical Data Confirms How Rare This Trend Is

Interestingly, market data shows that five consecutive monthly drops are extremely rare in the crypto market, regardless of the intensity of the bear market. 

Notably, even during the Terra ecosystem collapse of mid-2022, which devastated the entire crypto market and led to extreme losses for XRP, XRP only saw three consecutive monthly red candles from April to June 2022.

Also, leading to the November 2022 FTX collapse, XRP only saw consecutive red candles from October to December 2022. Before now, XRP had not recorded even four consecutive monthly red candles since 2020, much less five.

The Last Time This Happened, XRP Spiked 60,000%

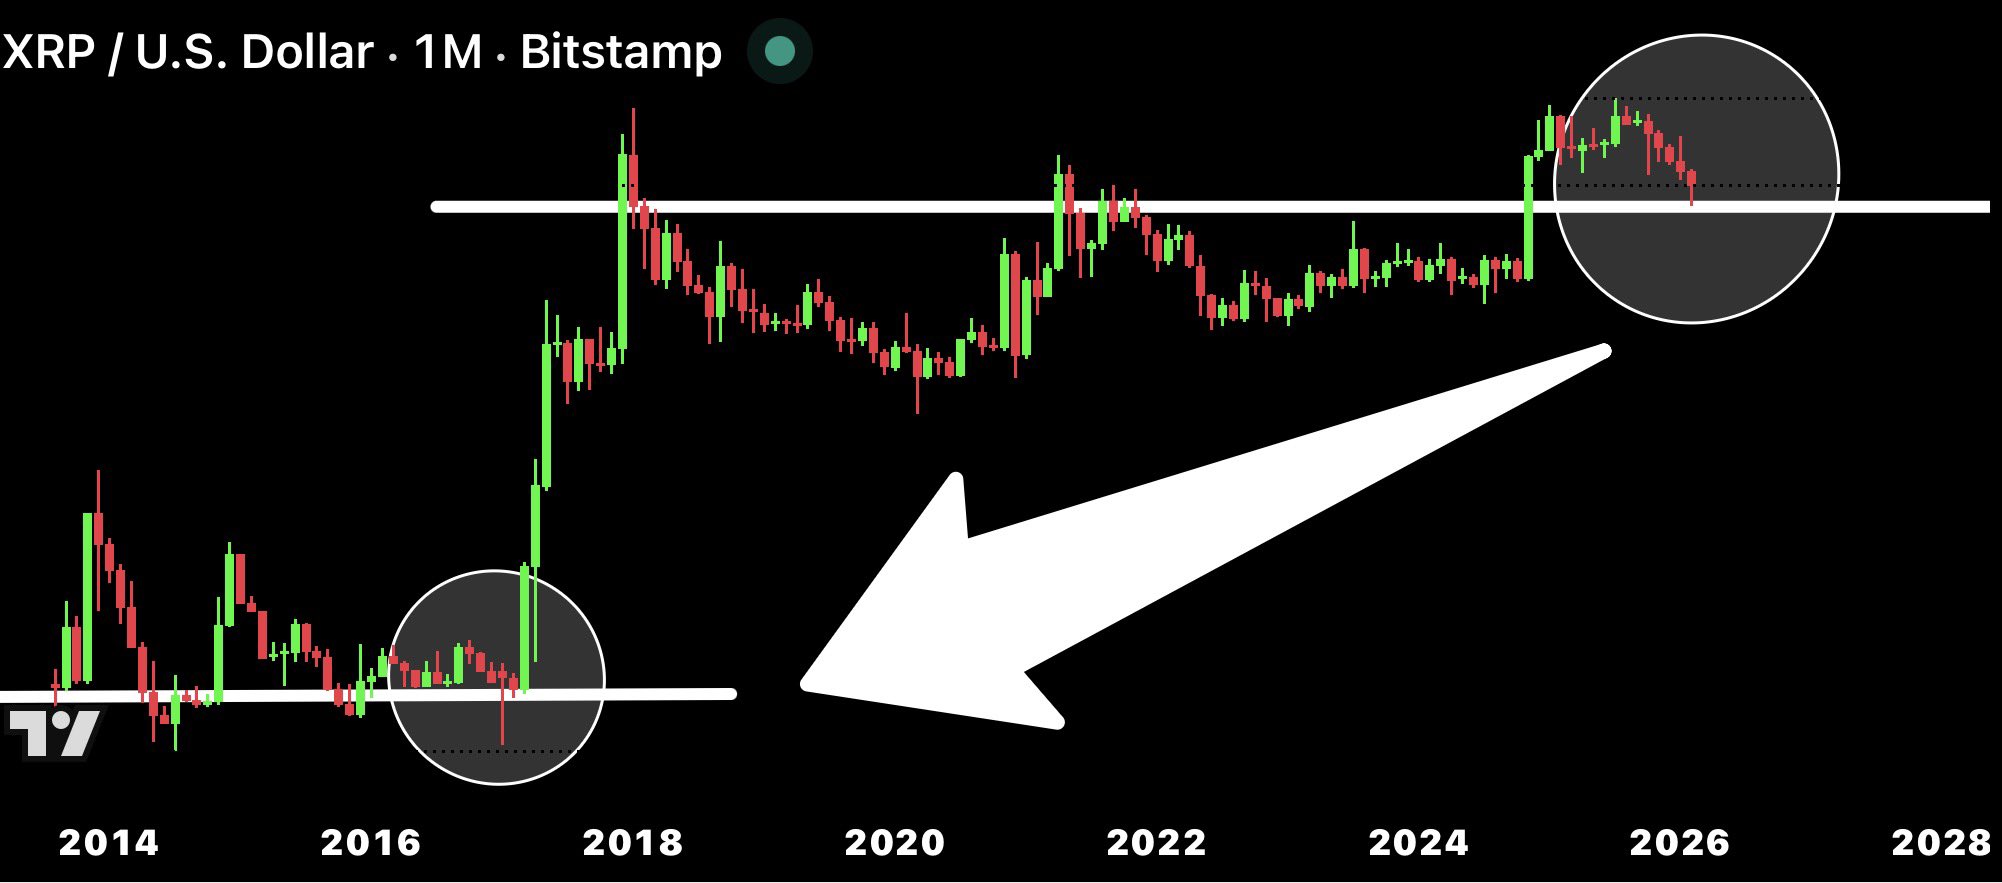
The last time XRP saw five consecutive monthly losing candles was from late 2016 to early 2017. Specifically, these declines began in October 2016 and continued to February 2017. Within this period, the XRP price collapsed from $0.00885 to $0.00557, marking a 37% decline.

XRP 1M Chart CryptoBull
XRP 1M Chart | CryptoBull

However, what followed was an impressive upsurge that most market participants never expected. Specifically, XRP increased from $0.0055 in March to $0.3988 by May 2017 before facing a roadblock and consolidating for six months. After the consolidation, the rally resumed, pushing XRP to the $3.31 peak in January 2018.

Overall, the rally from $0.0055 in March 2017 to $3.31 by January 2018 represented a 60,081% increase in XRP’s price. CryptoBull’s analysis suggests that if the trend repeats, XRP could see another massive upsurge once this downtrend ends. 

For context, a 60,000% rise from the current price would lead to $841. However, it remains highly unlikely that XRP would see such gains. Besides, there is no guarantee that XRP has the potential to repeat the trend from 2017. As a result, investors should not regard this assessment as investment advice.

Google Searches for “Bitcoin Going to Zero” Hit All-Time High

0

Online searches questioning Bitcoin survival have climbed to their highest level in years, highlighting deepening anxiety across the crypto market.

According to Google Trends data, global interest in the phrase “Bitcoin going to zero” peaked at 100 in February 2026. The surge comes as Bitcoin trades roughly 50% below its record high, amid broader economic and geopolitical uncertainty.

Key Points

  • Google searches for ‘Bitcoin going to zero’ reached a peak of 100 in February 2026, the highest in over 3.5 years.
  • The Crypto Fear & Greed Index currently stands at 11, reflecting extreme market caution.
  • Bitcoin currently trades roughly 50% below its all-time high of $126,080 reached on October 6, 2025.

Search Data Signals Growing Fear

The latest spike marks the strongest search interest in more than 3.5 years. Specifically, the previous peak occurred in June 2022, when the score reached 72 during a major market downturn.

At the time, Bitcoin fell 37.29% in a single month, sliding from $32,000 to $19,942. This pattern underscores how retail sentiment often reacts sharply to volatility, with panic-driven searches rising as prices decline.

Google Trend Data for Bitcoin

Analysts frequently track Google search trends as a real-time indicator of public sentiment. Typically, search activity accelerates during major rallies or sharp sell-offs. In this case, the surge reflects mounting concern rather than renewed optimism.

Market anxiety has intensified since Bitcoin reached its all-time high of $126,080 on October 6, 2025. Since then, the asset has declined 47%, weakening overall market confidence and fueling renewed debate about its near-term outlook.

Sentiment Index Reflects Extreme Caution

The shift in investor mood is also evident in traditional crypto sentiment indicators. For instance, the Crypto Fear & Greed Index, which measures market emotion on a scale from 0 to 100, currently stands at 11. Earlier this month, on February 6, 2026, the index dropped to a record low of 5.

Such low levels typically signal widespread caution among investors. Historically, extreme fear has often been viewed as a potential buying opportunity. However, that assumption is now being questioned.

Nic Puckrin, co-founder of Coin Bureau, recently challenged the conventional strategy in a post on X. He argued that buying Bitcoin during extreme fear does not always produce strong short-term gains.

Based on his analysis, when the index falls below 25, the average 90-day forward return has been just 2.4%. By comparison, purchases made during “Extreme Greed” periods have historically generated average 90-day returns of up to 95%. He described the index as a backward-looking momentum indicator rather than a reliable forecasting tool.

Image

Debate Over Time Horizon

Puckrin’s findings quickly sparked debate. Meanwhile, critics questioned whether a 90-day window captures the full picture.

One market observer responded that Bitcoin’s longer-term performance tells a different story. Over 12 months following extreme fear readings, the cryptocurrency has historically delivered average gains exceeding 300%.

Supporters of this view contend that the Fear & Greed Index is more useful for accumulation strategies than short-term trading. They argue that investors should not expect immediate gains when buying during periods of peak pessimism.

The debate reflects a broader divide between short-term traders and long-term investors. For now, however, rising panic-driven searches and continued price weakness suggest that caution remains the dominant sentiment across the market.