Bitwise has highlighted the strong performance of its spot XRP ETF, which has surpassed $500 million in AUM just nine months after launching.
In a statement celebrating the milestone, Bitwise credited the XRP community for its continued support and described the achievement as evidence of growing mainstream access to XRP investment products.
Currently, the Bitwise XRP ETF now holds $507.23 million in net assets, making it the largest XRP ETF by assets. The fund has also recorded $603.56 million in cumulative net inflows, highlighting strong investor demand since its launch.
The asset manager became the first firm to file for a spot XRP ETF in the United States, submitting its application in October 2024. At the time, the legal battle between Ripple and the U.S. SEC remained unresolved.
Shortly after Bitwise filed its application, the regulatory landscape became even more uncertain. The SEC indicated that it intended to challenge the ruling in the Ripple case and subsequently filed an appeal.
Despite these challenges, Bitwise maintained its commitment to the product. Rather than withdrawing its application, the firm continued pursuing regulatory approval and eventually launched the ETF on November 21, 2025.
That decision has since proved significant as demand for regulated XRP investment products continues to grow.
Bitwise Leads the XRP ETF Market by Assets
Bitwise currently leads the XRP ETF market with $507.23 million in net assets, representing 34.98% of the sector’s total $1.45 billion in net assets.
Franklin follows with roughly $370 million, while Canary has accumulated about $341.6 million. Meanwhile, 21Shares holds $153.05 million, and Grayscale has recorded around $83.03 million in net assets.
The Bitwise fund also continued attracting capital as August came to a close. On August 31, the ETF recorded more than $3 million in trading volume before ending the session with a $930,420 net inflow.
Although the daily inflow remains modest compared with the fund’s cumulative figures, it shows that investors continued allocating capital to the product after it crossed the $500 million milestone.
Meanwhile, XRP trades at around $1.39, up 1.30% over the past 24 hours. However, the coin remains 8.17% lower over the past week as the broader cryptocurrency market gives back some of its recent gains.
Thailand’s securities regulator is considering a framework that would allow intermediaries to offer retail investors access to certain digital asset derivatives listed in overseas markets.
The Securities and Exchange Commission’s plan would assess both the contract’s features and the market where it is traded. For retail access, a foreign contract would have to closely match a crypto derivative traded in Thailand in areas such as the underlying asset, maturity, leverage, and settlement mechanism.
Clearing and Regulatory Oversight Form Part of the Test
The overseas trading venue would also have to use a central counterparty to clear transactions. Its regulator must belong to international regulatory or exchange groups specified under the proposal.
Contracts falling short of the SEC’s proposed criteria would be available only to institutional investors. The regulator based that distinction on institutional investors’ greater ability to evaluate and manage products involving complexity and elevated risk.
The planned framework builds on Thailand’s evolving crypto derivatives framework and its existing approach to overseas derivatives investment.
The planned framework builds on Thailand’s existing approach to overseas derivatives investment. Under current rules, intermediaries can serve retail and high-net-worth clients seeking foreign derivatives when those instruments are comparable to products traded in the domestic market.
The SEC is proposing requirements specific to digital assets because crypto derivatives available abroad can vary in structure and risk.
Crypto Assets Enter Thailand’s Derivatives Framework
The consultation follows an earlier expansion of Thailand’s crypto derivatives framework covering the assets that can underpin derivatives in Thailand. Through a notification dated March 5, the SEC added cryptocurrencies and digital tokens to the list of permissible derivatives underlyings.
The SEC is also discussing potential contract specifications for those assets with the Thailand Futures Exchange.
XRP ETFs continue to attract substantial investor demand, and Bloomberg ETF analyst James Seyffart is describing the flow performance as “surprisingly resilient.”
Seyffart highlighted the trend in a post on X. He shared Bloomberg data showing that U.S. spot XRP ETFs have accumulated about $1.8 billion in cumulative net inflows since launching.
“XRP ETF flows have been surprisingly resilient,” Seyffart wrote, noting that money has “mostly only gone one direction” when looking at aggregate flows.
He added that the performance is particularly impressive when compared with XRP’s price action over the same period.
XRP ETF Flows Continue to Climb
The chart Seyffart shared shows cumulative XRP ETF flows rising from about $150 million on November 13, 2025, to around $1.45 billion by January 16, 2026.
Flows then consolidated around the $1.3 billion-$1.5 billion range during the following months before resuming their upward trajectory.
The figure subsequently climbed steadily through June, July and August. As of August 26, 2026, cumulative XRP ETF net inflows stood at approximately $1.79 billion, according to Bloomberg’s graphic.
That represents a roughly $1.64 billion increase from the $150 million recorded in November.
XRP ETFs inflows by Bloomberg
Goldman Sachs Leads XRP ETF Institutional Holders
Seyffart’s latest ETF-flow commentary followed a post highlighting institutional ownership of spot XRP ETFs based on Q2 13F filings.
According to his data, Goldman Sachs was the largest holder among the firms listed. It holds about $87.45 million in XRP ETF exposure, equivalent to 84.05 million XRP. Its exposure increased by more than 83.15 million XRP over the last quarter.
Jane Street Group ranked second, with approximately $16.64 million in exposure, equivalent to nearly 16 million XRP, after adding about 13.57 million XRP.
Millennium Management followed with approximately $16.20 million in exposure, representing roughly 15.58 million XRP.
Other institutions reporting XRP ETF positions included Intesa Sanpaolo, Marex UK Holdings, Ironbridge Private Wealth, Kaleidoscope Capital, Wolverine Asset Management, Bain Capital Private Equity and Citadel Advisors.
Weekly XRP ETFs Inflows Up 177%
Recent flow data further illustrates the acceleration in demand. XRP ETFs recorded approximately $110.49 million in weekly inflows, a massive 177% increase from just $39.78 million the previous week.
In the last trading session, XRP ETFs attracted $5.64 million. Canary led inflows with $4.71 million, bringing its cumulative inflows to about $486.73 million. Bitwise XRP ETF attracted $930,420, bringing its cumulative inflows to roughly $603.56 million.
However, Franklin’s fund, 21Shares, and Grayscale recorded no new inflows on Monday. Still, the figures suggest that demand has remained strong even after XRP’s sharp rally and subsequent pullback.
XRP Monthly ETFs Inflows Also Show Major Reversal
The improvement is also visible on a monthly basis. XRP ETFs have recorded $159 million in monthly inflows in August, compared with just $27.29 million during the previous month.
Specifically, that represents a 462.7% increase. The acceleration coincided with XRP’s explosive price move in the second half of August.
XRP climbed from $0.9888 to $1.70, delivering a gain of 72% in just four days. The token has since corrected by 20%, trading around $1.37 at press time.
Wall Street’s interest in XRP appears to be gaining momentum, with Goldman Sachs Group Inc. emerging as the largest institutional holder of spot XRP ETF positions.
According to Goldman Sachs’ Q2 2026 13F filing, the investment bank reported $87.45 million in XRP ETF exposure, equivalent to 84,054,142 XRP. The filing represents an $83.15 million increase from the previous quarter, placing Goldman Sachs well ahead of other institutions with reported exposure to spot XRP ETFs.
The development stands out because Goldman Sachs had completely liquidated its XRP ETF holdings in Q1 2026. At the time, the firm held $154 million across four products from Bitwise, Franklin Templeton, Grayscale, and 21Shares.
However, Goldman Sachs has since returned to the market, accumulating $87.45 million worth of XRP ETF shares and taking the top spot among institutional holders.
Goldman Sachs Leads Other Institutions by Wide Margin
Jane Street Group LLC ranks second, reporting $16.64 million in XRP ETF exposure, equivalent to 15,997,314 XRP. The firm increased its reported exposure by about $13.57 million from the previous quarter.
The gap between the two institutions remains significant. Goldman Sachs’ reported XRP ETF exposure is more than five times larger than Jane Street’s, underscoring the scale of the investment bank’s position relative to its peers.
Furthermore, Millennium Management LLC, Intesa Sanpaolo SpA, and Marex UK Holdings Ltd rank third, fourth, and fifth, respectively. Their XRP ETF holdings stood at approximately $16.2 million, $14.42 million, and $8.12 million.
Wall Street XRP ETF Holdings
Spot XRP ETFs Attract $1.67 Billion in Inflows
The institutional accumulation comes as U.S. spot XRP ETFs continue to attract substantial capital.
According to SoSoValue data, the five spot XRP ETF products have recorded $1.67 billion in cumulative inflows, while their combined net assets have reached $1.45 billion.
The Bitwise XRP ETF (XRP) currently leads the U.S. market, with $507.23 million in net assets and $603.56 million in cumulative flows. Meanwhile, the Franklin XRP ETF (XRPZ) ranks second, holding roughly $370 million in net assets and recording approximately $462 million in cumulative flows.
Other products, such as Canary, 21Shares, and Grayscale, account for nearly $580 million of the total net assets.
Pons (PONS) Coin Explained: Why the Robinhood Chain Launchpad Token Is Surging.
Pons (PONS) is the native token of the leading non-custodial launchpad on Robinhood Chain. Learn what it is, why its price has exploded from $0.003 to nearly $0.47, the buyback-and-burn flywheel, and its full price history.
PONS PRICE CHART
Pons (ticker: PONS) is the native token of Pons, a non-custodial, permissionless token launchpad built exclusively for Robinhood Chain. Robinhood Chain is an Arbitrum-powered Ethereum Layer-2 that reached public mainnet on July 1, 2026.
Pons itself is not an official Robinhood product; it is operated by Pons Labs and was created by a pseudonymous developer known as MEADGod.
The platform lets anyone deploy a fixed-supply token (typically 1 billion tokens) and its trading pool in a single transaction directly from their own wallet. There is no coding required, and the platform never takes custody of user funds.
Early versions launched tokens straight into locked Uniswap V3 WETH pools. Later versions added a bonding-curve phase before tokens graduate into permanently locked Uniswap V4 pools once they reach a liquidity threshold (around 4.2 ETH). Creators pay a small launch fee (0.0005 ETH) and trading carries a 1% fee that is split between the token creator (70%) and the protocol (30%).
PONS captures value from this activity. Eighty percent of the protocol’s share of fees is automatically used to buy PONS on the open market via a TWAP process and send those tokens to a burn address.
The remaining 20% covers operations. This creates a direct flywheel: more launches and trading volume generate more fees, which buy and burn more PONS, shrinking supply while demand tied to platform usage grows. Roughly 29% of the original 1 billion max supply has already been burned, leaving a circulating supply of approximately 709–712 million tokens.
Why the Price Is Going Up
Several factors have driven the recent rally. First, Pons rapidly became the dominant launchpad on Robinhood Chain. It has processed hundreds of thousands of token launches, billions of dollars in volume, and frequently accounts for well over 60% of new-token trading activity on the chain. Daily tokenhttps://thecryptobasic.com/ creation often exceeds 20,000. High usage produces real protocol revenue—sometimes approaching $1 million in a single day—which directly funds buybacks.
Second, the tokenomics are aggressively deflationary. Continuous burns reduce circulating supply while CEX listings (MEXC, Gate, KuCoin and others) and growing on-chain liquidity have expanded access.
Third, product upgrades have broadened the platform’s appeal. V2 introduced bonding curves, Uniswap V4 pools, and support for additional quote assets including tokenized stocks and Coinbase’s wrapped Bitcoin (cbBTC) via Chainlink infrastructure. These features position Pons as more than a meme-coin factory; it is becoming infrastructure for a wider range of on-chain assets.
Market participants have also responded to Robinhood Chain’s overall growth and the first-mover advantage Pons captured shortly after the chain’s mainnet launch. Competition from other launchpads caused a sharp but temporary sell-off in early August; Pons later reclaimed leadership, and the token recovered strongly.
Complete Price Picture: From Launch to Today
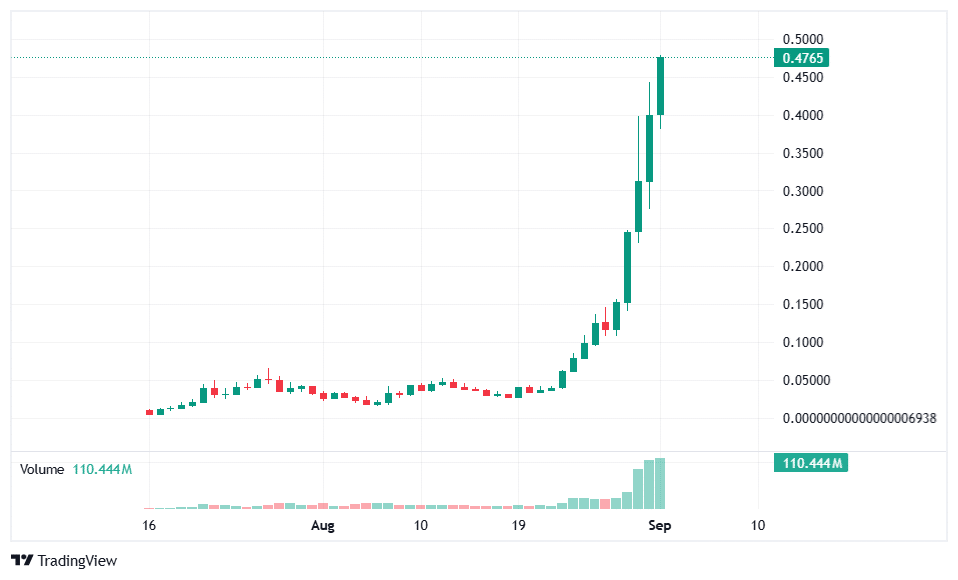
PONS began trading around July 15, 2026. Its all-time low arrived almost immediately: approximately $0.0033–$0.0035 on July 16–17.
Early enthusiasm around Robinhood Chain and the launchpad’s rapid traction pushed the price to an initial peak near $0.066 on July 27.
A competing launchpad (including Uniswap’s own offering) briefly captured market share in early August, sending PONS down more than 75% to the $0.016–$0.020 area.
The token then traded in a $0.02–$0.05 range through mid-August while the platform continued to post strong usage metrics and burns.
A new leg higher began in late August. Price closed August 24 near $0.078, climbed through $0.12 around the KuCoin listing on August 27, reached $0.245 on August 29, and closed August 30 near $0.31 after hitting $0.398.
On August 31, 2026, PONS recorded a new all-time high of $0.4438. As of September 1, 2026, it trades around $0.38–$0.39, with a market cap of roughly $270–276 million and 24-hour volume frequently exceeding $100 million. From the all-time low, this represents a gain of more than 11,000%.
The move has been volatile, typical of a young launchpad token on a new chain. Gains have been supported by measurable on-chain activity and a shrinking supply rather than pure narrative.
Pons (PONS) tokenomics
PONS center on a usage-driven flywheel rather than staking, governance voting, or traditional emissions. PONS is the protocol token of the Pons launchpad on Robinhood Chain. Its value is designed to accrue from launchpad activity through fee collection, automated buybacks, and permanent burns. The model is simple in structure but depends entirely on sustained trading volume of user-launched tokens.
Supply Structure
PONS has a hard-capped maximum supply of 1 billion tokens. There is no ongoing inflation or emission schedule. Circulating supply is lower than the cap because protocol buybacks send purchased tokens to a burn address.
As of late August 2026, roughly 29% of the original supply (about 290 million tokens) had been burned, leaving an effective circulating/total supply in the 709–712 million range. Sources describe the PONS launch itself as occurring in the public market shortly after Robinhood Chain mainnet, with limited evidence of large off-chain team or insider allocations held back from the start. Fee mechanics for individual launched tokens are snapshotted at creation and cannot be changed later.
How Revenue Is Generated
Two main fee sources exist:
A 0.0005 ETH launch fee when a creator deploys a token.
A 1% trading fee on every swap in the token’s pool (charged on both the launched token and WETH sides in the relevant versions).
Launched tokens themselves have a fixed 1 billion supply each. V1 launched tokens directly into locked Uniswap V3 WETH pools. V2 uses an ETH-denominated bonding curve that graduates into a permanently locked Uniswap V4 pool (via a custom hook) once a liquidity threshold around 4.2 ETH is reached. Liquidity is locked automatically; there is no later migration or withdrawal function for that LP.
Fee Split Mechanics
The 1% trading fee is split between the token creator and the Pons protocol. The split is recorded at launch and stays fixed for that token forever:
Current factory tokens (from a later block height): 70% creator / 30% protocol.
Creators receive their share in wrapped ETH rather than in their own launched token. This reduces immediate sell pressure on the new token because creators do not have to dump it to realize earnings. Unclaimed creator fees can be routed automatically. The protocol’s share is the portion that funds PONS tokenomics.
Protocol Buyback and Burn
Of the protocol’s fee share, 80% is allocated to buying PONS on the open market through an automated time-weighted average price (TWAP) process. The purchased PONS is sent to a burn address and permanently removed from supply. The remaining 20% covers infrastructure and team costs.
This is the core value-accrual loop: Platform activity (launches + trading volume) → protocol fees → TWAP purchases of PONS → burn → reduced circulating supply.
The buyback is not yet immutable. The team has stated it is intended to become fully decentralized and automated in a future release. Until then, the 80/20 policy and execution remain under current operational control. Burn-adjusted market cap is sometimes referenced as price multiplied by (total supply minus burned supply).
Optional Creator-Level Buybacks
Separate from protocol-level PONS burns, a creator can optionally divert part of their own fee share to buy back their launched token. Those tokens are not burned. They go into a shared vesting vault and are released linearly over five years, split according to the launch’s recorded fee shares. Vesting uses a weighted clock so later deposits do not accelerate earlier ones.
This feature is optional, comes only from the creator’s portion, and can fail (reverting funds) if liquidity or price impact is too high. It is designed to avoid sudden dumps of accumulated tokens.
The Flywheel and Its Limits
In theory the design is clean: more successful launches and higher volume produce more fees, which buy and destroy PONS, tightening supply while the token remains tied to the leading launchpad on a growing L2. Creators are paid in ETH, liquidity is locked, and a large share of protocol revenue is programmatically returned to PONS holders via burns.
In practice the model has several constraints. It is volume-dependent; if launch activity or trading on Robinhood Chain slows, fee revenue and buybacks decline.
Most tokens launched on any such pad go to zero, so protocol revenue is concentrated in the minority that attract real volume. The 80% buyback allocation is not yet locked in code as immutable policy. Competition from other launchpads on the same chain has already caused sharp price drawdowns.
PONS itself currently functions mainly as a value-accrual and burn token rather than a governance or utility token with additional on-chain uses (staking, fee discounts, or voting appear limited or future-oriented in available descriptions).
The tokenomics are therefore best understood as a high-beta claim on Pons launchpad usage, with an explicit deflationary overlay, rather than a self-contained monetary system. Performance tracks whether the platform keeps generating meaningful fee flow after the initial Robinhood Chain hype cycle.
Investors should still treat PONS as high-risk: launchpad tokens can lose value quickly if usage slows, competition intensifies, or broader crypto markets turn lower.
Always verify contract addresses (the canonical PONS contract on Robinhood Chain is 0x39dBED3a2bd333467115dE45665cC57F813C4571) and never invest more than you can afford to lose.
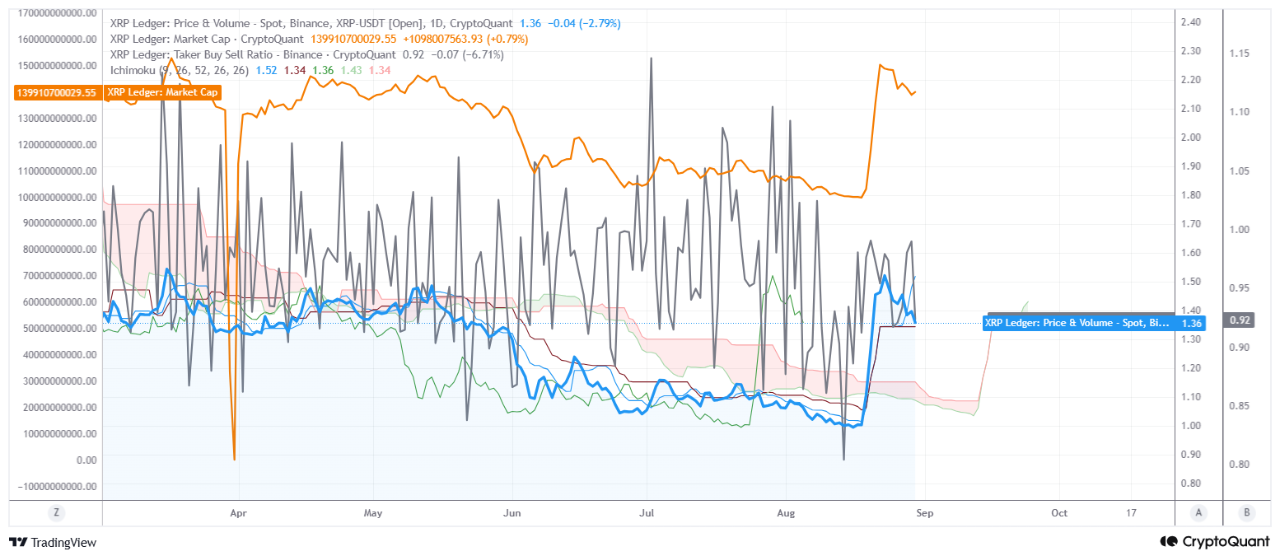
While XRP has recovered from the $1.02 area where it traded for some time, new derivatives data suggests that buyers have not yet entered full FOMO mode.
XRP recently climbed from around $1.00 to nearly $1.70 before pulling back to the current price of $1.36. However, the Binance Taker Buy/Sell Ratio currently stands at 0.92, showing that sellers remain more active than buyers in the derivatives market.
With the ratio still below 1 while XRP’s price rises, the data suggests that the recovery has yet to receive strong buying support from derivatives traders.
XRP Derivatives Data | Source: CryptoQuant
In simple terms, XRP has gained ground, but buyers have not taken full control of the market. Profit-taking and short-term selling may still be affecting price action following the previous rally.
XRP’s market capitalization shows a similar pattern. It immediately rose from around $63 billion to nearly $107 billion by Aug. 22 before falling back to about $85.2 billion.
The decline in market capitalization does not necessarily signal a major problem, as XRP remains well above its previous low. However, the failure to set a new high after reaching around $1.69 suggests that the rally has lost some momentum.
XRP Approaches an Important Price Zone
XRP currently trades around $1.36 and is approaching a key area within the Ichimoku structure. This makes the $1.35-$1.40 range an important short-term decision zone.
If the Taker Buy/Sell Ratio moves above 1, it would provide evidence that buyers are gaining control and that the recovery could continue.
Past XRP price recoveries have often coincided with rising Taker Buy/Sell Ratios, while readings that remain below 1 have pointed to continued selling pressure. Based on the chart, the risk of sideways or slightly lower price action remains higher in the short term unless buying pressure picks up.
XRP Derivatives Activity Raises Leverage Concerns
At the current price, XRP’s futures open interest stands at $2.52 billion and 24-hour derivatives volume reaches $2.24 billion. Spot volume, by comparison, sits at just $386 million.
The large difference between derivatives and spot activity suggests that derivatives trading played a major role in the recent rally, instead of the move coming mainly from spot buying.
Leverage has also increased. The estimated leverage ratio climbed to 0.193, close to the six-month high of 0.213. Funding rates have averaged 0.006, which remains above the quarterly baseline.
This buildup in leverage later saw an unwind. Long liquidations reached $25.7 million on Aug. 22, marking the largest single-day total over the past six months. Funding rates have since fallen from 0.010 to 0.002, while open interest has dropped 13% from its peak.
These changes show that traders have reduced some of the leverage built up during the recovery. The market now appears to be going through a period of deleveraging instead of showing signs of heavy FOMO.
XRP Exchange Flows
Meanwhile, on-chain exchange flows show a more positive sign. Binance deposit addresses have fallen to just 45, a 91% decline from the quarterly baseline. At the same time, average XRP outflows have reached 298,660 XRP, compared with average inflows of only 136,319 XRP.
The higher outflows suggest that XRP exchange supply is tightening even as the price pulls back. If this trend continues and spot demand increases, the lower exchange supply could provide support for the next move.
Cryptocurrency projects have spent about $638 million repurchasing their own tokens so far in 2026, with decentralized exchange Hyperliquid and memecoin platform Pump.fun accounting for nearly 90% of the total, according to Allium Labs data cited by the Financial Times.
The total has already surpassed the $545 million recorded during the same period in 2025 and is sharply higher than the $366,000 reported in 2024.
Hyperliquid accounted for roughly $370 million of this year’s token purchases, while Pump.fun contributed nearly $200 million.
Token buybacks use project or protocol funds to purchase native tokens from the market. The mechanism is broadly similar to corporate share buybacks, though token holders do not necessarily have the same rights as shareholders.
Crypto projects’ year-to-date spending on token buybacks through Aug. 25
Hyperliquid and Pump.fun Channel Revenue Into Buybacks
Hyperliquid directs about 99% of its revenue toward HYPE repurchases. The decentralized exchange reported $169 million in second-quarter revenue on Aug. 6, of which $141 million was allocated to buying back HYPE.
Pump.fun, meanwhile, uses about half of its net protocol revenue to repurchase PUMP. Based on average daily revenue over the preceding 90 days, the platform had about $420 million in annualized revenue.
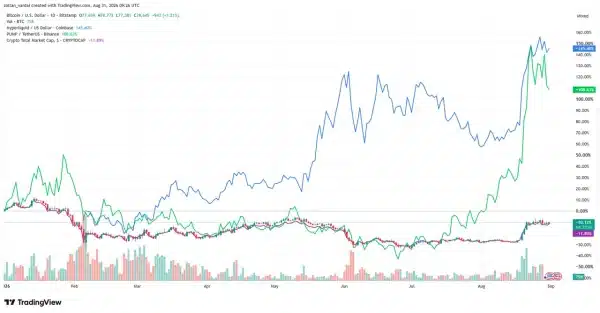
Both tokens have outperformed the broader cryptocurrency market this year. For context, HYPE had gained 145% and PUMP 109% year-to-date, according to TradingView data. Over the same period, Bitcoin was down 10%, while total cryptocurrency market capitalization had declined 11.9%.
Year-to-Date Performance of HYPE, PUMP, Bitcoin and the Total Crypto Market Cap
Revenue-Funded Buybacks Expand Beyond HYPE and PUMP
Other crypto projects are also considering mechanisms that direct revenue toward their native tokens.
On Aug. 27, the Ethena Foundation opened a governance vote on a fee-switch proposal that would use 95% of net revenue paid to the foundation from Ethena’s core business lines to repurchase ENA tokens.
ENA rose 10.7% on the day after the proposal.
Bitwise Chief Investment Officer Matt Hougan said earlier in August that crypto valuations could double over the next two years as protocols increasingly use revenue to fund token buybacks and burns, returning more value to investors.
According to recent on-chain data, the XRP Sharpe Ratio on Binance, the world’s largest crypto exchange, has risen to a 1-year peak.
While XRP has pulled back from the $1.69 three-month high it reached during the rally two weeks ago, on-chain data shows that its risk-adjusted performance has improved.
XRP Sharpe Ratio Hits 1-Year Peak
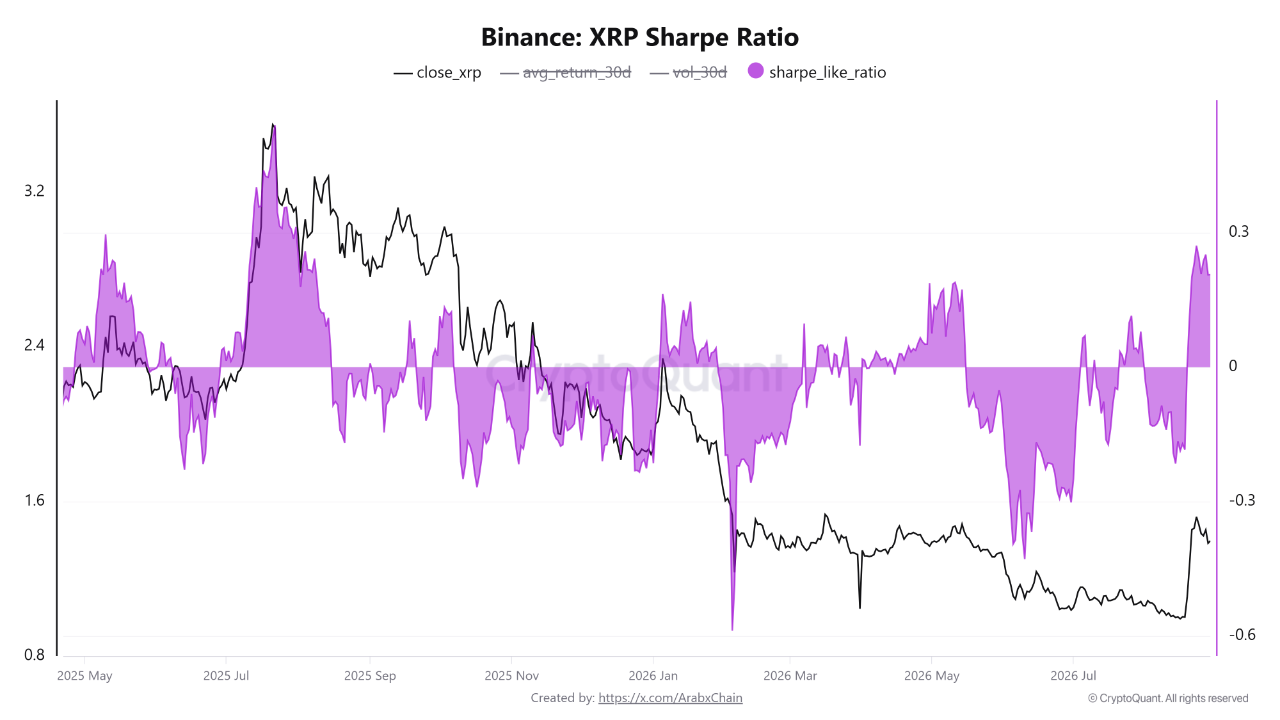
The XRP Sharpe Ratio on Binance has risen to around 0.207, its highest level since August 2025 and a one-year peak for the indicator.
The rise came as XRP’s price recovered to around $1.40, suggesting that the recent price gains also improved returns compared with the level of risk and volatility involved.
Notably, for much of the period since August 2025, XRP’s Sharpe Ratio stayed around negative or neutral levels, with the indicator falling notably during XRP’s broader decline.
XRP Sharpe Ratio | Source: CryptoQuant
The latest increase shows a change in the relationship between XRP’s returns and volatility. Compared with most of the period since August 2025, investors now see better returns relative to the level of risk associated with XRP.
XRP Sharpe Ratio Surge Comes Along Price Spike
For context, the XRP Sharpe Ratio indicator rose as XRP’s price improved, showing that the recent rally involved more than a simple increase in value. Essentially, XRP also saw better risk-adjusted returns during the move.
Still, a high Sharpe Ratio does not confirm that XRP will continue rising. The indicator could also fall if volatility increases or XRP suffers another sharp correction.
XRP’s latest price action also shows why caution remains necessary. Currently, XRP trades at around $1.35, down 3% over the past 24 hours and 10.20% in the last seven days.
XRP Faces Support After Rejection at $1.50-$1.55
The latest decline followed XRP’s rejection from the $1.50-$1.55 resistance zone. After briefly reaching $1.69 during the August rally, XRP has started to retrace toward the $1.30 support level. A break below $1.30 could trigger stop-loss selling and potentially push the price toward the $1.25 downside target.
The pullback also follows the rally that pushed the 14-day RSI to 85.41, putting the indicator in extreme overbought territory. Meanwhile, the 38.2% Fibonacci retracement from the August surge sits at $1.42, while the 50% retracement at $1.34 now provides another important support level.
These levels give bulls several areas to defend during the correction. The $1.42 level remains just above XRP’s current price, while $1.34 sits close to the current market level. If sellers push XRP below these areas, attention could shift toward the $1.30 support and eventually the $1.25 target.
Spot Selling Adds Pressure to XRP
Market data also points to strong selling pressure. Spot distribution is currently overwhelming bid-side liquidity, while net sell-side volume remains elevated across major exchanges as traders take profits around key technical levels.
This selling pressure creates an important test for XRP’s improving Sharpe Ratio. Although the indicator points to better risk-adjusted returns, continued spot selling and higher volatility could weaken the improvement. XRP will need stronger buying demand to support its recovery and prevent the current pullback from becoming deeper.
XRP spot ETFs, however, continue to provide a source of demand. XRP spot ETFs recorded $110.49 million in weekly net inflows through Aug. 28, their strongest week of 2026. Those inflows also pushed cumulative ETF inflows to $1.66 billion.
For the short-term outlook to improve, bulls need XRP to reclaim $1.42. Holding the $1.34 50% Fibonacci retracement and the $1.30 support could also help the price stabilize. A break below $1.30, however, could open the way toward the $1.25 target.
Real Trump Coins said it had no role in launching, promoting, or authorizing Trump Digital GOLD, distancing itself from the Solana-based token after it appeared across its online presence and subsequently collapsed.
In an X post on Saturday, Real Trump Coins attributed the promotion to “third-party bad actors” and said authorities were involved as it worked to determine what had happened.
Lookonchain Flags Concentrated GOLD Holdings
Blockchain analytics platform Lookonchain reported that, before the sell-off, 82.45% of GOLD’s total supply was held across the developer wallet and newly created addresses.
The firm also said 15 of those wallets, which it identified as being associated with the team, subsequently offloaded their tokens for about $330,000, booking an estimated profit of $312,000.
Meanwhile, questions over the token’s promotion centered on its appearance across multiple Real Trump Coins online platforms. For context, on Saturday, GOLD appeared in promotional posts on the company’s X account, which pointed users to RealTrumpCoins.com. The website also featured the token. However, the X posts were later deleted.
Crypto observer Rune subsequently questioned how both the X account and the domain could have been compromised.
David Gokhshtein has doubled down on his bullish outlook for Cardano, hinting that he could buy more ADA despite criticism from some members of the crypto community.
The host of The Breakdown podcast made the comment after an X user advised him to stay away from Cardano and XRP. Instead of accepting the warning, Gokhshtein replied briefly, “I’ll buy more — thanks.”
Although his response does not confirm that he immediately purchased additional ADA, it shows that the criticism has not changed his view of Cardano.
Gokhshtein Maintains Bullish Cardano Outlook
Gokhshtein’s latest comment came amid a broader debate about Cardano’s ability to recover its previous all-time high.
For context, Cardano reached an all-time high of $3.10 on September 2, 2021. However, ADA has since suffered a significant decline and currently trades around $0.1966. At this price, ADA remains 93.66% below its previous peak.
Consequently, the wide gap has fueled debate over whether Cardano can return to $3.10 during another strong market cycle. Nevertheless, Gokhshtein’s latest response suggests that investors should not automatically dismiss that possibility simply because ADA remains far below its 2021 peak.
Gokhshtein has previously maintained a bullish stance on Cardano. He also argued that the continued attention surrounding ADA shows that the project should not be prematurely written off.
While Gokhshtein has publicly confirmed that he owns ADA and has repeatedly expressed optimism about Cardano, he has not disclosed the exact size of his holdings. Therefore, his latest comment should not be interpreted as confirmation that he has made a specific purchase or increased his position by any particular amount.
Can ADA Reclaim $3.10?
Gokhshtein’s comments have also reignited speculation about whether ADA can eventually reclaim its previous all-time high.
Popular Cardano stake pool operator Sssebi has suggested that ADA could revisit $3.10 and potentially surpass that level during the next major bull market. According to Sssebi, ADA would need to rise roughly 15.8 times from its current price of $0.1962 to return to $3.10.
However, that scenario remains a market projection rather than a certainty. To reclaim $3.10, ADA would likely need to attract substantial new demand while benefiting from stronger broader market conditions and continued growth across the Cardano ecosystem.