Ripple former CTO David Schwartz is facing criticism from XRP holders after giving a brief update on the cryptocurrency’s price.
The discussion started when Schwartz shared details about his hub’s network performance on X. He said it had over 550 active peer connections, with an average response time of about 200 milliseconds and roughly 110,000 incoming messages per second.
However, the conversation shifted to XRP’s price when an X user, J (@thefitappa), asked for an update. Schwartz replied that XRP was trading at around $1.308, up 2.4% over the previous 24 hours.
Sure. It's around $1.308 or so, up 2.4% in the past 24 hours.
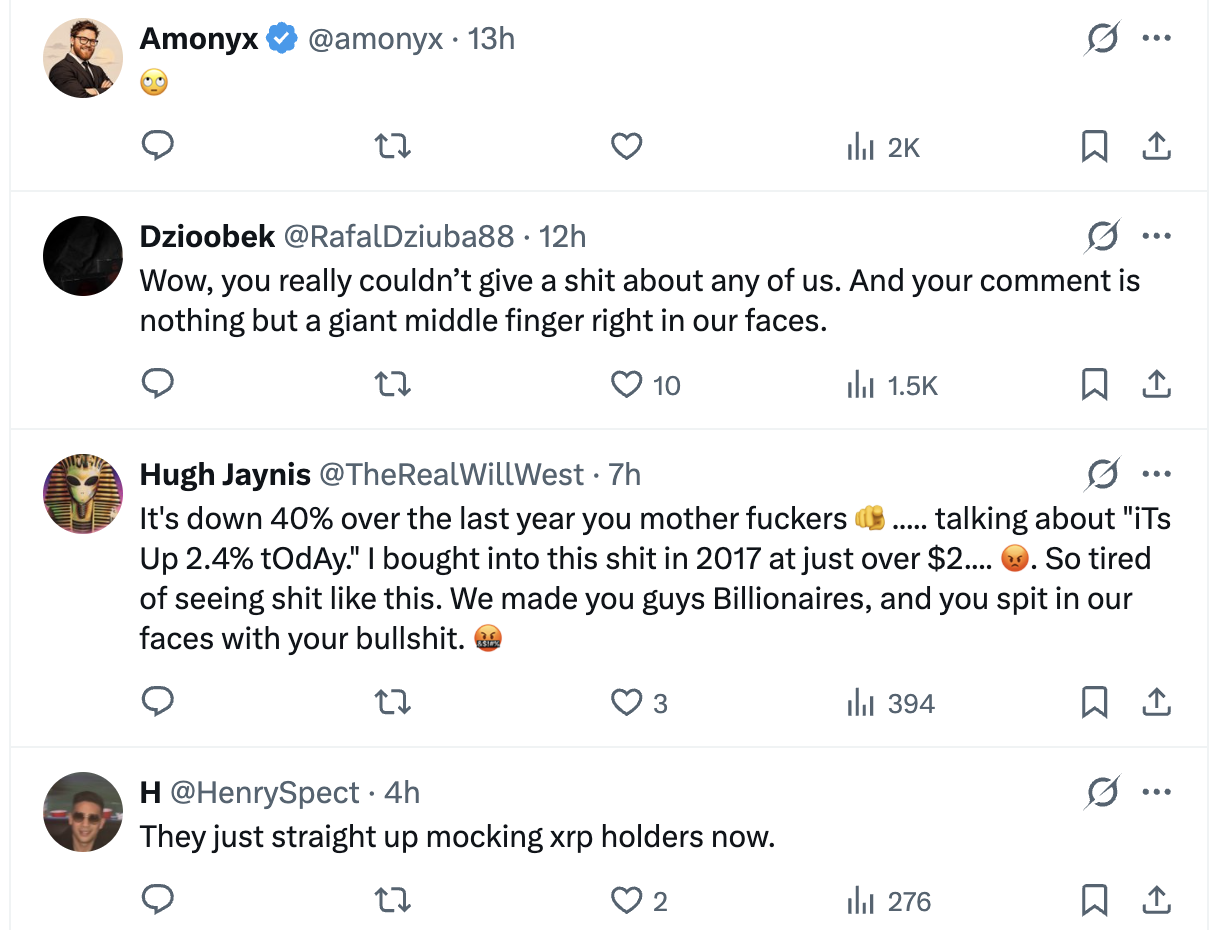
Although Schwartz answered the question about XRP’s price, several holders criticized him because they were unhappy with the asset’s overall performance. Some users joked about his response, while others felt he was making fun of XRP investors.
One user, Dzioobek (@RafalDziuba88), accused Schwartz of ignoring investors’ concerns and said his response was disrespectful.
Another user, Hugh Jaynis (@TheRealWillWest), pointed out that XRP had fallen 40% over the past year. He questioned why Schwartz was highlighting a 2.4% daily gain when the bigger picture remained disappointing.
He also revealed that he bought XRP in 2017 at just above $2, saying early investors had supported Ripple but had not seen the price growth they expected.
Critical Comments from XRP Holders
Meanwhile, Henry Spect (@HenrySpect) suggested that Ripple executives were now mocking XRP holders. Crypto Alan (@crytpoalan) also criticized Schwartz’s response, arguing it might have been funny years ago but wasn’t appropriate given XRP’s current performance.
Other users questioned why XRP’s price had failed to improve significantly despite upgrades and progress in its network.
Not All XRP Holders Were Critical
Despite the criticism, some XRP holders see the asset’s low price as a buying opportunity. Jason Barritt (@JasonBarritt) said investors still have time to buy XRP before a possible price increase.
He explained that he buys XRP with every paycheck and plans to keep holding his tokens while waiting for the Internet of Value (IoV) ecosystem to grow.
Barritt believes investors may need to wait another two to three years before seeing the price gains they expect. He also said he would rather buy XRP at around $1.30 than wait until it reaches $5. He believes investors could look back at today’s price in 2030 and wish they had bought more.
People can still accumulate for cheap. Put in your head that you have 2- 3 years for a real price jump. I buy every paycheck what I can and forget about it. I'm glad it's still low until the IoV is ready to go. I don't think I would be purchasing more if it was $5+. In 2030…
These different reactions show that the XRP community remains divided. While some holders are frustrated that Ripple’s technological progress has not led to better price performance, others remain confident and continue buying XRP.
Crypto technical analyst Waleed Ahmed believes Cardano presents a potential opportunity at its current price levels.
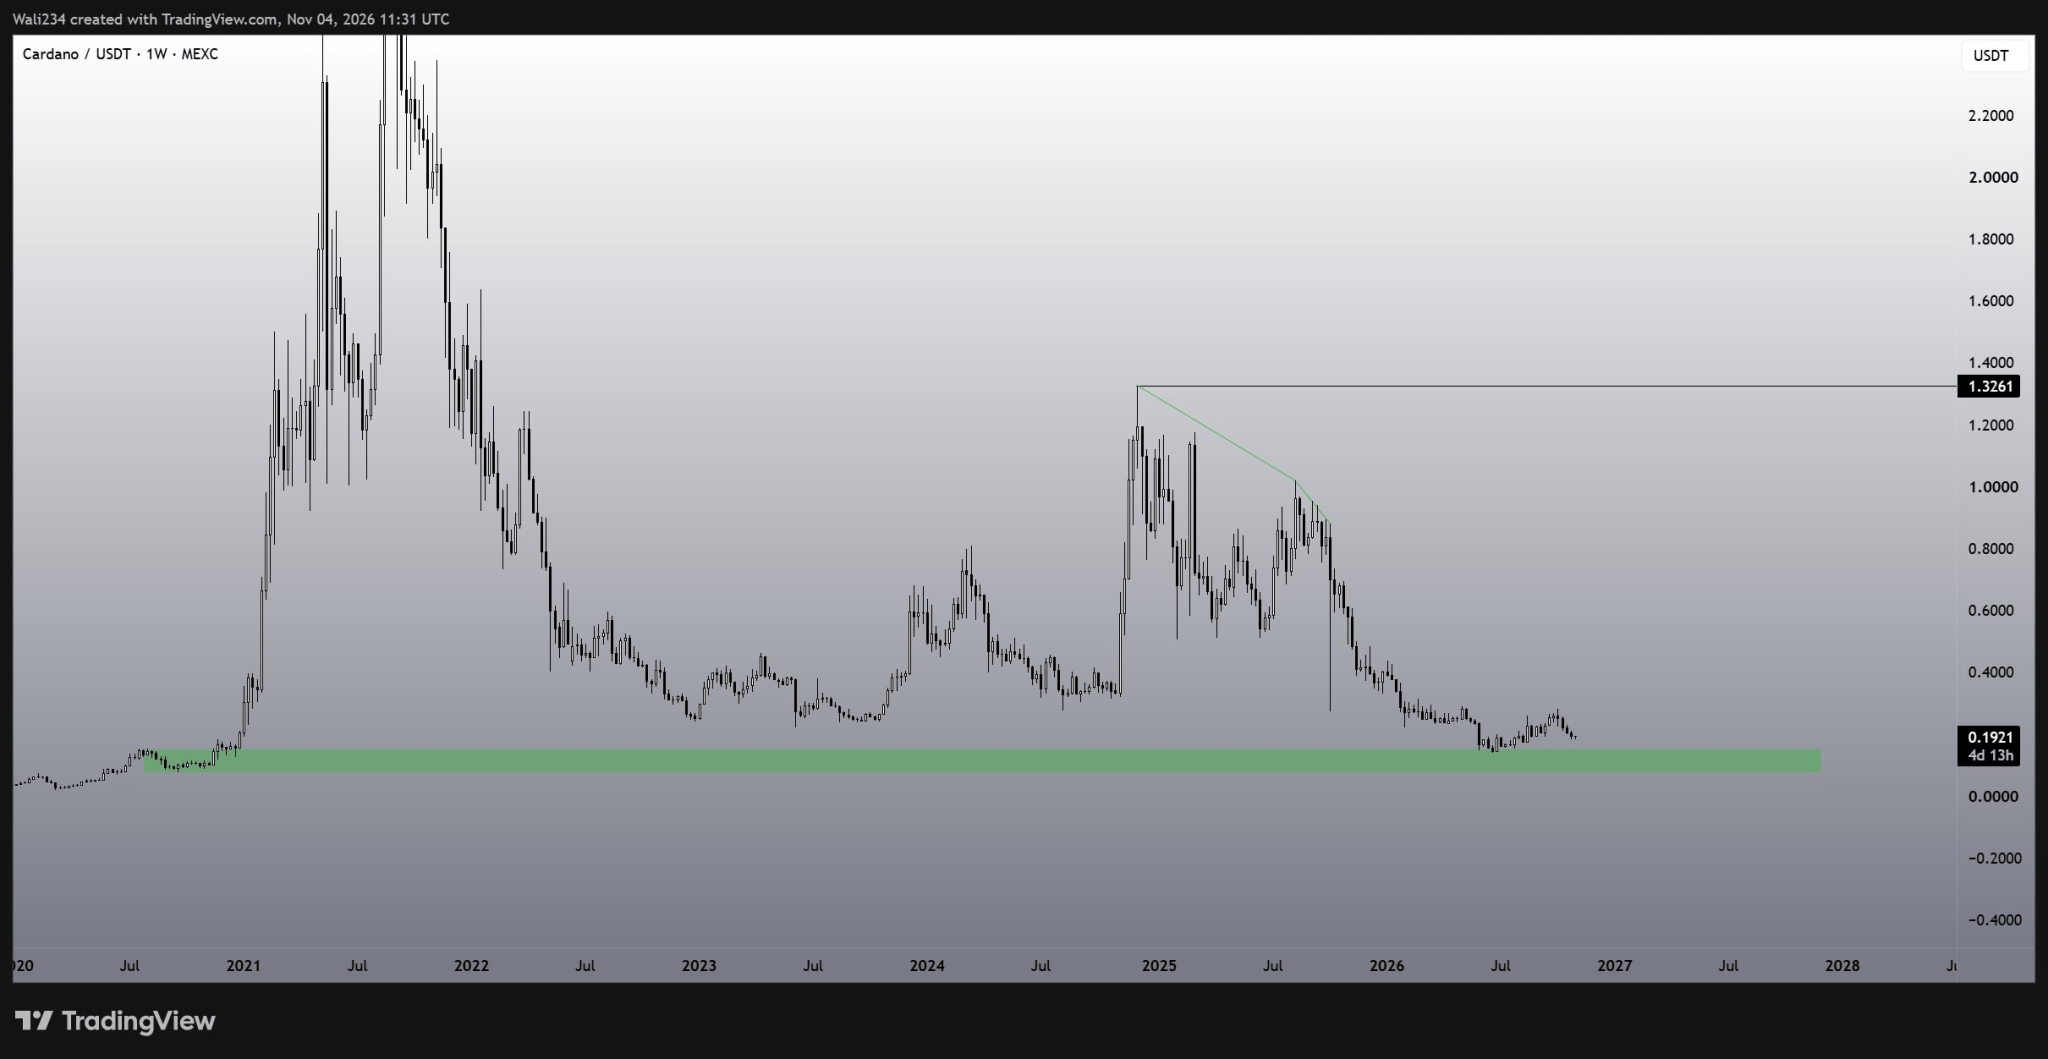
In a recent post on X, Ahmed shared a TradingView chart showing Cardano’s weekly price performance and stated that he sees only opportunity in the cryptocurrency. His commentary suggests that he considers ADA’s position near $0.19 an attractive entry point, particularly given its historical rebounds from this support region.
Cardano’s Historical Reactions to $0.19 Support
Ahmed’s chart highlights several occasions when Cardano rebounded from the $0.19 region before staging substantial rallies. Notably, ADA recovered from this level in September 2021 and subsequently embarked on a remarkable rally that eventually pushed it to its ATH of $3.10.
The chart also identifies subsequent recoveries from the same support region, including one in the second half of 2026. Following that rebound, ADA climbed to $0.28 early last month before reversing course and declining toward $0.19.
At press time, Cardano traded at $0.1973, placing it close to the historical support highlighted by Ahmed. Based on this chart, the analyst projects a potential recovery toward $1.3261 if ADA successfully defends the support level.
From its current price of $0.1973, Cardano would need to rally 572% to reach that target. Interestingly, the last time ADA traded around this price region was in December 2024, before its post-election rally pushed it above $1.30.
Waleed Cardano Chart
Analysts Offer Mixed Predictions for Cardano’s Recovery
Meanwhile, Ahmed’s bullish outlook comes amid mixed predictions about Cardano’s recovery prospects.
Earlier this week, analyst 360Trader identified similarities between ADA’s current market structure and its 2021 performance. Based on these similarities, he suggested that the cryptocurrency could replicate its previous rally of approximately 2,000%.
However, 360Trader identified $0.25 as a crucial resistance level that Cardano must reclaim to strengthen this bullish outlook. A sustained recovery above that threshold could eventually open the way toward $1.37.
Conversely, analyst ZenTrades warned that Cardano could experience further losses. After ADA dropped 21% last month, the analyst projected a potential drop toward $0.15, suggesting that the cryptocurrency’s recent weakness could continue.
Descending Wedge Breakout Could Trigger ADA Recovery
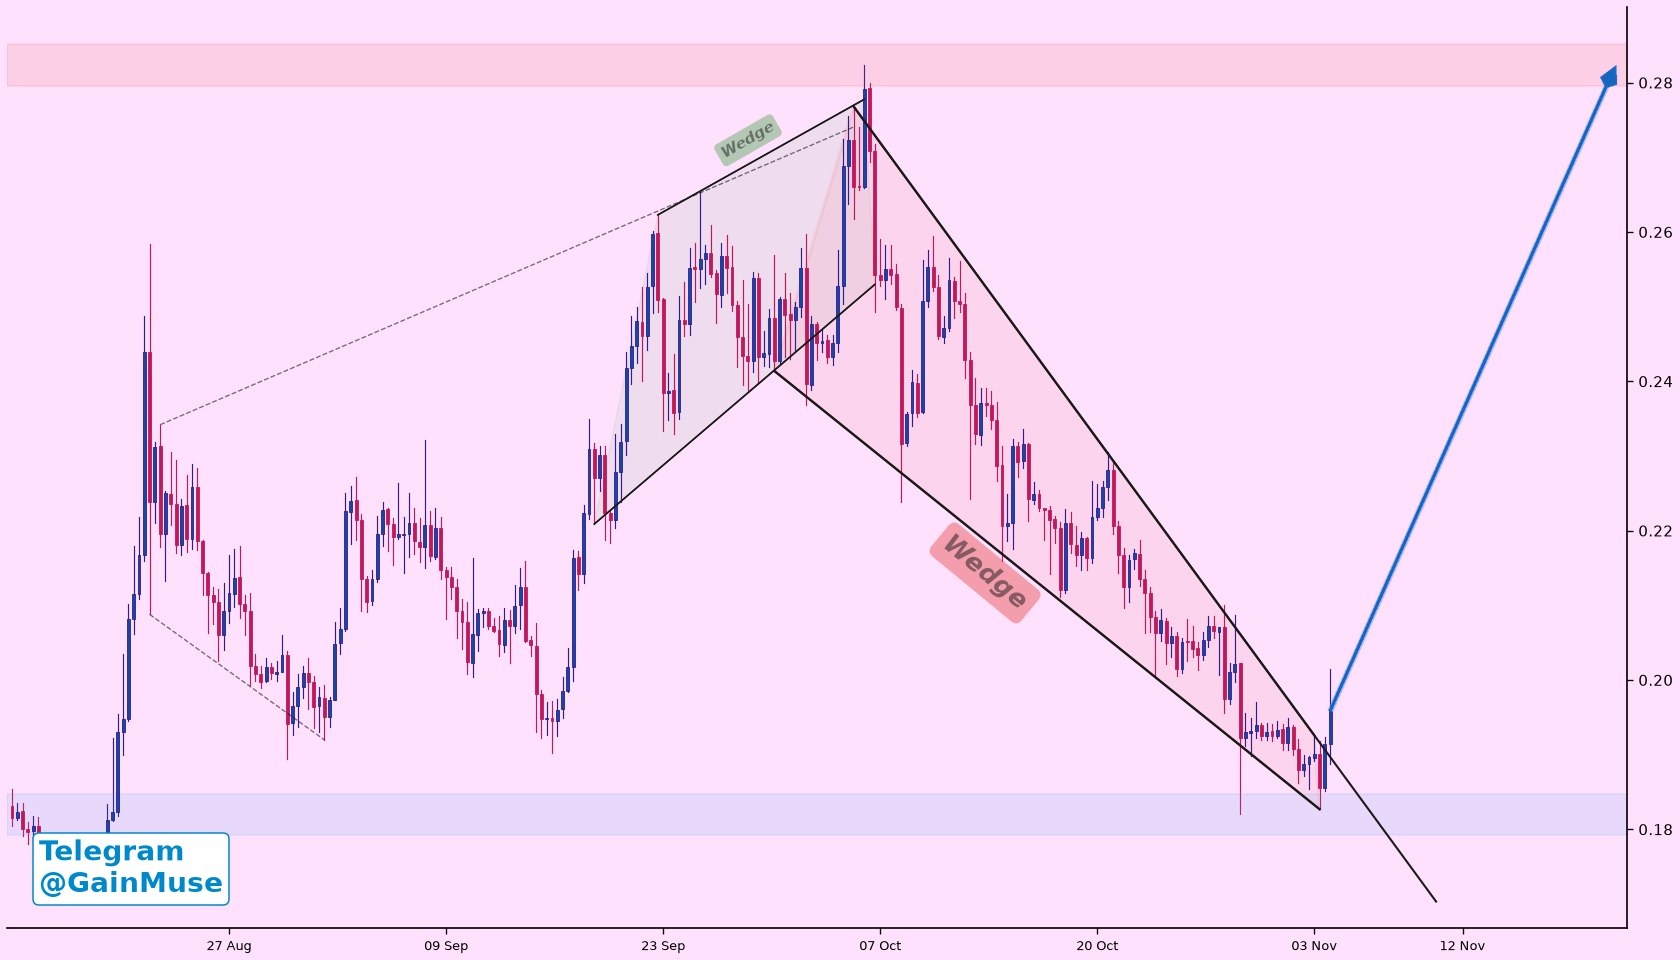
Meanwhile, analyst GainMuse believes Cardano could be approaching a bullish breakout from a descending wedge pattern. ADA has consolidated downward within this formation since falling from $0.28 in early October.
However, the cryptocurrency recently rebounded from support at $0.1926 and is now testing the wedge’s upper trendline near $0.20.
According to GainMuse, a breakout above $0.2076 could open the way toward $0.28. Nevertheless, the analyst emphasized that ADA must confirm the breakout with an eight-hour candle close above the resistance trendline, followed by a successful retest.
Otherwise, Cardano could fall back into the wedge and resume its downward trajectory.
Litecoin’s official X account has reignited its long-running social media feud with XRP, drawing fresh criticism from XRP supporters more than a year after an earlier clash between the two communities.
In its latest post, Litecoin shared a surprised reaction clip with the caption:
“Me finding out I can’t use the word retarded for XRP anymore.”
The Nov. 5 post quickly drew pushback from XRP supporters, with critics questioning why Litecoin continues targeting XRP while LTC itself has struggled to regain its former market position.
XRP Community Pushes Back at Litecoin
One response argued that Litecoin has underperformed other established crypto assets for years and pointed specifically to Zcash’s recent performance.
That comparison has some market context. ZEC has gained roughly 138% in 2026, while Litecoin is down around 30% year-to-date, according to comparative market data. Over the past five years, Litecoin has also delivered substantially weaker annualized returns than XRP.
Another XRP supporter responded more bluntly by asking whether anyone had used Litecoin in the past decade.
That comment is clearly rhetorical rather than an accurate description of Litecoin network activity. Litecoin remains actively used. BitInfoCharts recorded roughly 154,000 transactions and more than 218,000 active addresses over the latest 24-hour period, while the Litecoin Foundation says the network has now processed more than 418 million lifetime transactions.
The latest post continues a pattern that became particularly visible in August 2025.
At the time, Litecoin’s official account mocked XRP’s banking narrative by comparing expectations around the asset to the unpleasant smell of a comet. It also ridiculed claims that XRP could play a major role alongside or instead of SWIFT and referred to Ripple CEO Brad Garlinghouse as “Brad Garlicmouse.”
The episode triggered a sharp response from the XRP Army, with some users accusing Litecoin of seeking attention through attacks on a larger rival community.
Litecoin later defended the posts as part of a broader series of crypto roasts, noting that it had also mocked Solana and even itself. The account complained that its XRP jokes generated considerably stronger backlash, including alleged legal threats.
Litecoin and XRP Remain Far Apart in Market Position
The renewed exchange comes while both assets remain well below their historical highs.
Litecoin trades around $56, roughly 86% below its 2021 record, while XRP is near $1.30 after falling about 29% in 2026.
The price comparison does not determine which network has greater utility, but it explains why Litecoin’s latest attempt to mock XRP has again produced criticism focused on LTC’s own market performance.
For now, the episode looks less like a new technical dispute and more like the continuation of an established social-media rivalry between two of crypto’s oldest communities.
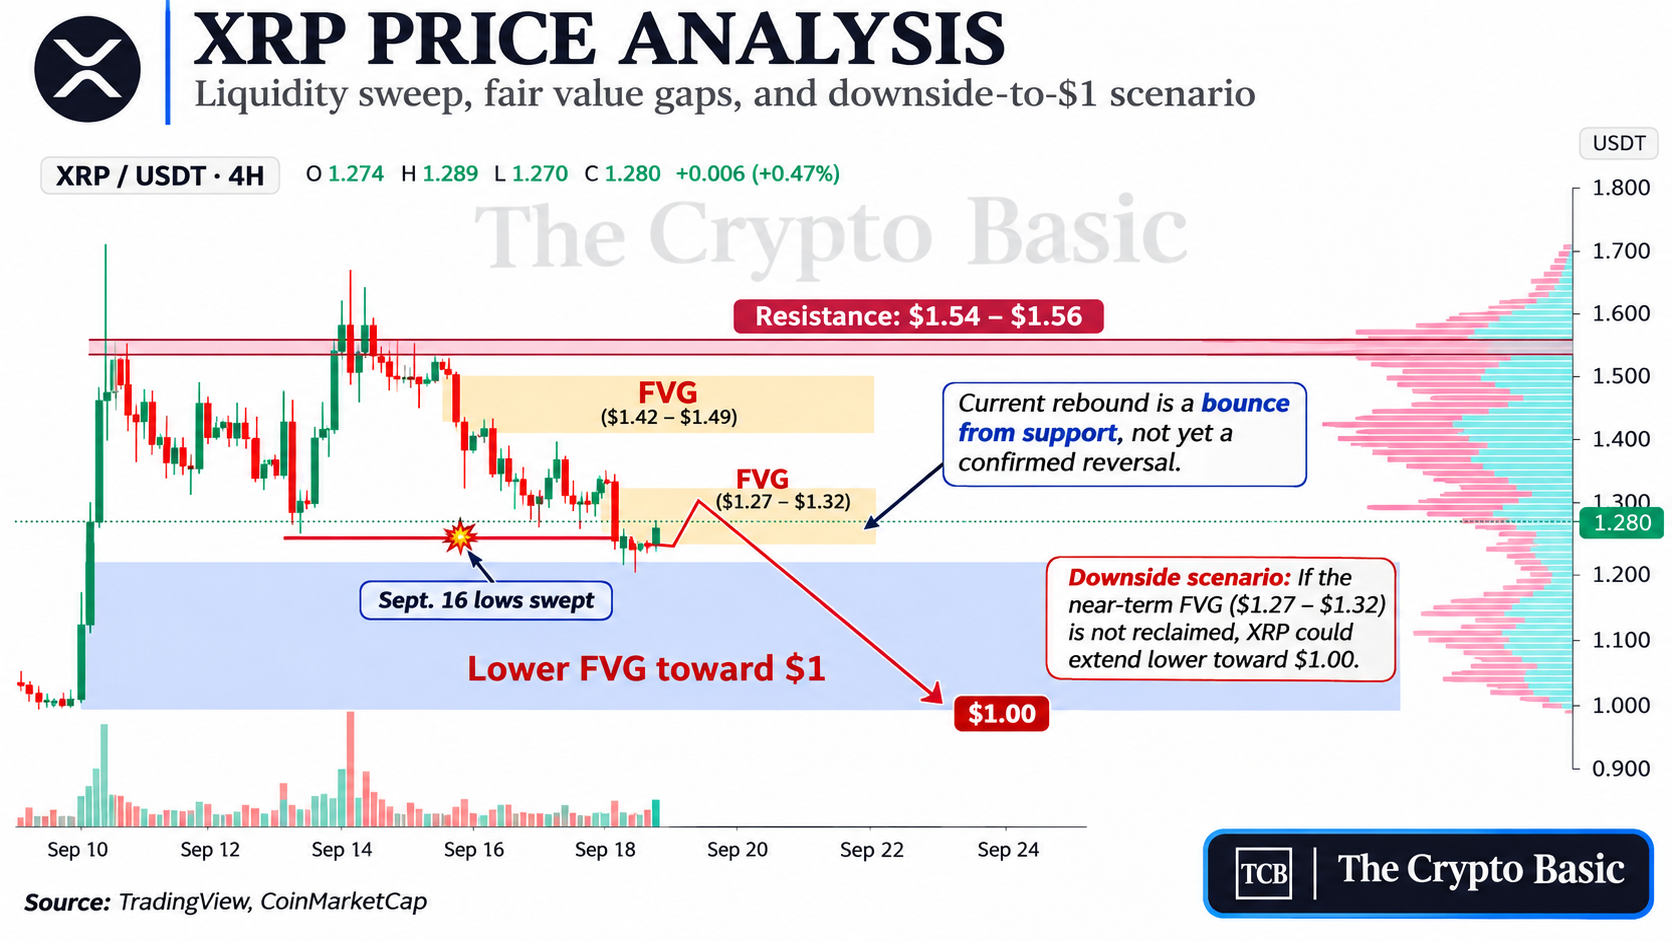
XRP has swept the Sept. 16 lows and rebounded from a key fair value gap, but the broader structure still leaves room for another decline toward the $1 region if buyers fail to reclaim lost resistance.
XRP currently trades around $1.28, recovering from the latest test of the lower $1.20s. The bounce comes after price pushed beneath the previous September low, taking out liquidity that had remained untouched for several weeks.
The sweep creates the conditions for a short-term reaction, but XRP still needs to recover higher fair value gaps before the move can be treated as a meaningful reversal.
XRP Sweeps the Sept. 16 Low
The most important development is the move beneath the horizontal low that had remained intact since Sept. 16.
In technical terms, those lows represented a pool of liquidity beneath the market. XRP briefly traded through that area before rebounding, effectively clearing the previously unswept low.
The reaction places XRP back above the lower boundary of an immediate fair value gap around the mid-$1.20s.
XRP has swept the Sept. 16 lows and rebounded from fair value gap support, while a larger unfilled imbalance extends toward the $1 region.
A fair value gap, or FVG, is an imbalance created when price moves rapidly enough that adjacent candles leave an area with relatively little two-way trading. These zones can later attract price as the market attempts to rebalance the earlier move.
XRP’s latest recovery follows another test of the broader $1.10-$1.29 support region, which has also been identified in recent technical structures as a key area for the next larger move. XRP faces a second test of key support
Current Bounce Still Needs Confirmation
The first overhead FVG sits immediately above current price, roughly around the $1.27-$1.32 region.
Reclaiming and holding this area would be the first indication that the sweep has produced more than a temporary relief move.
That level also overlaps with recent resistance. XRP previously emerged from an unusually tight volatility compression around $1.25, with $1.27 identified as the first bullish confirmation level. XRP’s recent Bollinger squeeze setup
Above that, another larger imbalance remains around approximately $1.42-$1.49.
XRP would need to recover both areas before the structure begins to resemble a sustained trend reversal rather than a bounce within the broader decline.
A larger horizontal resistance area also sits around $1.54-$1.56, where previous rallies encountered substantial selling pressure.
Lower FVG Extends Toward $1
The downside structure remains important because the largest unfilled fair value gap on the chart stretches from roughly the low-$1.20s toward the $1 psychological level.
That creates a sizeable zone beneath current price where another decline could potentially find support.
From the current price near $1.28, a move to $1 would represent a decline of approximately 21.9%.
For now, the Sept. 16 liquidity sweep has produced the reaction expected from a key support region, but XRP has not yet reclaimed enough territory to confirm a bottom.
The next observable test is whether XRP can hold above the swept lows and reclaim the $1.27-$1.32 FVG. Failure to do so would leave the lower imbalance—and potentially the $1 region—open for another test.
Bitcoin reclaims daily averages as Ethereum confirms a bullish MACD crossover. November 5 analysis covers BTC, ETH, NEAR, ENA and ZEC with key chart levels.
Asset
Latest USD price
Past 24 hours
24-hour market volume
Market-cap rank
Bitcoin (BTC)
$80,491
+5.37%
$37.37 billion
1
Ethereum (ETH)
$2,423.36
+7.91%
$16.46 billion
2
NEAR Protocol (NEAR)
$4.04
+7.91%
$742.55 million
21
Ethena (ENA)
$0.181444
+7.41%
$428.70 million
41
Zcash (ZEC)
$1,312.37
+10.79%
$1.24 billion
10
Bitcoin Reclaims Both Daily Averages After a Sharp Reversal
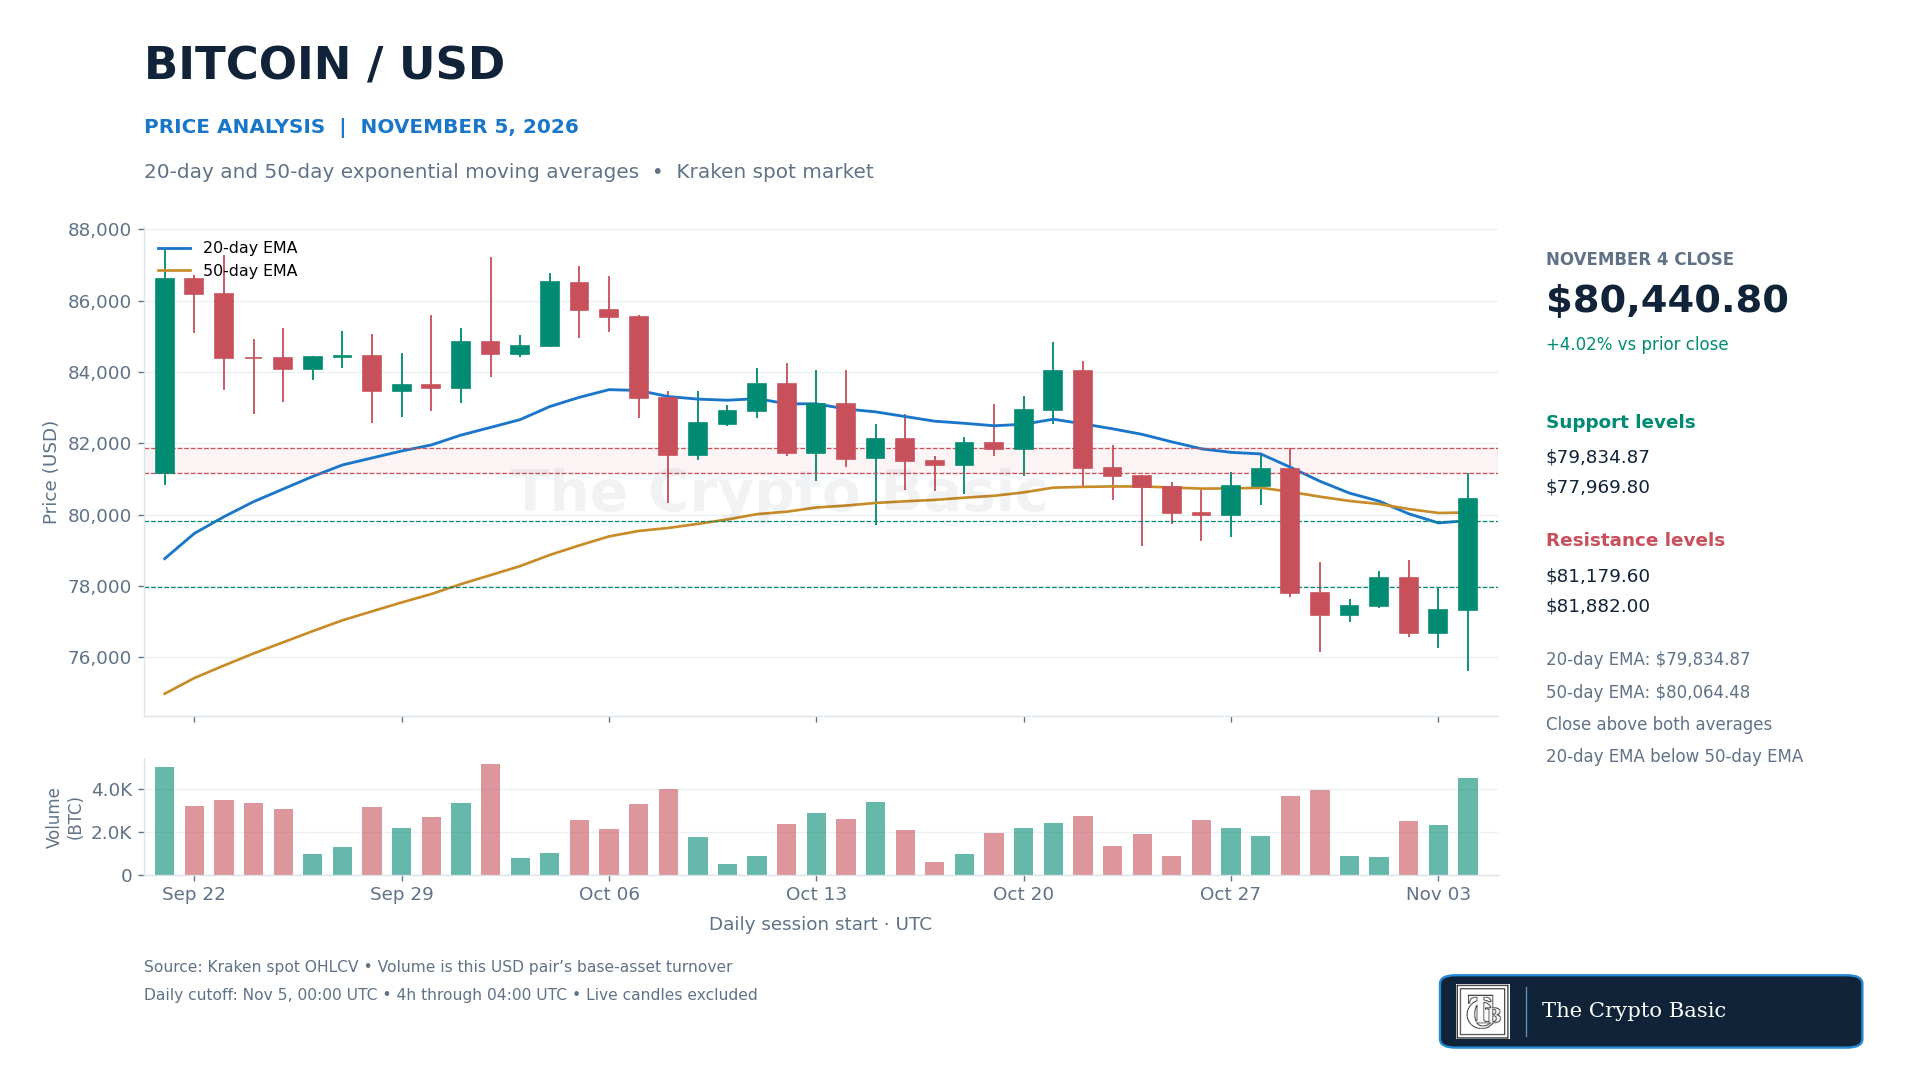
Bitcoin closed Wednesday at $80,440.80, gaining 4.02%, after trading between $75,625 and $81,179.60. It undercut October 30’s $76,155.50 low intraday but recovered above Tuesday’s $77,969.80 high at the close. The session therefore produced a strong reversal rather than a confirmed daily breakdown beneath the October low.
BTC/USD closes above its 20-day and 50-day EMAs after reversing from $75,625; $81,179.60 and $81,882 remain overhead.
That repairs the lost weekend support described in our November 3 analysis. The latest price also remained above $80,000, although Wednesday’s high had not been cleared.
The 20-day exponential moving average turned higher to $79,834.87 from $79,771.09. The 50-day EMA also rose, reaching $80,064.48. Price closed above both, but the faster average remained below the slower one. The price reclaim is confirmed; a bullish moving-average crossover is not.
The last completed four-hour candle closed at $80,469.50, maintaining the recovery above both daily averages. Holding the $79,835–$80,064 area would support another test of $81,179.60. A daily close above that high would strengthen the advance toward October 29’s $81,882 high.
Losing the averages would weaken the reclaim and expose $77,969.80. A daily close below Wednesday’s $75,625 low would invalidate the reversal and bring September 15’s $74,891.50 low back into focus.
Ethereum Confirms a Bullish Daily MACD Crossover
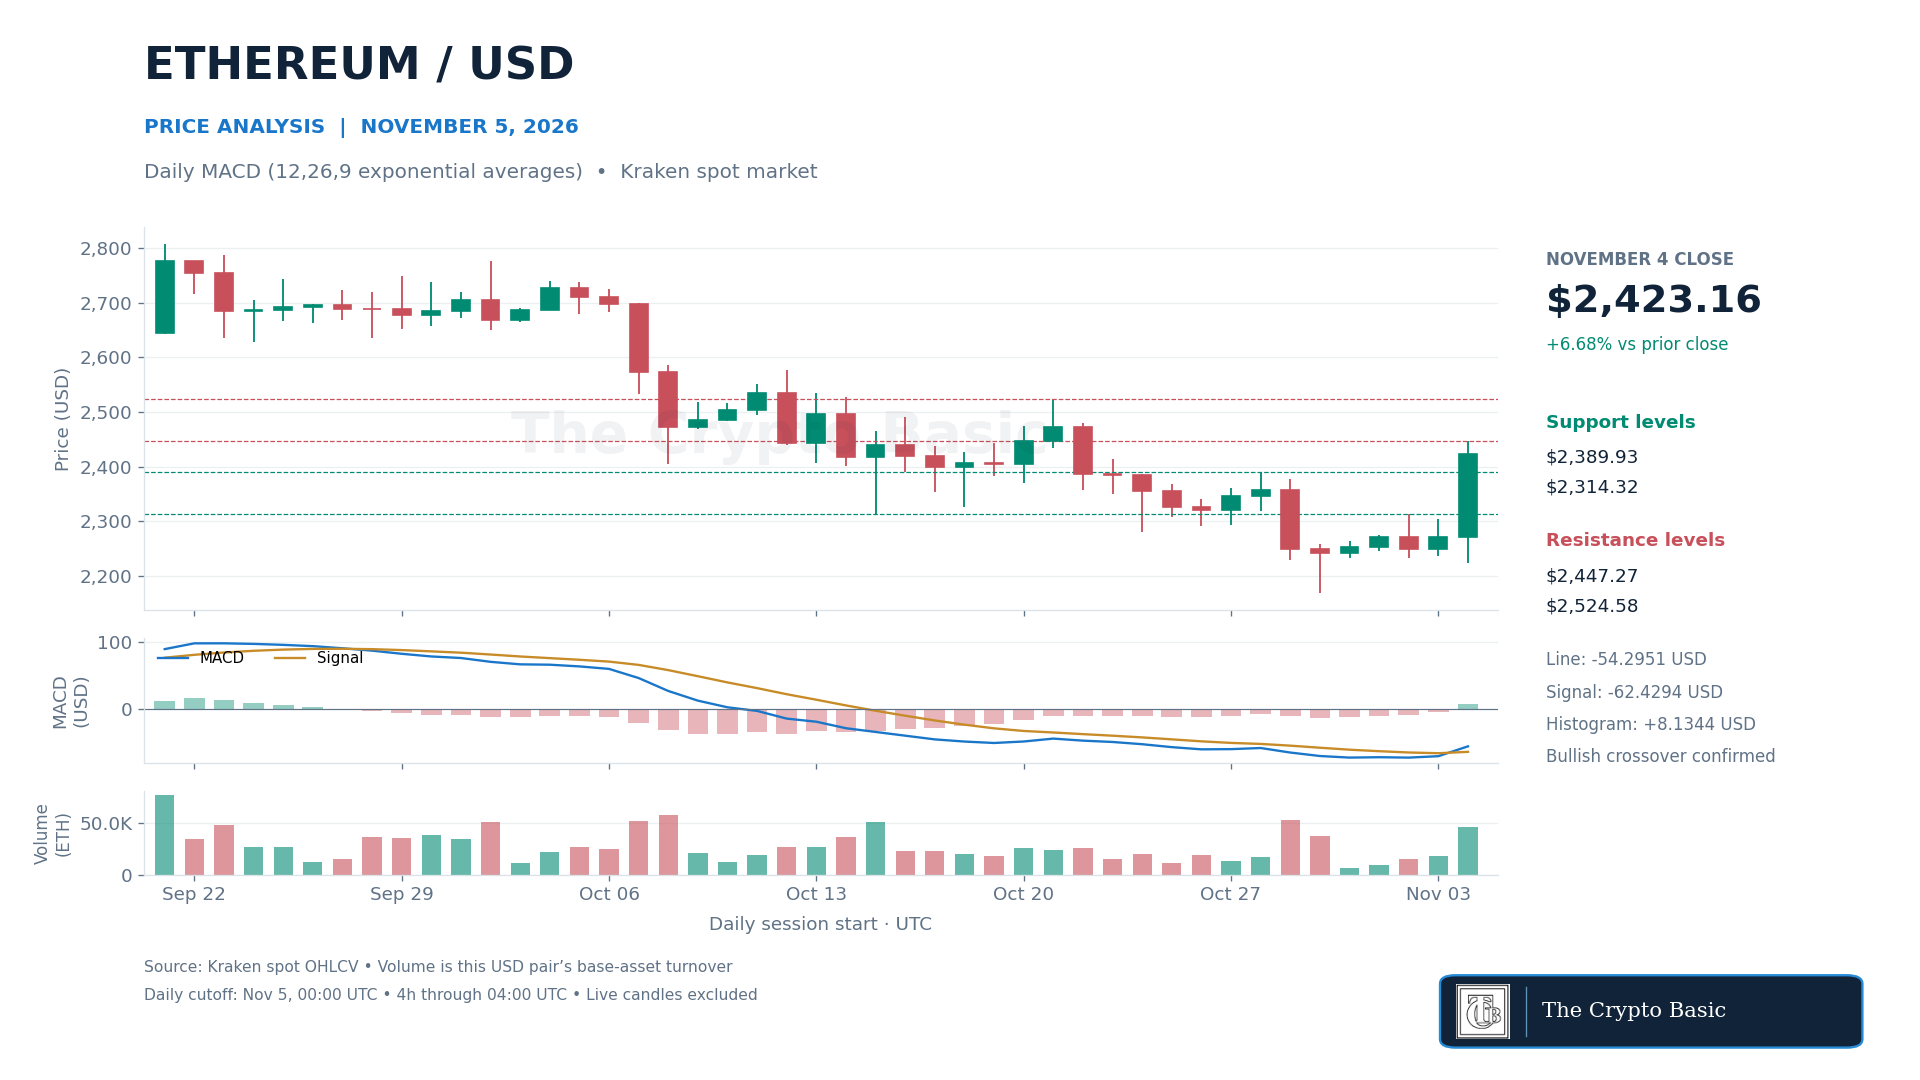
Ethereum closed Wednesday at $2,423.16, up 6.68%, after reaching $2,447.27 and finding support at $2,223.35. The close cleared $2,279.80, $2,314.32 and $2,319.54, the recovery thresholds discussed in Wednesday’s price analysis. The latest $2,423.36 price was 7.99% above the price recorded in that report.
ETH/USD confirms a bullish MACD crossover on Wednesday’s completed candle, with the histogram turning positive at +8.13.
Daily MACD, calculated with 12- and 26-period exponential averages and a nine-period signal EMA, now confirms a bullish line-signal crossover. The MACD line rose to −54.30, above the −62.43 signal. Its histogram changed from −4.37 to +8.13 on the completed Wednesday candle.
This is more than a narrowing bearish histogram. The line has crossed its signal, although both remain below zero, indicating that the improvement is still developing within a recovery from the preceding decline. Four-hour momentum was also positive: the latest completed histogram stood at +19.07.
A daily close above $2,447.27 would extend the breakout and put October 21’s $2,524.58 high in view. Holding the reclaimed October 28 high at $2,389.93 would preserve a nearby support reference. A return below $2,314.32 would weaken the breakout materially. Losing Wednesday’s $2,223.35 low would overturn the latest reversal, while a daily close below $2,170 would invalidate the broader recovery base.
NEAR Recovers $3.90 but RSI Remains Below Neutral
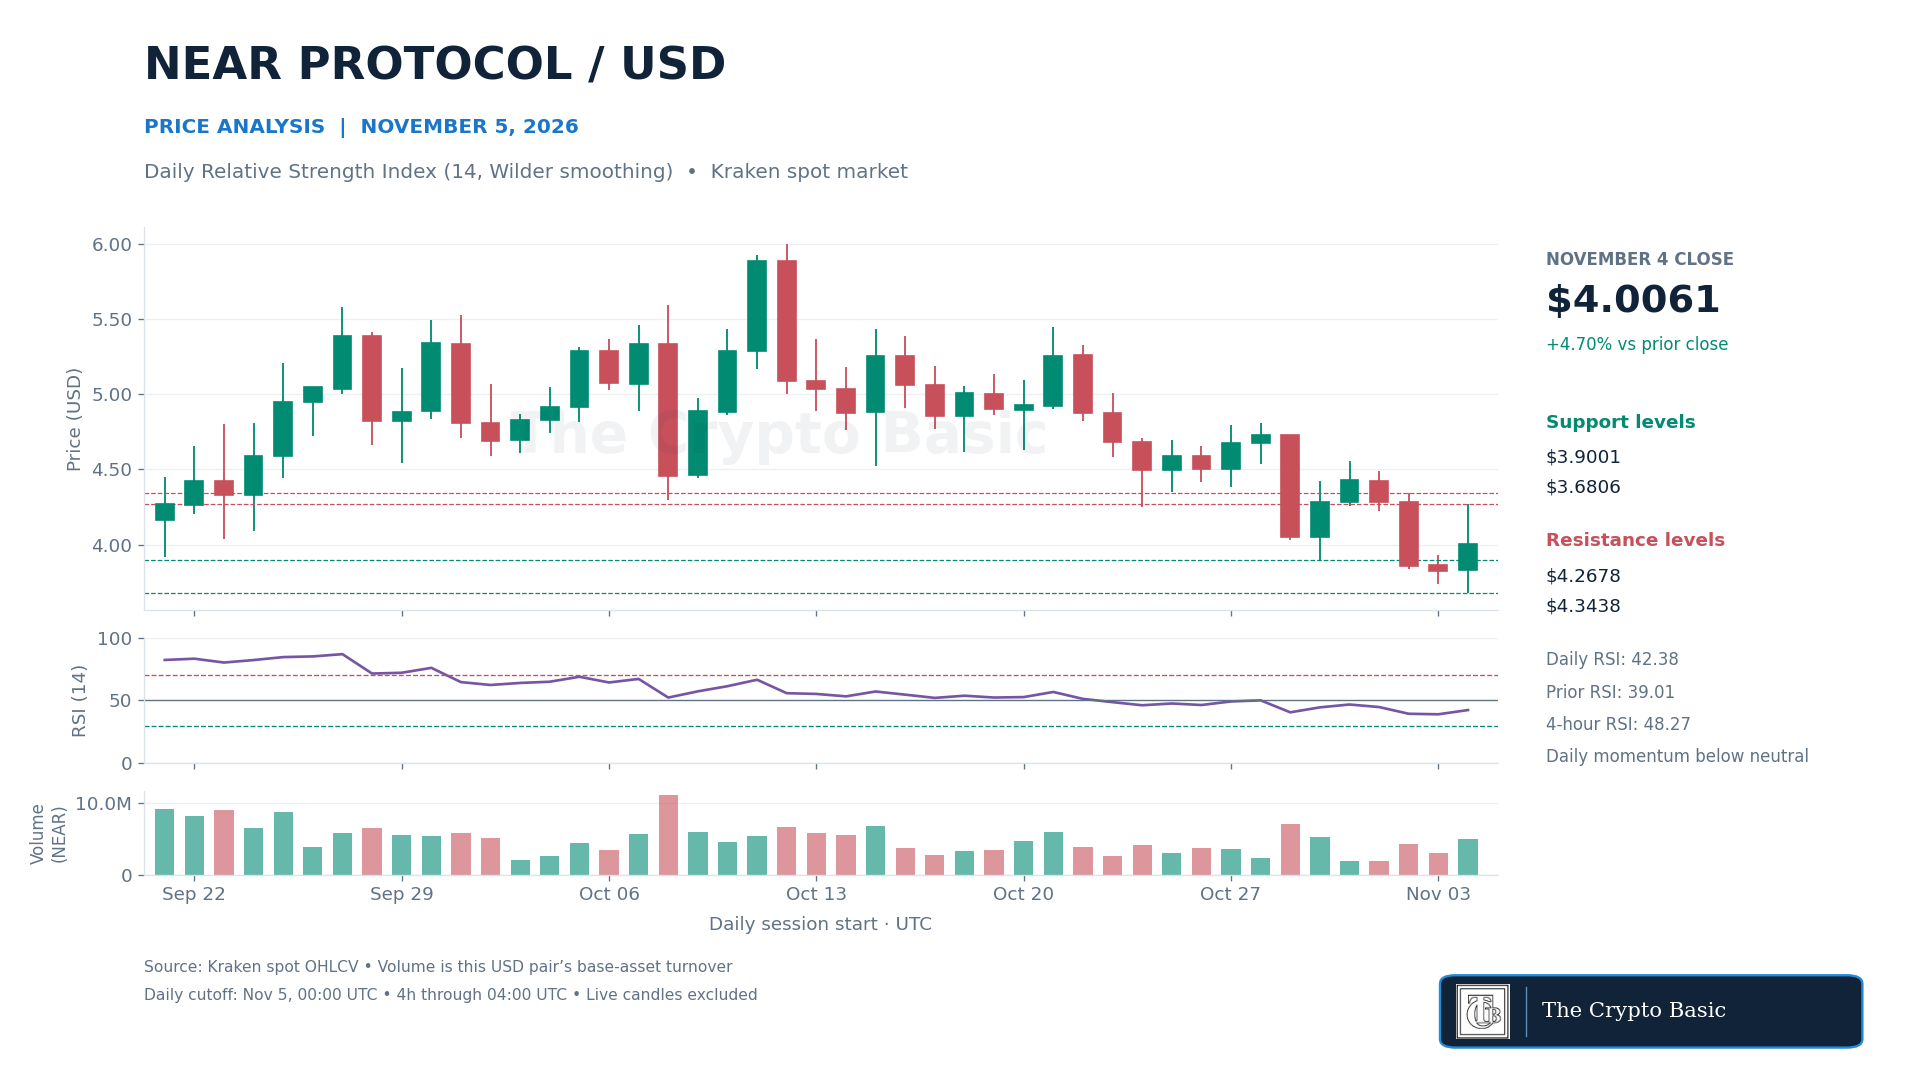
NEAR closed Wednesday at $4.0061, gaining 4.70%, after a wide $3.6806–$4.2678 session. The low was the weakest price in the latest 30 completed daily sessions. Buyers subsequently recovered Tuesday’s $3.9337 high and the $3.9001 floor lost earlier in the week, but the close remained well below the session high.
NEAR/USD recovers above $3.9001 after a new 30-session low, while daily RSI rises to 42.38 but remains below neutral.
The daily 14-period RSI, using Wilder smoothing, rose to 42.38 from 39.01. Momentum improved without crossing the neutral 50 threshold. The latest completed four-hour RSI was 48.27, also below neutral, despite a closing price of $4.0340.
That leaves NEAR in a recovery phase rather than a fully established bullish trend. Its 7.91% gain over the past 24 hours still accompanied a 9.45% decline over seven days. The shorter rebound has recovered only part of the weekly loss.
A daily close above $4.0333 would reclaim another former support, followed by Wednesday’s $4.2678 high. Clearing that high would strengthen the rebound toward Monday’s $4.3438 high. Conversely, falling back below $3.9337 and $3.9001 would challenge the latest reclaim, with $3.7385 next. A daily close below $3.6806 would invalidate Wednesday’s reversal and confirm another extension of the recent decline.
Ethena Rebounds Inside Its Daily Bollinger Bands
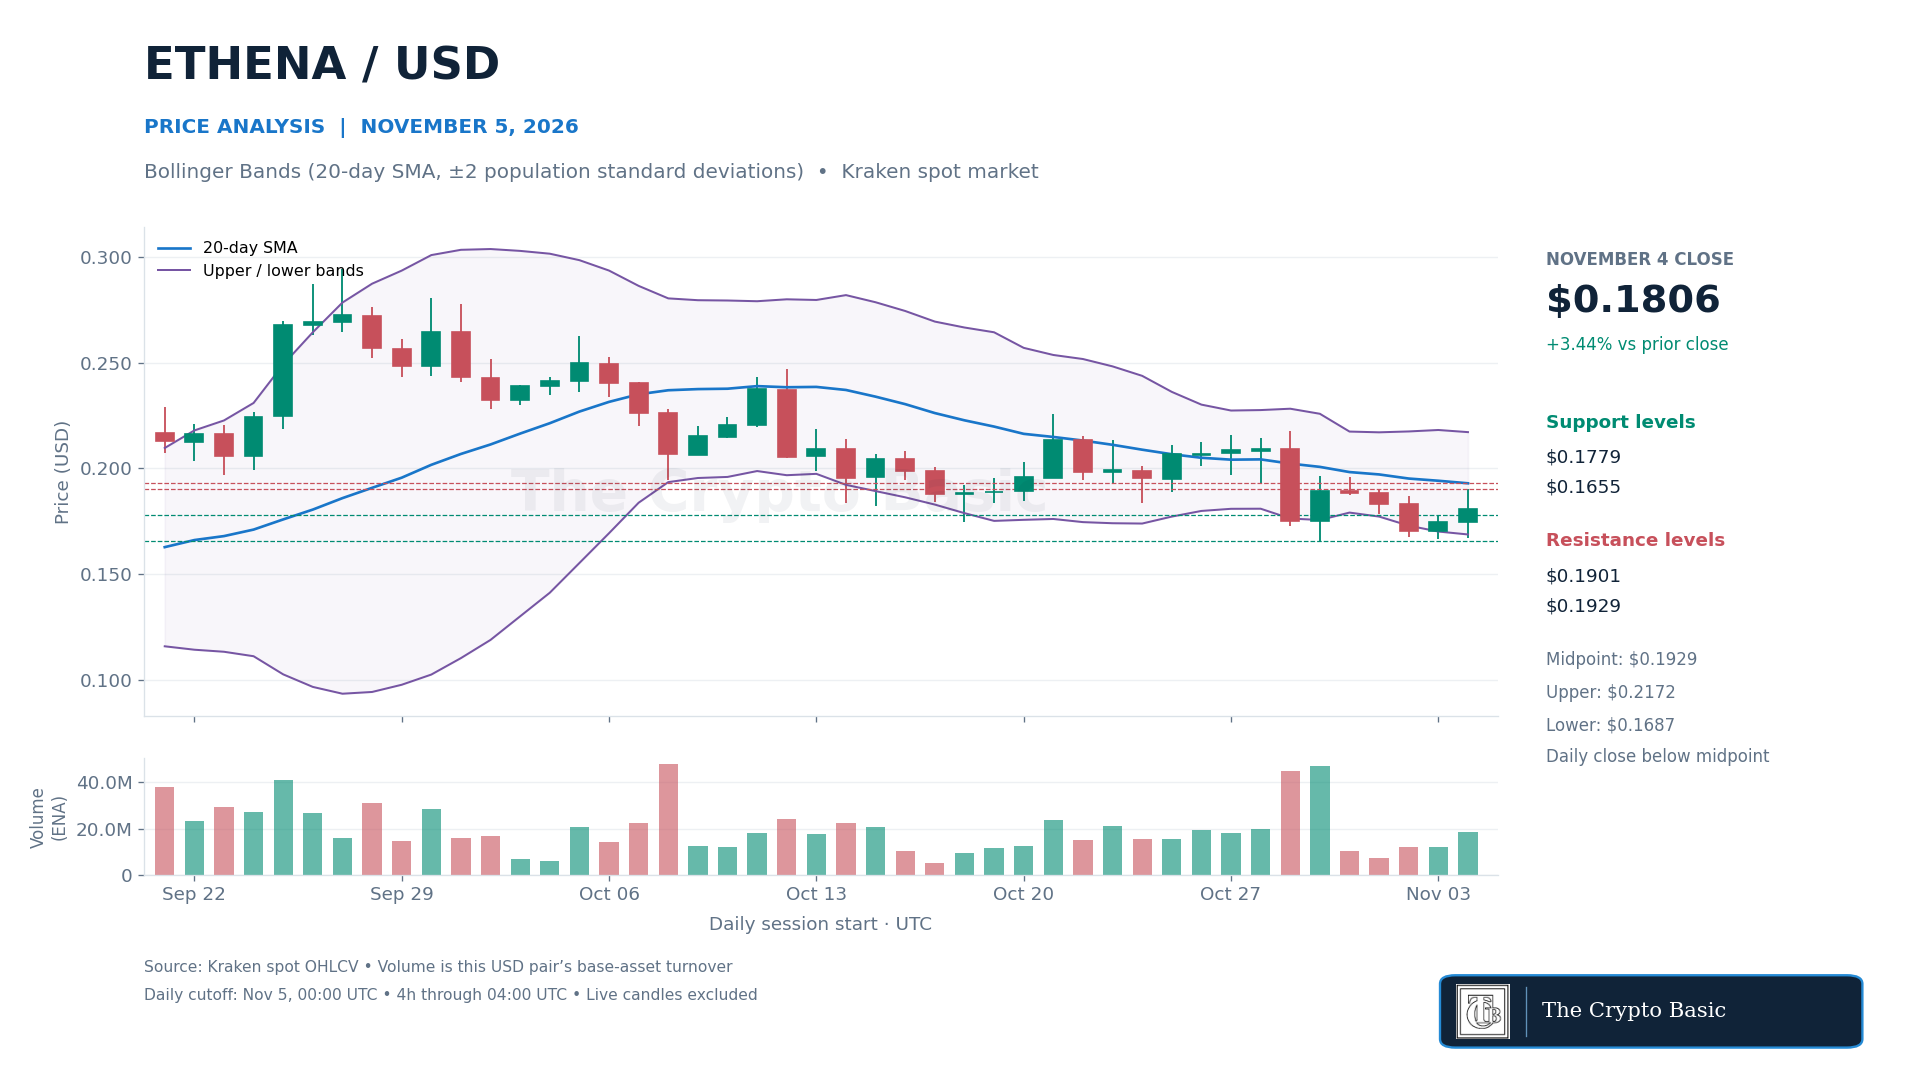
Ethena closed Wednesday at $0.1806, rising 3.44%, after trading between $0.1670 and $0.1901. The session formed a higher high and higher low than Tuesday and closed above Tuesday’s $0.1779 high. However, the advance stopped at the same $0.1901 high recorded on November 1.
ENA/USD closes back inside its daily Bollinger envelope but remains below the falling $0.19294 midpoint and repeated $0.1901 resistance.
Daily Bollinger Bands, using a 20-day simple moving average and two population standard deviations, placed the midpoint at $0.19294. That midpoint fell from $0.19414, leaving the recovery beneath a declining daily trend reference. The lower band stood at $0.16871 and the upper band at $0.21717.
Wednesday’s low fell beneath the final daily lower-band value, but the close finished back inside the envelope. That distinction matters: the session did not confirm a closing break below the lower band. The latest completed four-hour close of $0.1816 was above its own $0.17631 midpoint, showing a firmer short-term picture.
A daily close above $0.1901 would clear the repeated resistance, with the daily midpoint and October 30’s $0.1965 high next. Losing $0.1779 would weaken the recent breakout. Support then sits at $0.1670 and $0.1665; a daily close beneath October 30’s $0.1655 low would invalidate the rebound. Band values will adjust as new candles close.
Zcash Advances on More Than Twice Its Recent Average Volume
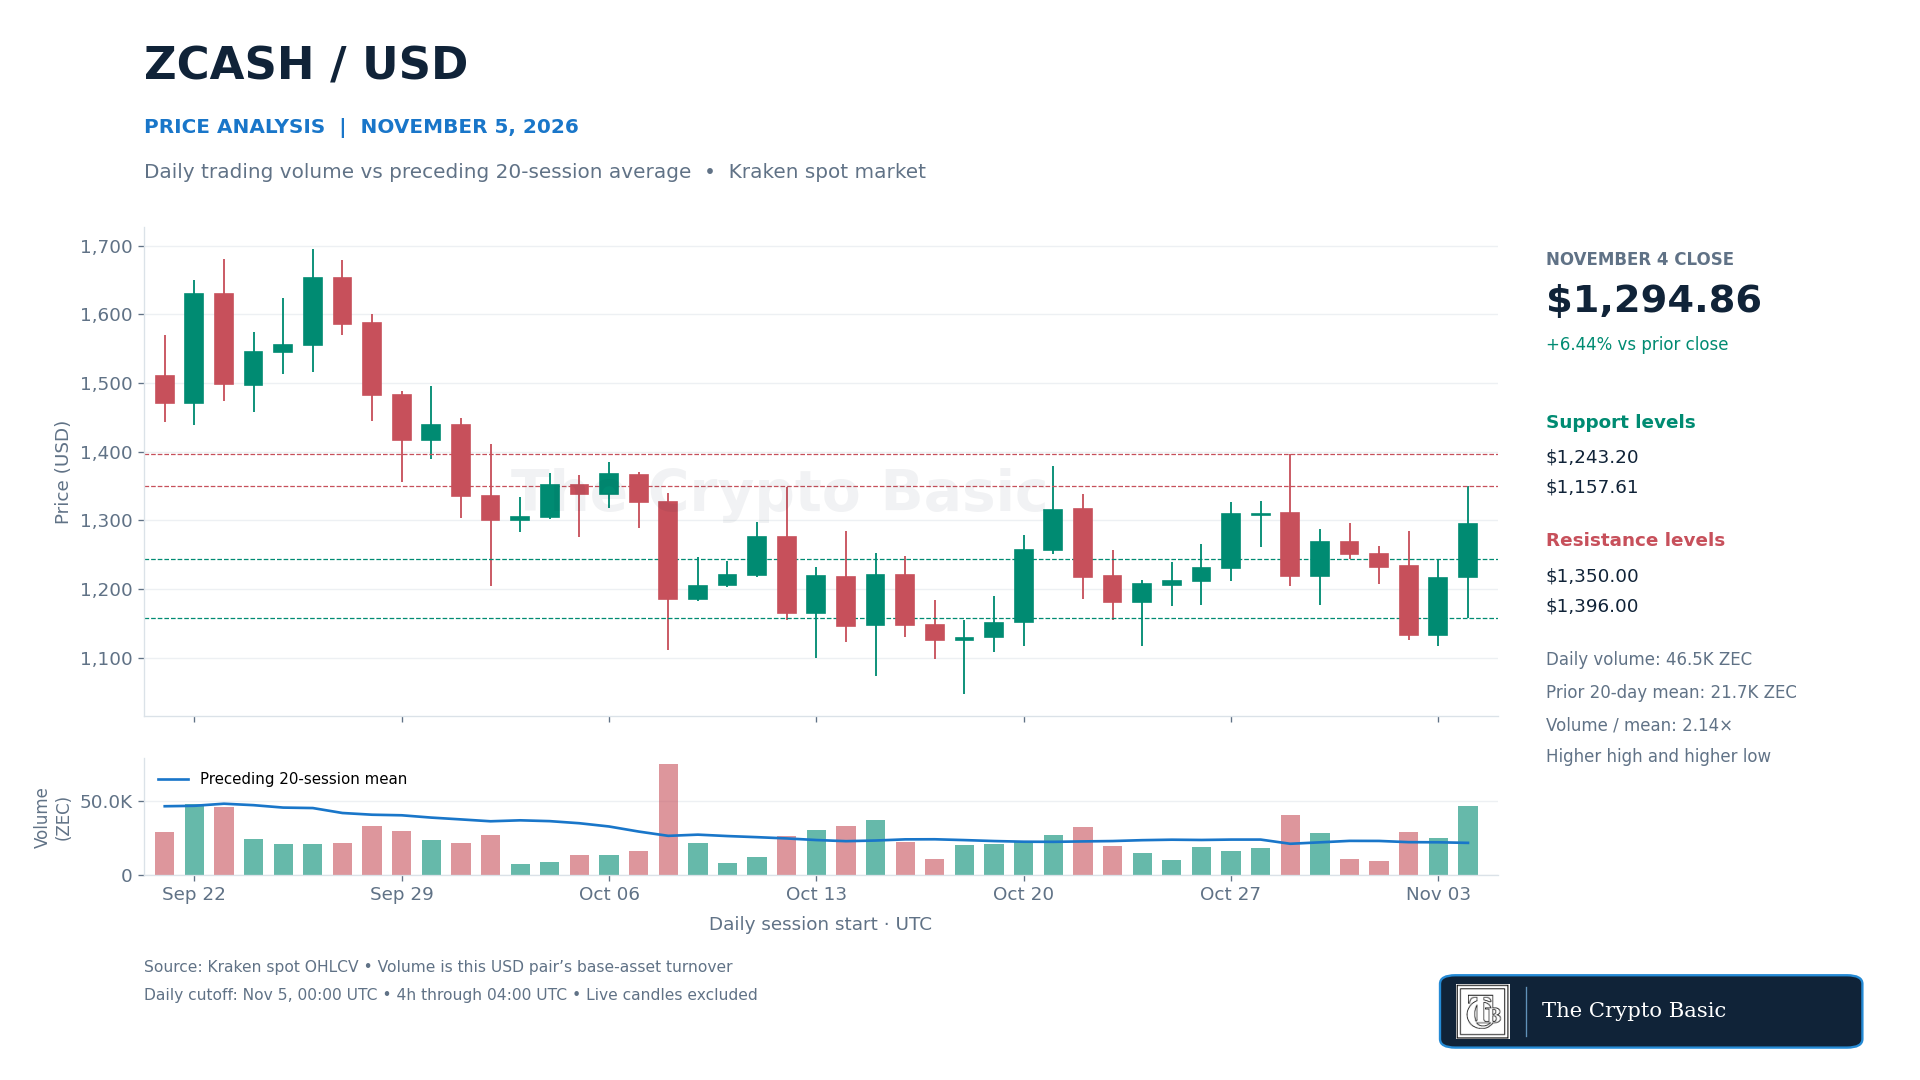
Zcash closed Wednesday at $1,294.86, gaining 6.44%, after reaching $1,350 and finding support at $1,157.61. The session produced a higher high and higher low than Tuesday and closed above Tuesday’s $1,243.20 high. It nevertheless finished just below October 31’s $1,296.85 high.
ZEC/USD advances 6.44% on volume 114% above its preceding 20-session average, with $1,350 and $1,396 as the next resistance levels.
Daily turnover reached approximately 46,542 ZEC, compared with a preceding 20-session average of 21,720 ZEC. Participation was therefore 2.14 times that benchmark, or about 114% above average. The price advance attracted substantially more trading than a typical recent session, supporting the breakout observation without establishing that the next resistance will clear.
The latest completed four-hour candle closed at $1,311.28, above $1,296.85. That confirms a shorter-timeframe reclaim of the level, while the daily chart still awaits a close above it. The latest market price of $1,312.37 remained below Wednesday’s high.
A daily close above $1,350 would strengthen the recovery toward October 29’s $1,396 high. Holding $1,243.20 would preserve the latest daily breakout. A return beneath that level would expose Wednesday’s $1,157.61 low, followed by Tuesday’s $1,117.06 low. A daily close below $1,117.06 would invalidate the two-session recovery despite its stronger participation.
Spending crypto has never been easier. You tap at the till, and the coffee is paid for. The receipt shows a clean number, the app shows a small fee, and it all feels as cheap as a bank card.
Often it is not. The true cost of a crypto purchase is spread across several places, and only one shows up as a line item. Some hide in the exchange rate, some arrive at tax time, and one never appears anywhere. Here is where your money goes, and how to keep more of it.
Cost 1: The Spread Inside the Exchange Rate
When you pay with Bitcoin or Ether, something has to convert it into dollars or euros for the merchant. That conversion rarely happens at the true market price.
Providers often add a markup to the rate, called a spread. A card might advertise a 1% fee, then convert at a rate another 1% or 2% worse than the market. You never see that second number. The only way to spot it is to compare your rate against the live market price.
Spending stablecoins largely avoids this, since a dollar-pegged token converts to dollars at close to one to one. That is a big reason many people now keep a spending balance in USDT or USDC rather than in volatile coins.
Cost 2: Double Currency Conversion Abroad
Travel adds a second layer. If your card converts crypto into US dollars, and you then pay in pounds or yen, there may be a foreign exchange charge on top of the crypto conversion. That is two conversions, each with its own margin, on a single purchase.
Before a trip, check which base currency your card settles in and whether foreign transaction fees apply. A card that converts straight into the local currency can save a noticeable amount over a week of spending.
Cost 3: Fees You Pay Before You Spend
Plenty of costs land before you ever tap the card.
Cost
When it hits
How to reduce it
Top-up fee
Moving crypto onto the card balance
Choose cards that spend directly from your wallet
Network fee
Sending coins on-chain to fund the card
Use low-fee networks for stablecoins
ATM fee
Withdrawing cash
Stay within free withdrawal limits
Inactivity fee
Leaving the card unused
Close cards you no longer use
Card issuance or replacement
Ordering or reissuing a physical card
Use the virtual card where possible
Some of the newer Crypto Cards cut out the top-up step entirely by spending straight from a connected wallet, such as MetaMask or Trust Wallet, so your crypto does not have to sit in a separate card account first. Spending this way removes one whole layer of fees and transfers.
It is worth adding these fees up over a month rather than judging each one alone. A small top-up charge, a network fee to fund the card, and one ATM withdrawal can easily cost more than the advertised conversion fee itself. Seen together, they often explain why a crypto spending balance seems to shrink faster than your purchases suggest.
Cost 4: The Tax on Every Swipe
This is the cost most people never see coming, because it does not show up until they file.
In the US, the IRS treats cryptocurrency as property, not currency. Its frequently asked questions on virtual currency transactions make clear that using crypto to pay for goods or services counts as disposing of it, so any gain since you bought it can be taxable. Buy a sandwich with Bitcoin that has risen in value, and you may owe tax on the gain, not just pay for lunch.
Spend daily, and you create dozens of small taxable events a month, each needing a record of what you paid for the coins. Many other countries have similar rules. Two practical fixes:
Spend stablecoins, which usually hold their value, so there is little or no gain to tax
Keep records with a portfolio tracker that logs your cost basis automatically
Cost 5: The Opportunity Cost Nobody Calculates
This one never appears on any statement. When you spend a coin, you give up whatever it might have been worth later.
The famous example is the 10,000 Bitcoin spent on two pizzas in 2010. If you spend an asset you believe will rise, every purchase quietly sells a piece of your long-term bet. The fix is spending the right crypto, usually stablecoins, and keeping long-term holdings separate.
Cost 6: Cashback That Comes With Strings
Cashback can offset many of these costs, but read the terms. Some cards only pay headline rates if you lock up the issuer’s own token, pay rewards in a token that can drop, or cap monthly earnings low. A 5% reward paid in a token that falls 30% is not really a 5% reward.
Ask three questions: what do I have to hold, what currency is the reward paid in, and is there a monthly cap?
How to Keep Your Spending Costs Low
None of these is a reason to stop spending crypto, just a reason to spend deliberately.
Keep a separate spending balance in stablecoins
Compare the conversion rate you get against the live market price
Pick a card that spends directly from your wallet to skip top-ups
Check foreign exchange terms before you travel
Track every transaction for tax purposes
Value cashback in dollars, not in the issuer’s token
The industry itself is moving in this direction, with major networks such as Mastercard testing ways to settle card payments with stablecoins directly on blockchain rails. Until those hidden layers shrink, knowing where the costs sit is the best way to avoid them.
Frequently Asked Questions
What is the biggest hidden cost of spending crypto?
For most people, it is the spread inside the conversion rate, closely followed by tax, which can turn everyday purchases into reportable gains.
Is spending stablecoins cheaper than spending Bitcoin?
Usually, yes. Stablecoins convert at close to face value, so the spread is smaller, and there is typically little or no taxable gain.
Do I have to pay tax when I buy something with crypto?
In the US and many other countries, spending crypto counts as disposing of it, so any increase in value since you acquired it may be taxable. Rules vary by country, so check with a tax professional where you live.
How can I see the real cost of a crypto purchase?
Compare the crypto that left your balance with the live market price at the moment of purchase. The difference, plus any listed fee, is the true cost.
Crypto’s November 4 news spans exchange security, corporate earnings and new ways to bring traditional investments onto blockchains. Here are ten announcements and fresh disclosures from today, including Binance’s reserve update, Schroders’ Solana debut and South Korea’s proposed crypto tax delay.
Circle Reports $865 Million in Quarterly Revenue and Reserve Income
Circle’s third-quarter results showed combined revenue and reserve income of $865 million, up 17% from a year earlier. The total included $182 million from the ARC token presale, while income earned on reserves fell 8% to $658 million. The USDC issuer also disclosed a 5% workforce reduction and approximately $9.1 million in restructuring expenses.
Binance Expands Its Latest Reserve Snapshot to 44 Tokens
Binance announced a November 4 reserve snapshot covering 44 tokens, expanding the scope from ten in its preceding update. The exchange said generating the accompanying cryptographic proof would take another 50–60 hours, so the announcement did not represent a completed verification. It also reiterated that approximately 98% of the assets affected by the recent hack had been replenished, with purchases of less liquid tokens still underway.
Schroders Makes Its First Fund Deployment on Solana
Centrifuge announced a Solana-based investment product that gives holders tokenized exposure to Schroders’ Emerging Market Bond fund. The launch marks Schroders’ first deployment on the network and brings an actively managed emerging-market debt strategy into its blockchain ecosystem. Schroders continues to manage the underlying investment strategy, while Centrifuge provides the tokenization infrastructure.
Coinbase Details How It Protects Customer Holdings
Coinbase said in a security update that more than 99% of customer assets are kept in cold storage, with online wallet balances adjusted to meet withdrawal demand. The company described safeguards including distributed signing controls, transaction limits and systems designed to flag unusual activity. Coinbase also said the Binance incident had not affected its platform.
BitGo Introduces Global Markets Business
BitGo launched Global Markets to bring institutional trading, borrowing, derivatives and settlement services together within a dedicated business. Former NYDIG executive Pete Janney will lead the division, which also offers investment strategies and structured products for eligible clients. Its financing services allow customers to borrow against crypto collateral held in qualified custody.
South Korea’s Ruling Party Formally Requests Crypto Tax Delay
South Korea’s Democratic Party leader Kim Min-seok formally asked the government to postpone the crypto income tax scheduled to begin on January 1, 2027. He argued that the country should establish its Digital Asset Basic Act first and give market participants time to adjust. The request remains a proposal; it does not itself change the tax’s scheduled start date.
Tether Reports $3.44 Billion in Gold Backing for XAUT
Tether’s newly released third-quarter figures put the gold backing XAUT at approximately 827,418 fine troy ounces, worth $3.44 billion as of September 30. The physical gold holdings had increased 59% since the end of 2025, reaching roughly 25.7 tonnes. According to Tether, each XAUT token represents one fine troy ounce of gold held in Swiss vaults.
Crédit Mutuel Arkéa Confirms Attack After Investigator Identifies Bank
French banking group Crédit Mutuel Arkéa confirmed that an attack had enabled fraudulent transactions, saying it had brought the incident under control and temporarily restricted some transactions. Blockchain investigator ZachXBT linked the bank to suspected theft exceeding $133 million, although the bank did not confirm that amount or specify whether the stolen funds were originally fiat or crypto. A spokesperson said customers would face no financial consequences from the incident.
FinChain and Plume Launch Leveraged Yield Product
FinChain announced FLEX & FINO with Plume, introducing a borrowing-based strategy for its FUSD token, which is backed by tokenized short-term U.S. Treasuries and money market funds. Participants can pledge FUSD, borrow USDC and place the borrowed funds in liquidity pools to seek additional income. FinChain projects annualized returns of up to 7.2% under its stated assumptions, rather than a guaranteed payout.
Change Lending Selects Profitr for Mortgage Tokenization
Change Lending and Profitr announced an agreement to develop a marketplace where institutional investors can buy and sell tokenized residential mortgage loans. Change Lending appointed Profitr as its exclusive tokenization partner, with the planned expansion drawing on Profitr’s Avalanche-based technology. The companies intend to connect Change’s mortgage origination and investor networks with blockchain-based ownership, trading and settlement.
CoreWeave (NASDAQ: CRWV) shares fell more than 9% to $48.62 in Wednesday’s premarket trading after Gina Hinojosa defeated incumbent Texas Governor Greg Abbott in the state’s gubernatorial election, drawing attention to the company’s 262-megawatt data-center commitment in Texas.
Hinojosa has called for a moratorium on new data-center approvals until Texas lawmakers establish protections addressing electricity costs, water supplies, and local communities’ role in approving projects. Her election does not itself impose new restrictions on the company’s existing facilities or contracts.
Wednesday’s premarket decline more than offset CoreWeave’s 7.16% rebound on Tuesday, when shares gained $3.59 to close at $53.74 after an 8.6% decline the previous day. The stock had reached a regular-session 52-week low of $49.46 on November 2.
The weakness extended to other data-center-related stocks, with Applied Digital down about 3% and Nebius falling 1.3% in early premarket trading.
A separately traded CoreWeave-linked instrument also declined. CoreWeave Tokenized bStocks (CRWVB) was trading at $48.97, down 5% over the previous 24 hours, according to CoinMarketCap. Because the tokenized instrument trades separately from CoreWeave’s Nasdaq-listed shares, its 24-hour price movement is not directly comparable to the stock’s premarket decline.
Core Scientific’s $110 Million Denton Fit-Out Is Underway
CoreWeave has contracted 262 MW of critical IT capacity at Core Scientific’s Denton, Texas, campus. Core Scientific develops and operates the facilities under licensing agreements with CoreWeave and leases the Denton property from the City of Denton, according to an April 21 regulatory filing. CoreWeave has also contracted 16.5 MW of capacity at Core Scientific’s Austin facility.
The Denton campus comprises eight buildings being converted from cryptocurrency mining operations to artificial intelligence and high-performance computing workloads. Core Scientific’s April filing identified four buildings, representing approximately 132 MW, as operational and generating billable revenue.
A November 2 report from local development publication Groundbreak said seven of the eight buildings were in service, with Core Scientific carrying out an interior fit-out of the remaining building.
Texas Department of Licensing and Regulation records identify the work as the Core Scientific DTO Building A project at 8171 Jim Christal Road in Denton. The project involves converting about 27,678 square feet of existing space into a data hall, with an estimated cost of $110 million.
The state registration identifies Core Scientific as the project owner and lists a September 1, 2026, construction start date and a May 31, 2027, scheduled completion. The $110 million estimate applies only to Building A, not the entire Denton campus. Core Scientific’s April filing provides for CoreWeave to pay or reimburse certain development costs under their licensing agreements but does not separately identify the full Building A estimate as CoreWeave’s expenditure.
The fit-out involves converting an existing building rather than constructing a new one. However, the scope of Hinojosa’s proposed statewide moratorium remains undetermined, and available project records do not establish whether it would apply to ongoing conversions.
Texas had already introduced restrictions on data-center development under Abbott.
On August 18, Abbott’s office announced that CoreWeave, Power House Data Centers and Emergent Data Centers had committed to complying with state standards covering electricity infrastructure costs, water conservation and community protections.
Core Scientific subsequently disclosed on September 10 that the Electric Reliability Council of Texas (ERCOT) had conditionally approved 297 MW of existing electrical load at the Denton campus as longstanding base load. This figure measures the campus’s electrical load, not the 262 MW of critical IT capacity CoreWeave has contracted. ERCOT had also included and validated another 74 MW of planned electrical load in its 2025 transmission-planning studies.
Both portions remained outside ERCOT’s Batch Zero process, which reviews large electricity-load requests and allocates available grid capacity. However, the disclosure did not establish that every other required development permit had been approved.
Abbott tightened statewide oversight further on September 21, directing the Texas Commission on Environmental Quality to halt data-center permits pending an ERCOT audit. He also instructed state agencies to withhold related regulatory approvals until they obtained the information needed to assess development impacts.
Denton introduced separate local restrictions. On October 13, the City Council approved revised development rules requiring council-approved specific-use permits for future data-center projects in eligible zoning districts.
The council then held a second public hearing and the first reading of a proposed local data-center moratorium on October 27, with a final decision scheduled for December 1. City officials said the proposal would pause new development applications but could not halt or invalidate applications already filed.
These existing measures are separate from Hinojosa’s proposed statewide moratorium. Available disclosures do not establish that work at Core Scientific’s Denton campus serving CoreWeave has been halted or that CoreWeave’s contracted capacity arrangements have changed.
Georgia Election Raises Questions About Additional CoreWeave Capacity
The potential for tighter data-center restrictions also extends to Georgia, where CoreWeave has additional contracted capacity.
Democrat Keisha Lance Bottoms defeated Republican Rick Jackson in Georgia’s gubernatorial election after campaigning for a statewide pause on new data-center construction.
Core Scientific’s April filing identifies 175 MW contracted to CoreWeave across two facilities in Dalton, Georgia. These comprise a 30 MW conversion of an existing facility and a 145 MW new-build development.
Together with CoreWeave’s contracted capacity in Denton and Austin, the Georgia facilities account for 453.5 MW of the approximately 590 MW covered by the companies’ disclosed licensing agreements. The figures show the extent of CoreWeave’s contracted capacity in the two states but do not establish that any of it has been halted or will be affected by future restrictions.
Two groups of large XRP holders have added 770 million tokens to their combined balances since the Binance hack occurred five days ago.
Specifically, the groups include addresses holding between 1 million and 10 million XRP and those with balances ranging from 100 million to 1 billion XRP.
Large XRP Holders Add 770M Tokens
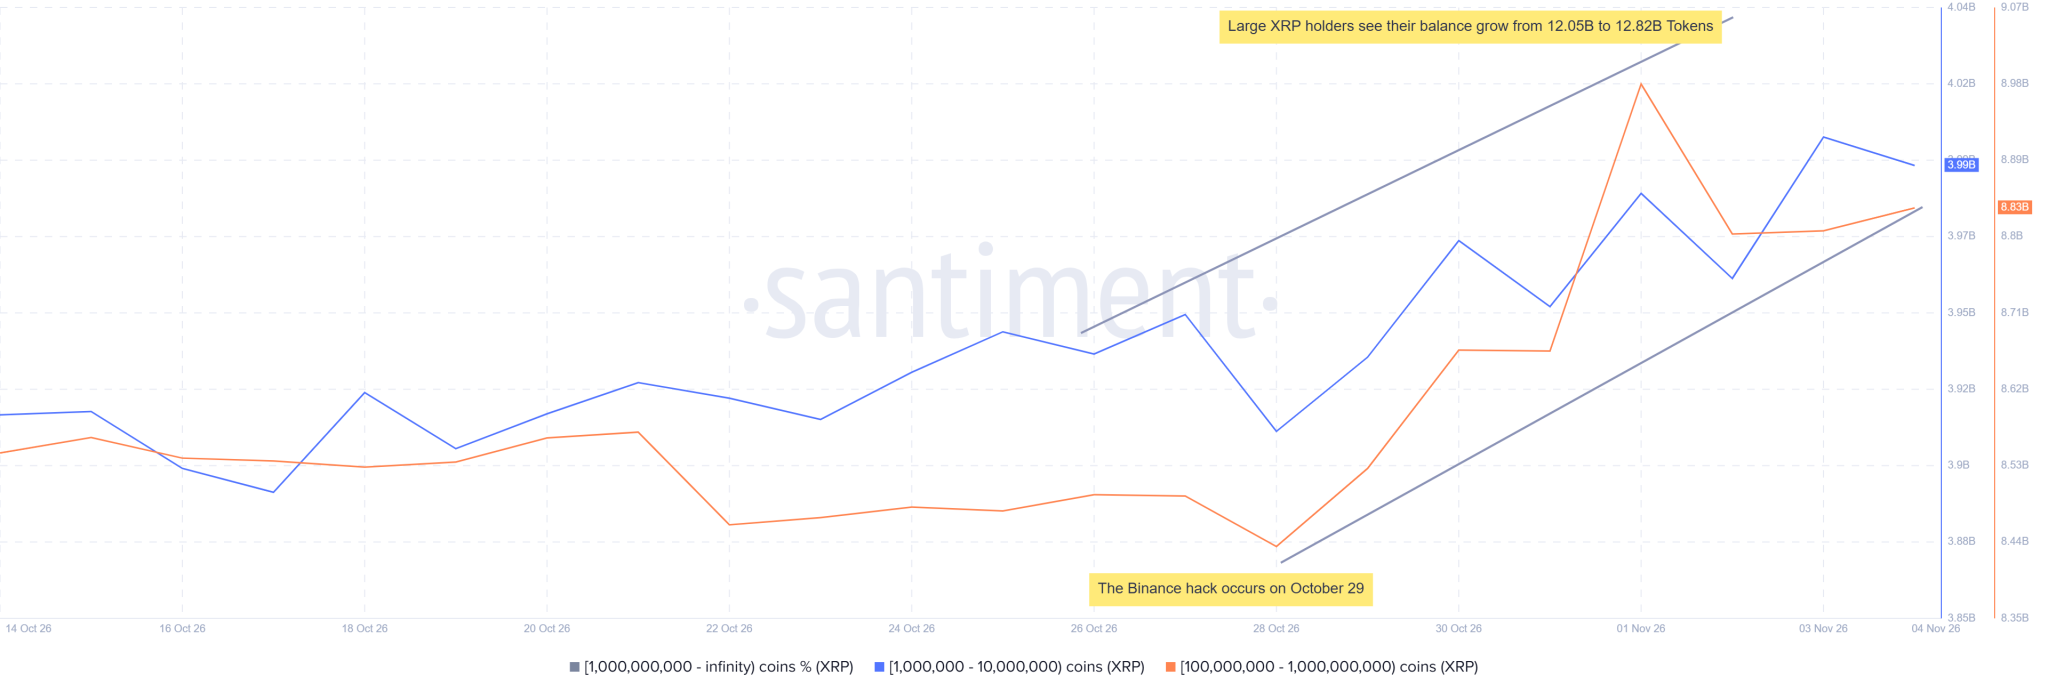
On Oct. 28, a day before the Binance exchange exploit, these XRP holders had a combined balance of 12.05 billion XRP, worth more than $15.9 billion at the time.
Of this figure, wallets holding 1 million to 10 million XRP had 3.91 billion tokens, while those with 100 million to 1 billion XRP held 8.44 billion tokens.
The cumulative figure has since risen to 12.82 billion XRP, with the holdings now worth more than $16 billion. Notably, addresses with 1 million to 10 million tokens now hold 3.99 billion XRP, with the ones holding 100 million to 1 billion XRP now sitting on 8.83 billion tokens.
Large XRP holders accumulate about 770 million tokens after the Binance hack
The large increase shows that large XRP holders have continued to move significant amounts of the token despite the market’s recent weakness.
Interestingly, both groups had remained mostly inactive throughout October. They occasionally reduced their holdings as XRP faced selling pressure.
However, their activity changed around the time the Binance security breach shook the broader crypto market. While investors reacted to the uncertainty, these large holders began adding substantial amounts of XRP to their balances.
Binance’s $6.3 Billion Breach
For context, the Binance hack had an estimated financial impact of approximately $6.3 billion, which makes it one of the largest security breaches in cryptocurrency history.
The Crypto Basictraced the initial theft to XRP, reporting that hackers drained 233.46 million tokens from Binance within minutes of the incident. The stolen XRP was worth approximately $297 million at the time.
The breach spread fear across the crypto market and triggered widespread selling as investors reacted to the news. Interestingly, large XRP holders began increasing their balances during this period of market uncertainty.
XRP Absorbs the Damage
On the day of the hack, XRP fell 6.64%, recording its steepest single-day decline since mid-September. Its price dropped from $1.32 to $1.23 before the trading session ended.
XRP attempted a small recovery the following day but failed to move above $1.27. The token then traded within a narrow range of $1.24 to $1.26 for the next three sessions as the market continued to assess the impact of the breach.
This period of sideways trading also coincided with most of the accumulation recorded among large XRP holders. Their combined balances increased while XRP struggled to recover from its Oct. 29 decline.
By Nov. 3, XRP had started to recover, gaining 2.09% in one session and climbing back to $1.28. While this increase has brought some relief after several difficult trading sessions, the token remains below its October 29 price of $1.32.
Are Large XRP Holders Accumulating or Just Rebalancing?
There are two possible explanations for the 770 million XRP increase, and the available on-chain data does not establish which one is correct.
The first is that large holders saw the market decline as a buying opportunity and decided to increase their positions while prices remained low.
This follows the buy-the-fear approach, in which investors purchase an asset when negative market sentiment pushes its price down.
Santiment’s previous research has also pointed out that increased activity among large-holder wallets during price declines can indicate growing confidence among investors with longer-term plans. XRP millionaire addresses have also increased during this period.
The second explanation relates to the restrictions Binance introduced after the security breach.
The exchange suspended deposits and withdrawals following the incident, and the large XRP movements visible on-chain suddenly stopped. This suggests that the suspension may have affected the activity recorded during that period.
Once Binance resumed withdrawals, the large XRP movements started again.This raises the possibility that some of the 770 million tokens came from existing holders moving their assets away from Binance into private wallets or other platforms, not necessarily buying additional XRP.
XRP whale activity on Binance has climbed to a level last seen in October 2024, as large holders account for a growing share of the tokens leaving the exchange.
The development has drawn investor attention because similar readings in the past came before significant increases in XRP price.
XRP Whale Activity Spikes
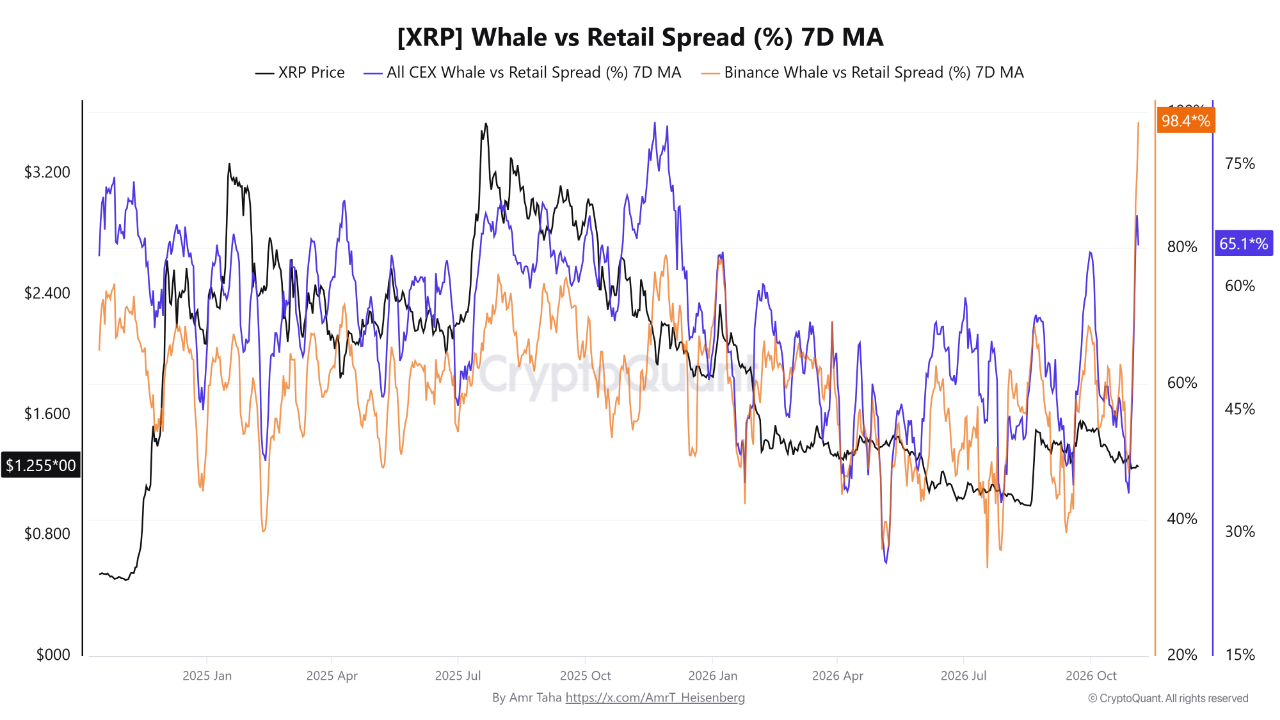
For context, the indicator behind this development is the Binance Whale vs. Retail Spread. It measures the difference between outflows involving large XRP holders and those involving smaller investors.
Specifically, it compares whale outflows of more than 10,000 XRP with retail outflows of less than 10,000 XRP, then calculates the difference between their respective dominance levels.
A higher reading means large holders account for a greater share of total exchange outflows than retail participants.
On Nov. 4, the spread climbed to 98.4% on Binance, its highest reading since Oct. 15, 2024. The figure was considerably lower across the wider market, with the combined reading for all centralized exchanges standing at 65.1%. This shows that the increase in whale outflow dominance has been particularly strong on Binance.
XRP whale vs retail spread on Binance spikes to its highest level since October 2024
October 2024 Levels Previously Came Before a Major XRP Rally
The latest reading has attracted attention from the XRP community because of what happened the last time the indicator reached similar levels.
Notably, in October 2024, whale outflow dominance returned to a level comparable to its current reading. XRP subsequently recorded a rally of more than 525%.
Another similar development occurred in June 2025. On that occasion, a rise in the indicator came before XRP recorded a 71% price increase.
Both instances suggest that a massive increase in large-holder outflow dominance can precede a strong recovery, although neither guarantees that the current market will follow the same path.
For now, XRP is trading around $1.27 after losing nearly 16% in October. The asset has also struggled to regain the $1.30 level, and this leaves it under intense selling pressure despite the increase in whale-related outflows.
Binance Security Breach Contributed to the Large Outflows
The latest increase in whale activity also comes against the background of a major security breach involving Binance.
On Oct. 29, transactions involving more than 1 million XRP reached 283 million tokens. This activity pushed Binance’s whale netflow down to -226 million XRP, marking one of the largest single-day outflows in the exchange’s history.
The figure was 2.72x greater than the previous record of -83 million XRP, which Binance recorded in September 2022.
However, the outflow did not result from a wave of investors selling their XRP or deliberately moving away from the asset. Notably, an attacker withdrew nearly $300 million in XRP from Binance during a major security breach.
Binance began restoring its withdrawal services in stages on Nov. 1, including XRP withdrawals. Activity picked up after the exchange resumed these services, with large-transfer outflows reaching 80 million XRP. This represented a 5.44-fold increase from the 14.7 million XRP recorded on Oct. 30.
Binance Records 297M XRP in Whale Outflows Within Seven Days
Besides the movements linked to the security breach, Binance’s cumulative whale outflow data shows that large holders continued withdrawing XRP over a wider period. Between Oct. 28 and Nov. 4, the indicator increased from 399 million XRP to 696.1 million XRP.
The difference amounts to 297.1 million XRP, representing a 74.5% increase in just seven days.This suggests that large holders were already moving substantial amounts of XRP away from Binance before the Oct. 29 incident and continued doing so afterward.
The movement of XRPaway from exchanges could have implications for selling pressure. When holders transfer their tokens into private wallets or cold storage, those assets are no longer immediately available for spot selling on exchanges.
If this trend continues, it could reduce the amount of XRP readily available for sale and ease some short-term selling pressure.