Home Blog Page 352

XRP Holders Could Become Millionaires, Billionaires, Trillionaires, and Quadrillionaires: Triblu Founder

0

Joshua Dalton, the founder of Triblu, predicts that XRP holders could become millionaires, billionaires, or even trillionaires.

The context of his prediction is the potential use of crypto as a strategic reserve to address the U.S. national debt.

In January, President Donald Trump signed an executive order on cryptocurrency. The order establishes a national Bitcoin reserve. However, it also created a national stockpile for altcoins.

This has led to speculation that assets like XRP, Cardano, or Solana could also play a notable role in a U.S. national crypto reserve.

“XRP Is More Likely Than Bitcoin”

Meanwhile, Dalton caused a stir in the crypto space by claiming that XRP is a safer choice for a U.S. strategic reserve than Bitcoin. He expressed concern about Bitcoin’s anonymous creator, Satoshi Nakamoto, suggesting that the unknown identity could pose risks, especially if linked to foreign countries like China.

Dalton contrasts this with Ripple and XRP, praising the company’s U.S. origins. He argues that XRP’s American ties make it a more secure and reliable option for the U.S. government.

XRP Solving the U.S. National Debt Crisis

Dalton suggests that XRP could play a pivotal role in addressing the U.S. national debt, which currently stands at approximately $38 trillion.

Some industry leaders, such as VanEck’s lead researcher Matthew Sigel, have repeatedly argued that Bitcoin is the best solution for the U.S. national debt. Sigel once outlined a path for BTC to alleviate $14 trillion from the deficit back in April. Meanwhile, Dalton believes XRP may be a more realistic option.

On the other hand, Senator Cynthia Lummis proposed acquiring 1 million BTC to offset 80% of the national debt, roughly $30 trillion. For Bitcoin to achieve this, its price would need to reach $30 million per token. This is a 33,607% increase from its current price of $89,000.

However, proponents of XRP argue that the U.S. government could potentially use Ripple’s escrowed XRP reserve, which holds 34.4 billion tokens. To offset 80% of the national debt with this amount of XRP, the price per token would need to surge to $883. This requires a 46,168% increase from its current value of $1.91.

The Path to XRP Millionaires, Billionaires, Trillionaires, and Quadrillionaires

Dalton believes XRP holders could become millionaires, billionaires, trillionaires, or even quadrillionaires if the proposed strategic reserve materializes.

For example, a holder with 10,000 XRP tokens (currently worth about $19,100) could see their portfolio rise to $8.89 million. Notably, 179,546 wallets hold between 5,000 and 10,000 XRP.

Those holding larger amounts, like 1 million XRP, could see their portfolios rise to $889 million, nearing the $1 billion mark. Currently, 2,006 addresses hold between 500,000 and 1 million XRP.

Those approaching trillionaire status would need holdings of 1 billion XRP or more. According to XRP Rich List data, only 20 wallets hold 500 million to 1 billion XRP, and only 6 wallets hold more than 1 billion XRP. Most of these belong to Ripple, its founders, or crypto exchanges with large XRP reserves, such as Binance and Uphold.

XRP Rich List
XRP Rich List

Based on current XRP wallet holdings, no single wallet could realistically reach quadrillionaire status even if XRP reached $883. For that to happen, XRP would need to reach $1 million per coin.

Conclusion

Dalton’s claims are largely hypothetical. The likelihood of the U.S. establishing a crypto reserve with XRP is slim. Furthermore, the government has indicated that it will focus on creating a strategic reserve for Bitcoin only. Other cryptocurrencies like XRP, Cardano, and Solana may only fall under a general crypto stockpile.

Moreover, the government cannot simply take over Ripple’s escrowed XRP for reserve purposes. Even if it could, this would not automatically drive XRP’s price to $883 to offset the national debt.

Essentially, while the idea of XRP holders becoming millionaires, billionaires, trillionaires, or quadrillionaires is intriguing, it is extremely unlikely under the current scenario.

Pundit: Never Predicted XRP to Reach $1,000 in 2025, Says Facing Backlash for Predictions Never Made

0

XRP community figure Zach Rector has moved to clarify claims circulating online that he predicted XRP would reach $1,000 this year.

In a recent post on X, Rector stated that he never made a $1,000 XRP prediction. He distanced himself from the claim and from other commentators whose forecasts have drawn backlash.


This comes as the year winds down and XRP is trading under $2. Accordingly, widely promoted forecasts of double-digit, triple-digit, and beyond have remained far from reality.

Amid this, some analysts have owned up to their failed predictions, revising their timelines. Meanwhile, ambitious forecasts of $100 and $1,000 are under heavy criticism. Rector has said the criticism directed at him is based on predictions he did not make.

He also clarified that he is not Jake Claver, whose failed price projections are at the center of recent criticism.

Backlash Across YouTube and Social Media

As XRP’s price continues to lag, criticism of XRP commentators has grown in YouTube comment sections and X social platforms.

YouTube user @20helson said many XRP influencers have lost credibility because they make repeated short-term promises that don’t materialize. They mentioned Jake Claver predicted XRP would reach $100–$700 by year-end, and said that constantly pushing back timelines hurts trust.

Another user, @TheCaptainsCorner64, questioned how these forecasts can be justified when they miss the mark by hundreds of dollars, saying it damages credibility, especially when tied to specific dates.

Jake Claver’s XRP Price Prediction

In March, Rector hosted crypto CEO Jake Claver on a podcast, where Claver discussed how XRP could potentially reach four-digit prices. He highlighted XRP’s role in global finance, citing projects such as R3’s Project Ion and the DTCC, which enable real-time settlement of digital assets.

Claver said that if XRP captured just 10% of SWIFT’s $5 trillion in daily transactions, its price could reach $50–$100. He added that limited supply and escrowed holdings could further support price growth.

He also noted institutional interest, including 17 XRP-related ETF filings, which could bring additional liquidity. While most of these ETFs are now live, the spot products have attracted over $1.1 billion in XRP investment. Yet the price remains low.

XRP etf records
XRP ETF records

Rector himself estimated ETFs could push XRP to $20–$30 in the near term, but the current price remains far off those levels.

Meanwhile, Claver further argued that in the event of a financial crisis, XRP could help stabilize markets, and that rising demand combined with limited supply could drive prices into the four-digit range.

Essentially, Claver’s analysis suggests XRP could far exceed current prices by the end of next year. But as the current year concludes, the price has continued to dip. Notably, Claver also famously predicted that the XRP price would reach $10,000 in “24 months.”

Rector Predicted $100 XRP in 2025

While Rector distanced himself from the $1,000 price outlook for 2025, he has made a similarly bold forecast of $100 by year-end, which has also attracted backlash.

Just last week, Rector revised his timeline for XRP reaching $100 to 2030. His earlier claim, made in November, drew attention for its aggressive optimism at a time when XRP’s price was already bearish.

Critics accused him of moving the goalposts and losing credibility. Some urge influencers to stop making specific price predictions altogether.

CryptoQuant Data Confirms Bitcoin Has Entered a Bear Market

0

The ongoing weakness in Bitcoin price may be more than a temporary pullback, according to new on-chain analysis from CryptoQuant. 

Woo Minkyu, a verified author on the platform, says market data is increasingly aligning with conditions of past bear market transitions.

BCMI Signals a Deeper Market Reset

Woo points to the Bitcoin Cycle Momentum Indicator (BCMI), which returned to the 0.5 zone on October 21. At the time, this move was interpreted as a normal cooling phase rather than a cycle top.

However, since then, Bitcoin’s price has declined by more than 30%, with BCMI falling alongside it. According to Woo, this confirms that the market has not only cooled over time but has also undergone a reset, as evidenced by both price action and on-chain momentum.

Bitcoin is currently trading at $86,900 after dipping 32% from its all time high of $126,198.

Why This Matters for BTC Market Direction

Historically, major Bitcoin cycle bottoms have formed when BCMI dropped into the 0.25–0.35 range. This occurred during the 2019 and 2023 lows.

At current levels, BCMI is already below its equilibrium zone but remains well above those historical bottom ranges. This suggests the market may still be in transition rather than at a completed reset point.

From a data-driven perspective, Woo explains that this setup raises the possibility that Bitcoin is entering a bear phase rather than experiencing a standard correction. If history holds, a more durable bottom may form only if BCMI revisits levels seen during previous bear market lows.

He stresses that this is not a price forecast but rather a scenario investors should be aware of under current market conditions.

Bitcoin Network Slows Down; Analyst Predicts $37,500 Bottom

Separately, CryptoQuant analyst GugaOnChain noted that Bitcoin network activity has been declining and speculative trading has eased. Both are common signs of a bear market.

Data shows fewer transactions, lower network fees, and a decline in highly active addresses. This suggests reduced demand for Bitcoin’s network and fewer large traders or institutions actively participating. These conditions often occur during quiet accumulation phases, when investors are cautious.

GugaOnChain noted that the current situation resembles the 2018 bear market, which was also characterized by low activity and low fees. However, Bitcoin’s network is significantly stronger today, with more users than at that time, which could help limit the extent of price declines.

Looking ahead, analyst Ali Martinez predicts that Bitcoin may not reach its final market bottom until around October 2026. He sees a possible decline of up to 70% to approximately $37,500. 

Overall, while Bitcoin’s network is displaying typical bear-market behavior, its larger user base may help mitigate the risk of an extreme downside.

Trend Research Buys 46,379 Ethereum, Quietly Closes In on Top Holders

0

Trend Research has joined the ranks of the largest Ethereum holders after a substantial ETH purchase expanded its holdings.

The private investment firm purchased 46,379 ETH across multiple transactions, thereby lifting its total holdings to more than 580,000 ETH, according to data from Arkham Intelligence.

Private Accumulation Rivals Public Ethereum Treasuries

With the latest purchases completed on Wednesday, Trend Research now holds more ETH than nearly all publicly listed companies tracked by CoinGecko. Indeed, only two firms — BitMine and SharpLink Gaming — report larger balances.

Specifically, SharpLink Gaming holds approximately 859,853 ETH, while BitMine Immersion Technologies controls more than 4 million ETH. These comparisons underscore how rapidly Trend Research has scaled its Ethereum exposure.

However, because the firm is privately owned, its holdings are not typically included in standard Ethereum treasury disclosures. Even so, its pace of accumulation has not gone unnoticed within the industry.

Connection to Jack Yi and Ongoing ETH Purchases

Trend Research is a secondary investment vehicle linked to Jack Yi, the founder of LD Capital. Blockchain data shows that ETH purchases associated with Yi began in October and have continued steadily since then.

Building on this activity, Yi posted on X on Thursday that Trend Research is preparing to deploy an additional $1 billion into Ethereum. In addition, he cautioned traders against shorting ETH, reinforcing the firm’s long-term, conviction-driven strategy.

JackYi's post on X
JackYi’s post on X

Growing Concentration as Market Sentiment Remains Fragile

Meanwhile, Trend Research’s accumulation reflects a broader pattern within the Ethereum ecosystem. Specifically, alongside BitMine and SharpLink, ETH ownership is increasingly concentrated among a small group of well-capitalized entities. The trend continues despite a broadly cautious market sentiment.

Looking ahead, BitMine plans to increase its position further, aiming to reach 5% of the total ETH supply. To support this strategy, the company intends to stake a substantial portion of its holdings through its “Made in America Validator Network.”

Commenting on this, Lacie Zhang, a research analyst at Bitget Wallet, noted that companies often accumulate ETH during market downturns. She explained that firms are increasingly seeking to convert idle treasury assets into yield-generating infrastructure rather than engaging in short-term trading.

Not All Ethereum Treasuries Are Expanding

While some firms continue to accumulate ETH, others are actively reducing their exposure. ETHZilla recently disclosed that it sold 24,291 ETH for approximately $74.5 million, using the proceeds to repay senior secured convertible notes. Consequently, the sale reduced its remaining balance to around 69,800 ETH.

Similarly, FG Nexus, a US-listed finance and insurance company, has been selling Ethereum to fund an aggressive share repurchase program.

According to Zhang, these sales are mostly about managing finances, not leaving the Ethereum market. Companies often sell crypto to handle debt or support their stock prices.

At the same time, these sales give opportunities for buyers who want to gain long-term influence in the Ethereum network. In effect, Ethereum is moving from firms with financial pressure to those with more resources.

XRP 3-day Chart Shows its Heading Towards $1.10 as XRP Loses Crucial Support

0

Market veteran Ali Martinez recently confirmed that XRP has lost a crucial support level, further identifying the next region to focus on.

The XRP price has continued to struggle since October, which marked the start of Q4. After soaring to a high of $3.1 earlier in October, XRP faced intense bearish pressure, courtesy of a broader market downturn that even pushed Bitcoin (BTC) below the $100,000 psychological support level.

Since then, XRP has seen rapid declines, having collapsed 34% in this quarter and lost the $2 support to trade at $1.86 as of press time. With XRP down 12.97% in December, the crypto asset is on track to record a third consecutive monthly loss for the first time since Q4 2022.

XRP Loses $1.9: Here’s the Next Major Support

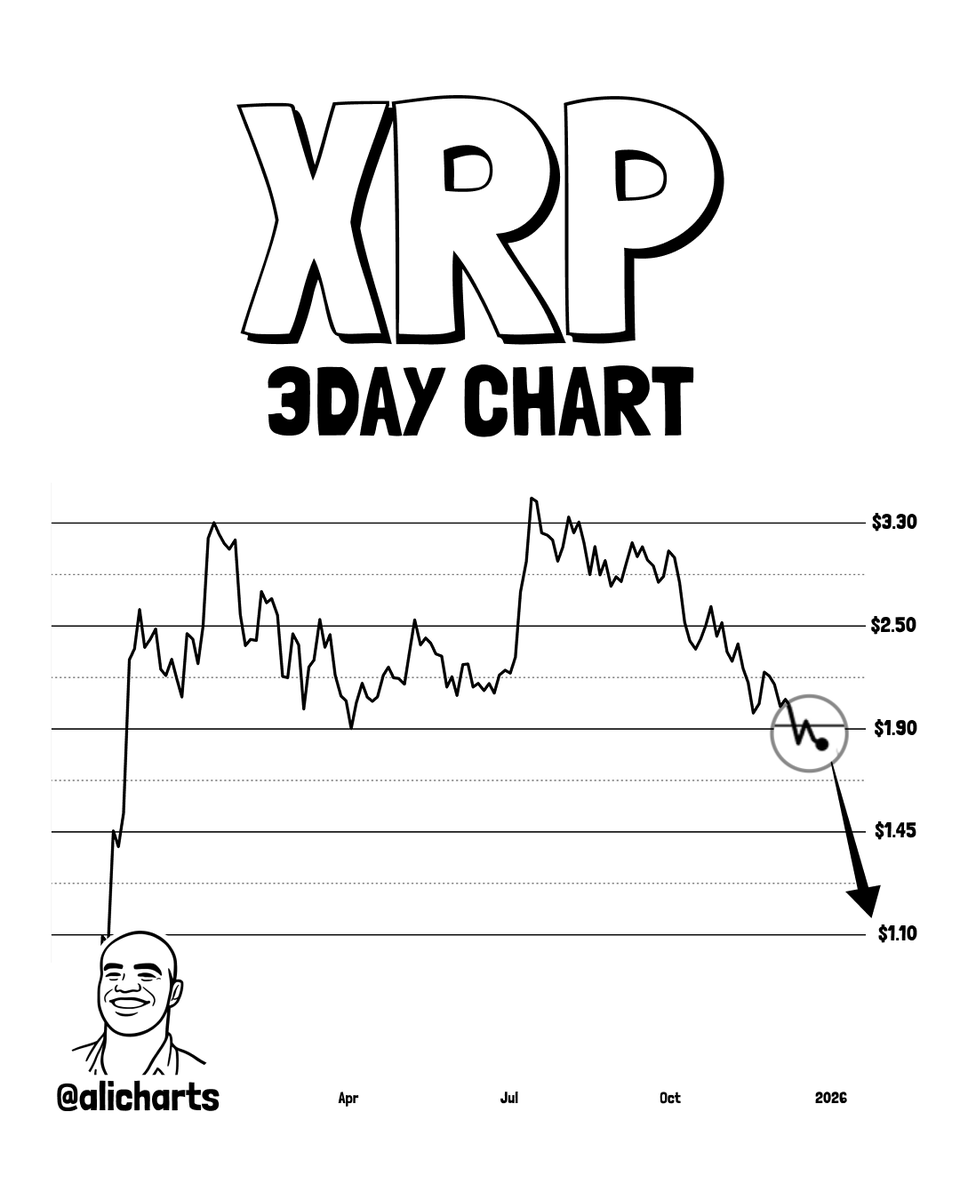
Meanwhile, market analyst Ali Martinez recently found indications that further declines may be on the horizon for XRP. In his recent analysis, Martinez called attention to an important support level on the 3-day XRP chart, which had acted as the next defense after the bears breached the $2 psychological level.

Specifically, this support rests on the $1.9 level. The bulls leveraged this area as defense in late November after days of persistent declines that began on Nov. 11. After hitting the $1.9 region, XRP recovered on Nov. 23, eventually soaring back above $2. However, on Dec. 15, the bulls lost $2 again, and XRP relied on $1.9 for support.

XRP 3D Chart Ali Martinez
XRP 3D Chart | Ali Martinez

However, according to Martinez, the bulls have lost $1.9, as XRP now trades around $1.86 after closing below $1.9. In his analysis, Martinez highlighted that the next support rests at $1.1. Notably, XRP has not revisited this price level over the past year, ever since it pushed above it in November 2024 on the back of the Trump-led rally.

For perspective, XRP would need to collapse by nearly 41% from the current price to hit the $1.1 low. Martinez’s latest disclosure comes three days after the market analyst identified another bearish on-chain signal in the XRP ecosystem. Specifically, he confirmed that active addresses had dropped from 46,000 to 38,500 within a week.

Opinions from Other Analysts

Meanwhile, analyst Crypto King noted that below $1.9, there exists another key support around $1.85, which XRP has continued to maintain. He expects a strong rebound from here to help XRP recover the $1.98 level, which would set the stage for a possible push to $2.58. From here, he believes there may be room toward the July 2025 peak of $3.66.

Another market watcher, CryptoXLarge, argued that XRP may face another support around $1.6, which aligns with the 0.618 Fibonacci retracement on the weekly chart. According to him, if XRP recovers and closes a week above $1.95, it could receive a boost to $2.3, and then $2.7. Meanwhile, the XRP ETFs recently logged another day of inflows, now boasting $1.13 billion in cumulative flows.

XRP 1W Chart
XRP 1W Chart

Shiba Inu Burn Activity Appears Dead as Large SHIB Burns Dry Up

0

The Shiba Inu burn mechanism, long viewed as a key driver of SHIB’s long-term price potential, is rapidly losing momentum as daily token burns continue to shrink.

For years, many investors have embraced Shiba Inu for its deflationary narrative. Supporters believed that sustained token burns would significantly reduce SHIB’s circulating supply and, over time, help fuel a significant price rally. 

That conviction once ran deep, with community members voluntarily sending tens of millions, and in some cases billions, of SHIB to dead wallets in hopes of accelerating scarcity and boosting price action. 

Shiba Inu Burn Lags 

However, fresh data suggests that this enthusiasm is waning. According to Shibburn, the Shiba Inu community burned a total of just 988,032 SHIB over the past 24 hours. 

Shiba Inu burnn
Shiba Inu burnn

Notably, the largest single burn during that period accounted for roughly 699,000 tokens, highlighting the slowdown in burn activity. The latest figure represents a steep 90.38% decline compared to the previous day, when about 10.27 million SHIB tokens were destroyed.  

Even this figure pales in comparison to the 30.6 million SHIB tokens an unknown user incinerated earlier this month. Moreover, these amounts are negligible relative to the massive individual burns recorded earlier this year, when single transactions sent billions of SHIB to the official dead wallet.

Ecosystem Burn Initiatives Underperform

Meanwhile, even ecosystem-driven burn initiatives have struggled to gain traction in recent months. The Shiba Inu team launched multiple ecosystem products to support SHIB’s deflationary narrative, including ShibaSwap, blockchain-based games such as Shiba Eternity, and, most notably, the Layer-2 network Shibarium, which serves as a central hub for activity. 

A core feature of Shibarium is its built-in burn mechanism. Under this model, 70% of the network’s base fees, initially paid in BONE, are used to buy and burn SHIB. The idea is straightforward: as adoption of Shibarium-based projects grows, a significant share of user fees would be redirected toward reducing SHIB’s supply.

To reinforce this effort, the team also launched a burn portal last year to automate the burn process. However, progress has fallen short of expectations, with 1 billion tokens destroyed via the portal as of May.

Despite these mechanisms, SHIB’s circulating supply remains enormous, at 589.24 trillion tokens at press time. 

So far, roughly 410.75 trillion SHIB tokens have been sent to the dead wallet since the project’s inception. Of that total, Ethereum co-founder Vitalik Buterin accounted for approximately 410 trillion tokens, while the broader Shiba Inu community burned the remaining portion.

In other words, more than four years have passed since Buterin’s burn effort, and the community has been unable to remove even one trillion SHIB from the circulating supply. 

Crypto Investor Says XRP Seems to Be Dying Slowly

0

XRP continues to face skepticism from parts of the crypto market amid technical rejection.

A widely followed crypto investor known as BATMAN has warned that XRP’s recent price action could signal corrections ahead.

XRP Faces Double Rejection on the Chart

According to the investor, XRP was recently rejected at two critical technical levels. He highlighted its long-standing bearish trendline and a previous support zone that has now flipped into resistance. BATMAN sees this double rejection as confirmation that sellers remain in control.

When former support fails to hold, and the price cannot reclaim it, analysts typically interpret this as a sign that bullish momentum is fading rather than building.

For context, XRP is trading at $1.85, showing negative metrics across all key time frames, including daily, weekly, monthly, and yearly. Notably, it is down 27% over the past two months and 34% over the last 90 days.

Analyst Toad commented on the trend, saying that XRP is exhibiting “absolutely shocking levels of poor technicals” at the moment.

Stochastic Indicator Flashes a Bearish Signal

Adding to the cautious outlook, BATMAN noted that the Stochastic oscillator has formed a death cross, a signal many traders associate with downside risk.

While stochastic death crosses do not guarantee further losses, they often occur during periods when the price struggles to regain strength after a failed rally.

The investor also stressed that markets do not always reward bullish positioning. In his view, contra-market setups, which are trades that move against dominant optimism, can sometimes serve as effective hedges when technical signals align to the downside.

“Fully Short on XRP”

Just last week, popular investor ChartFu announced that he is now completely bearish on XRP, citing expectations of lower prices. He suggested that favorable levels may come later, depending on market action.

Separately, angel investor Mike Alfred tweeted that XRP could go to zero if Bitcoin dips to $80K. While the outlook is highly speculative, it highlights a strongly bearish sentiment among seasoned investors.

It suggests that some traders believe XRP may continue to decline unless it can reclaim its lost technical levels.

XRP Community Remains Optimistic

Despite the bearish technical outlook, bullish optimism for XRP remains. Supporters are encouraged by XRP ETFs, which have seen consecutive days of inflows since their November launch, totaling $1.25 billion across five funds (Canary, 21Shares, Grayscale, Bitwise, Franklin).

XRP etf records
XRP ETF records

Explaining XRP’s recent price drop, Oliver Michel, CEO of Tokentus Investment AG, told DER AKTIONÄR TV that the decline is temporary.

He said the drop does not reflect Ripple’s strong business growth, including expansions, acquisitions, banking partnerships, and new products like stablecoins. Michel described Ripple’s ecosystem as an “Amazon-style” blockchain platform and expects the market price to catch up with its progress eventually.

Ultimately, while many do not expect a dramatic turnaround in the final days of 2025, the focus has now shifted to 2026. Some projections suggest XRP could reach $4 to $5 amid Ripple’s business expansion and ETF accumulation.

XRP Stoch RSI Drops to 0.0 for Second Time in History — Here’s What It Means

0

Market analyst Steph recently pointed out an interesting occurrence on the 3-week XRP chart, as the Stoch RSI drops to 0.0.

XRP has had a bearish three months since October, having collapsed 35% in the fourth quarter of this year, contributing to an annual drop of 10.39%. With this downtrend, XRP is now on track to record its first yearly loss since the 2022 bear market, when it crashed 59.13%.

XRP Flashes Rare Signal Amid Downtrend

However, amid the ongoing bearish price action, with XRP relinquishing the crucial $2 psychological support, analyst Steph (@Steph_iscrypto) recently called attention to an interesting event on the 3-week chart, which provides insight into how deep the downtrend has gone.

According to Steph, the Stochastic RSI indicator recently dropped to an absolute 0 on the 3-week XRP chart. For the uninitiated, the Stoch RSI is a momentum indicator that shows how strong an asset’s price movement is by measuring the RSI relative to its recent range. 

Notably, the indicator has a value range between 0 and 100 and typically spots overbought (above 80) and oversold (below 0) conditions and potential trend reversals more quickly than the standard RSI.

Specifically, when the Stoch RSI drops to lower values, it signals weakening momentum and suggests the crypto token may be oversold, increasing the chance of a short-term bounce or reversal. Since XRP’s downward trend began, the indicator has continued to drop on multiple timeframes.

Stoch RSI Drops to 0

Interestingly, while anything below 20 represents oversold conditions, the Stoch RSI has collapsed to 0 on XRP’s 1-week and 3-week charts. Steph paid closer attention to the 3-week timeframe, as it would take an incredibly bearish push to take the Stoch RSI to 0 on such a high timeframe.

XRP RSI on 3W Chart Steph
XRP RSI on 3W Chart | Steph

This event is so rare that the recent occurrence is only the second in XRP’s entire history. According to Steph, the first time this happened was during the 2022 bear market, when the XRP price eventually bottomed at $0.28 in June 2022 amid the contagion from the Terra ecosystem collapse.

While this marked the bottom in 2022, Steph chose not to make any predictions. However, he suggested that this event could indicate that selling pressure was near exhaustion already. According to him, this shows that the downside momentum has dried up, but it doesn’t confirm that a bullish reversal would emerge soon.

Notably, when the Stoch RSI collapsed to 0 during the 2022 bear market, XRP still traded within a consolidation phase for months before it eventually staged a recovery. “These signals tend to mark cycle lows, not short-term trades,” Steph concluded.

Pundit Predicts Bold New Timeline for XRP to Hit $100

0

A market expert has presented new timelines for XRP and silver to each reach a three-digit valuation.

This year, XRP and silver (XAG) have had contrasting price performances. While XRP has struggled throughout the fourth quarter of the year alongside the rest of the crypto market, silver has followed in gold’s footsteps, up 54% this quarter, with an impressive 149% gain in 2025. 

Despite XRP’s underperformance, which has seen it decline 10.73% this year, most community commentators remain confident in its long-term growth prospects. One such optimistic commentator is Zach Rector, a financial market pundit. 

In a recent disclosure, Rector presented price predictions for silver and XRP, suggesting that both assets, which some XRP proponents have persistently compared against each other, could someday reach the ambitious $100 milestone. 

XRP to $100 by 2030

According to Rector, XRP has the potential to hit $100 by 2030, about five years from now. Notably, this would represent an incredibly tough journey for the crypto asset, which currently changes hands at $1.85, having given up the pivotal $2 support level and recently flipped it to resistance.

From the current price of $1.85, XRP would have to rise by an audacious 5,305% to hit the $100 level. While this looks unattainable in the near future, most investors who advocate for this price often point to XRP’s explosive run during the 2017/2018 cycle. 

Specifically, during this period, XRP spiked from $0.003 to $3.31, representing an over 66,000% increase in less than a year. Notably, the rally from the current price to $100 would mark only a 12th of the 2017 upsurge. 

However, what most of these investors fail to consider is the law of diminishing returns, as XRP’s ability to rally by such high margins has since weakened. This applies to every crypto asset, which saw rapid spikes in prices during its early days. 

In addition, XRP now has a higher market cap, demanding more capital influx for any substantial price increase. Despite this, analysts like Rector remain confident that the $100 price could materialize in the next five years. However, Changelly believes XRP would only reach a maximum price of $16.65 by December 2030.

XRP Price Prediction Changelly
XRP Price Prediction | Changelly

Silver to $100 by 2026

Meanwhile, Rector suggested that silver may claim the $100 price level next year, 2026. Notably, the precious metal has a better chance of reaching $100 than XRP due to its current position. For context, while XRP has collapsed 35% this quarter, silver has gained an impressive 53%. On a broader scale, silver has risen 148% this year, now trading for $71.6.

At its current price, the precious metal would have to increase by a mere 39% to hit $100 per ounce, which would represent a new all-time high. At the current price of $71.6, silver has a market cap of around $4.027 trillion. If it claims the $100 mark, its valuation will rise to $5.62 trillion. Interestingly, Robert Kiyosaki, author of Rich Dad Poor Dad, believes silver could reach $200 next year.

Bitcoin Analysis for Dec 24: BTC Needs to Hold Support, but Analyst Says True Test at $98.5K 

Bitcoin faces downward pressure and must hold key support levels, with an analyst highlighting the true test for a momentum shift.

Bitcoin (BTC) is currently experiencing some downward pressure, trading at $86,729 after a 0.8% drop in the last 24 hours. Over the past 7 days, Bitcoin has decreased by 0.3%, and a more significant drop of 6.4% has been seen over the last 14 days.

This reflects the broader market weakness and concerns, including upcoming events such as initial U.S. jobless claims and market closures during Christmas, which may reduce liquidity and heighten volatility. If Bitcoin fails to hold the current levels, further declines may follow, especially as liquidity issues persist during the holiday period.

Will Bitcoin Fall Further?

Checking technical indicators, Bitcoin is currently testing a critical support level, as seen in the Fibonacci retracement chart. The price is hovering above the 0.236 Fibonacci level at $86,835, suggesting that this level is currently providing support. A breakdown below this level could push the price further down toward the next support at $84,440, aligning with the 0 Fibonacci level.

Bitcoin 1-Day Price Analysis

On the other hand, the immediate resistance rests at the 0.382 level around $88,317. If Bitcoin can break above this resistance, the price could aim for the 0.5 level at $89,415 or further up to $90,711 at the 0.618 Fibonacci level. This range offers a clear path for both bullish and bearish scenarios.

Further, the Chande Momentum Oscillator (ChandeMO) is currently at 6.39, suggesting a neutral to slightly positive momentum for Bitcoin in the short term. However, since it has surged above 0 from levels around -65, the market sentiment is likely recovering. 

If Bitcoin can hold its current support levels and break above the immediate resistance, it might see a short-term recovery. Otherwise, continued downward movement could occur if Bitcoin closes below the 0.236 Fibonacci support.

Real Bitcoin Test is at $98.5k

Elsewhere, Titan of Crypto, an analyst on X, has observed Bitcoin trading within two key liquidity zones between $80,701 and $94,595. To shift the market’s momentum, he notes that the price must first reclaim the Kijun line (represented in blue on the chart), break the ongoing downtrend line, and successfully move above the Kumo cloud. 

BTC Prediction
BTC Prediction

He further emphasizes that the true test for Bitcoin will come when the price attempts to break the $98.5k level. To reach $98.5K from the current price of $86,729, Bitcoin would need to surge by approximately 13.6%.