XRP price surged sharply this week as the coin underwent notable structural changes, with institutional investment products expanding.
Moreover, activity on the XRP Ledger is growing, while stablecoin liquidity continues to build, according to $11 billion asset manager 21Shares.
In a recent post on X, 21Shares said the XRP ecosystem is experiencing shifts that were not present at the same scale a year ago. It pointed to settlement volumes, an expanding stablecoin base, and the development of regulated investment products providing exposure to XRP.
The asset manager highlighted four key structural shifts identified by its research team.
The share peaked above 50% in May, highlighting the role of regulated investment products in XRP’s supply-and-demand dynamics.
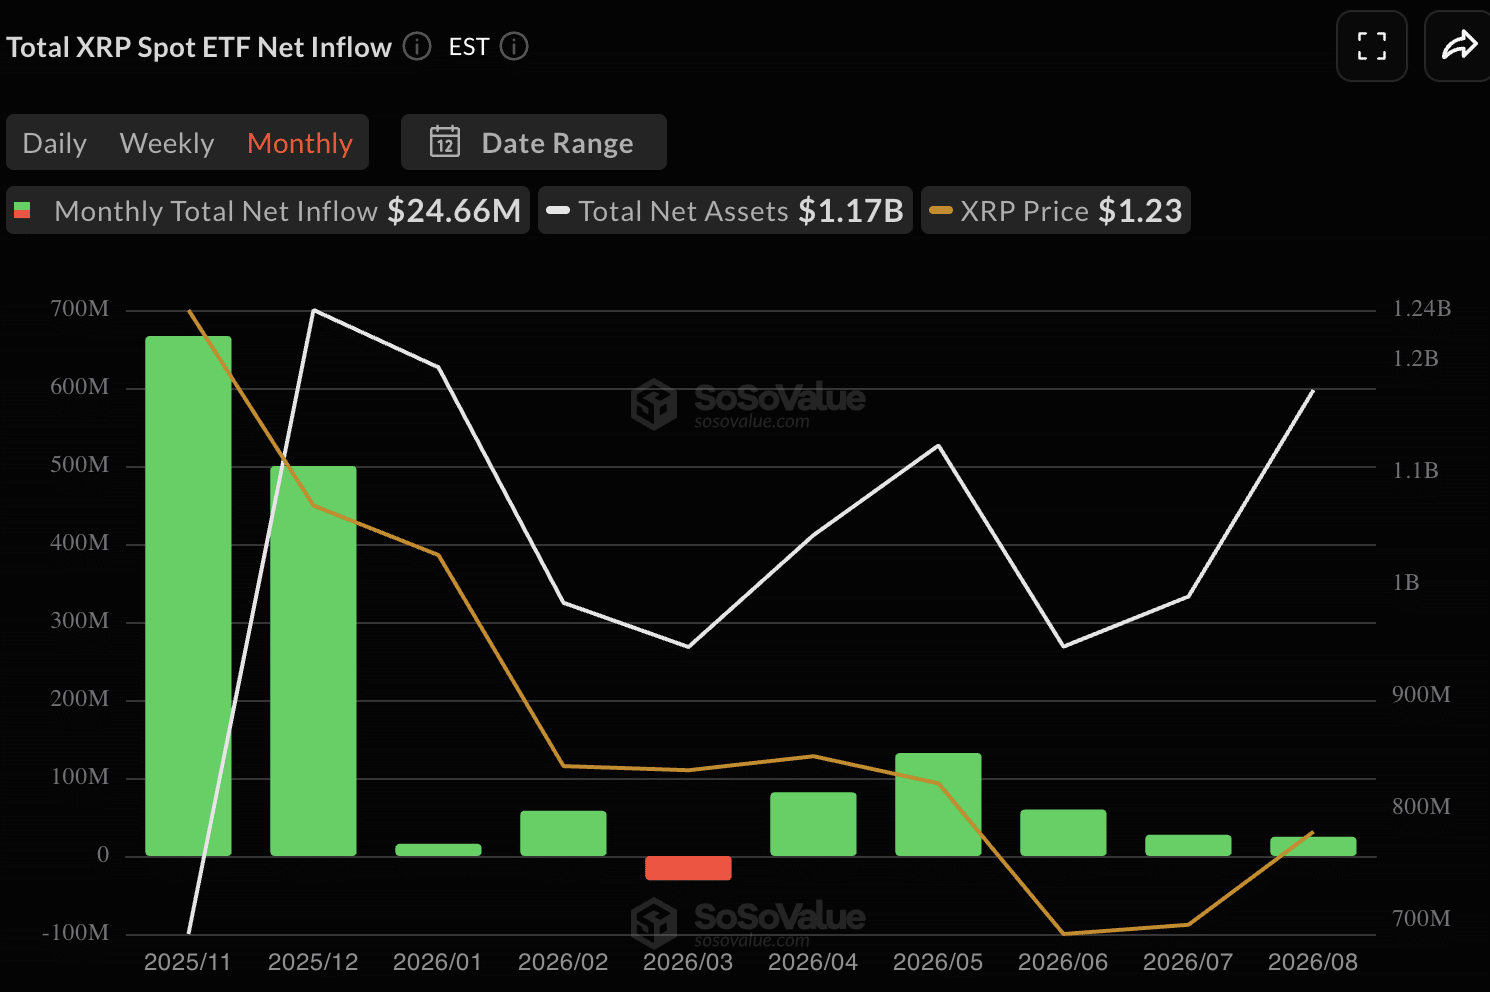
For context, since the start of the year, XRP ETFs in the U.S. have attracted $367 million in inflows. They now boast $1.17 billion in total assets and $1.53 billion in cumulative inflows.
XRP ETF Records | SoSoValue
XRP Supply Dilution Remains Lower Than Some Rivals
Meanwhile, 21Shares also pointed to XRP’s relatively modest annual supply dilution. The asset manager estimates XRP’s annual supply dilution at approximately 5.5%, compared with 8.8% for Stellar’s XLM and 9.6% for Toncoin (TON).
A lower rate of supply expansion means less new XRP enters the market, which could be bullish.
RLUSD Expands XRP Ledger Liquidity
Stablecoin liquidity represents another major structural shift. 21Shares said RLUSD’s supply expanded by 1,131% through June 30, 2026, with more than half of the stablecoin’s supply residing on the XRP Ledger.
RLUSD’s rapid growth strengthens liquidity and supports activity across the XRPL ecosystem as stablecoin transactions and applications expand.
Settlement Volume Rises While Fee Revenue Falls
The fourth shift identified by 21Shares concerns the relationship between XRP Ledger activity and revenue. The asset manager noted that settlement volume has expanded even as fee revenue has contracted.
21Shares ultimately raised a question for the XRP market: Could greater use of XRP as collateral materially change these supply-and-demand dynamics?
XRP Price
At press time, XRP was trading at $1.36, according to CoinMarketCap data. The token had surged approximately 20% over the previous 24 hours, briefly touching $1.40. XRP was up around 38% over the past week after trading near $0.988 earlier in the week.
The latest move adds to a sharp recovery in XRP, while 21Shares’ analysis points to structural developments beyond price action that could influence the asset’s longer-term supply, demand, and utility dynamics.
Cardano has recorded a sharp increase in network activity, with daily transactions climbing significantly over the past 24 hours.
According to data highlighted by blockchain fundamentals platform Chainspect, the network processed more than 24,000 transactions on Wednesday, marking its highest daily throughput of the previous week.
Cardano Transaction Volume Chart
The momentum has continued, with Cardano’s daily transaction count rising another 33% over 24 hours to 32,841 at press time. At press time, the network was processing 0.38 transactions per second, with an average block time of 20.2 seconds.
Chainspect currently records 303,143 commits for the network, placing Cardano among the leading blockchain ecosystems by development activity. However, the exact ranking can fluctuate as the underlying data changes.
Polkadot remains ahead with more than 701,000 commits, while Ethereum has recorded over 520,000. Nevertheless, Cardano ranks ahead of several major ecosystems, including Arbitrum and Optimism, which currently have roughly 200,000 and 182,000 commits, respectively. This comes as Cardano continues to work on major projects, including Ouroboros Leios, Hydra, and RealFi.
Cardano DeFi Activity Gains Momentum as ADA Nears $0.21
Meanwhile, Cardano’s DeFi sector has also shown signs of renewed activity, according to data from DeFiLlama.
The network’s total value locked (TVL) has increased 6.05% over the past 24 hours to $58.01 million. Additionally, decentralized exchange volume has climbed 22.42% over the past week to $9.15 million.
These gains come as ADA records a notable price recovery amid a broader market rally. Cardano is currently trading near the $0.21 level. Over the past 24 hours, ADA has surged 13.08% to $0.2082, extending its monthly gains to 21.35%.
Despite the strong recovery, Cardano remains the 15th-largest crypto by market cap, with a valuation of $7.6 billion. At the same time, its trading volume has jumped 52% over the past day to $804.78 million.
The combination of rising transaction activity, sustained developer engagement, stronger DeFi metrics, and ADA’s latest price gains highlights growing momentum across the Cardano ecosystem.
Strategy Inc, formerly MicroStrategy, has added approximately $7.8 billion to its market capitalization in two trading sessions as Bitcoin’s recovery above $72,000 reignited demand for crypto linked equities.
MSTR closed at $92.52 on Tuesday before surging 12.68% to $104.25 on Wednesday. With the stock trading near $113 on Thursday, it has risen approximately 22% from Tuesday’s close.
Using Strategy’s approximately 384.23 million outstanding shares, the rally lifted its estimated market capitalization from about $35.5 billion to $43.4 billion.
The primary catalyst is Bitcoin, which climbed roughly 12% in two days and reached an intraday high near $72,475.
Strategy holds 840,447 BTC, making its stock one of the equity market’s most sensitive Bitcoin proxies. At $72,000 per Bitcoin, that position is worth approximately $60.5 billion.
When Bitcoin was trading around $64,300 earlier this week, the same holdings were valued near $54 billion. The crypto rally has therefore added roughly $6.5 billion to the market value of Strategy’s Bitcoin treasury even though the company did not purchase additional coins.
More importantly, Bitcoin is now approaching Strategy’s average acquisition price of $75,385. That has rapidly reduced the paper deficit on a position that cost the company approximately $63.36 billion.
This narrowing gap is a significant angle behind MSTR’s outperformance. Bitcoin rising toward Strategy’s cost basis reduces concerns that an extended crypto downturn could force the company to sell additional coins to meet its preferred stock dividends and interest obligations.
Why Is the Crypto Market Pumping?
Several macroeconomic, regulatory and market structure developments converged to trigger the rebound.
First, the U.S. Treasury increased the permitted size of its long duration bond buyback operations from $2 billion to at least $4 billion. The announcement briefly lowered long term yields and improved demand for risk assets.
Second, President Donald Trump renewed his call for Congress to advance the Clarity Act, which seeks to establish clearer regulatory boundaries between the Securities and Exchange Commission and the Commodity Futures Trading Commission. The political push strengthened expectations of a more favorable U.S. framework for digital assets.
Bitcoin’s break above $70,000 also forced traders betting against the market to close their positions. The resulting short squeeze contributed to billions of dollars in crypto liquidations and accelerated the rally.
The move was not limited to Bitcoin. Ether, XRP and other major digital assets posted double digit advances, while Coinbase, Bitcoin miners and other crypto sensitive stocks also rallied. That broader participation suggests MSTR’s advance was part of an industry wide risk on move rather than an isolated stock event.
Strategy Cash Position Adds Another Bullish Factor
Strategy also entered the rally with a larger liquidity buffer.
Of those proceeds, $149.1 million was added to Strategy’s dollar reserve, taking it to $4.8 billion. The company also used $52.4 million for preferred dividends and $132.2 million to repurchase STRC preferred shares.
The $4.8 billion reserve is intended to cover preferred stock dividends and interest expenses. Its expansion gives Strategy more flexibility to manage its obligations without immediately selling Bitcoin during market weakness.
However, the way the reserve was funded also highlights MSTR’s principal risk: dilution. Strategy continues to issue common stock to finance its capital structure, meaning a rising Bitcoin treasury value does not always translate into an equal increase in Bitcoin exposure per MSTR share.
MSTR Outlook
MSTR’s two day rally is primarily a balance sheet repricing rather than a response to new software revenue, a fresh Bitcoin purchase or an earnings surprise.
Bitcoin’s jump from approximately $64,000 to above $72,000 substantially increased the value of Strategy’s treasury and moved the cryptocurrency closer to the company’s $75,385 average acquisition price. Short covering, improved regulatory sentiment, lower yields and Strategy’s larger cash reserve then amplified the stock’s advance.
The rally could extend if Bitcoin holds above $70,000 and challenges Strategy’s cost basis. However, a reversal in Bitcoin, renewed pressure on Treasury yields or further aggressive MSTR issuance could quickly weaken the bullish setup.
For now, two consecutive gains have restored nearly $8 billion of Strategy’s market value and turned MSTR and MSTRB into two of the strongest beneficiaries of the latest crypto market rebound.
Walmart shares plunged almost 9% Thursday, erasing approximately $81.2 billion from the retailer’s market capitalization after its weakest U.S. comparable sales growth in six years raised concerns about consumer demand.
WMT traded near $104.10 at 12:23 p.m. ET, down $10.20 from Wednesday’s $114.30 close. The stock fell as low as $102.85 during the session, briefly recording a double digit decline.
Based on Walmart’s approximately 7.96 billion outstanding shares, the $10.20 decline removed an estimated $81.2 billion from its market value. The company’s capitalization fell from roughly $910 billion to around $829 billion on an implied basis.
The selloff was not caused by an earnings or total revenue miss. Walmart exceeded both expectations. Investors instead focused on slowing growth inside its core U.S. retail operation and a weaker than expected forecast for the current quarter.
Walmart’s U.S. Sales Miss Breaks Five Year Streak
Walmart generated quarterly revenue of $187.94 billion, representing a 5.9% increase from the previous year and exceeding the approximately $186.82 billion expected by analysts.
Adjusted earnings reached $0.81 per share, beating the $0.74 consensus estimate. Operating income increased 28.8% to approximately $9.4 billion, although that result benefited from a $2.9 billion tariff refund.
The weakness appeared inside Walmart U.S., where comparable sales excluding fuel increased only 2.6%. Analysts had expected growth of approximately 3.7% to 3.8%.
The result marked Walmart’s first U.S. comparable sales miss in more than five years and its slowest growth rate since 2020. Comparable sales had increased 4.1% during the preceding quarter.
Customer traffic rose only 1.5%, slowing from 3% in the previous quarter. That slowdown indicated that Walmart’s recent price reductions had not yet produced the stronger customer growth expected by investors.
Falling Pharmacy Prices Weigh on Comparable Sales
Lower prescription drug prices were a significant drag on Walmart’s U.S. performance.
Federal Medicare pricing changes reduced revenue within the retailer’s health and wellness operation. Excluding that business, Walmart’s U.S. comparable sales would have increased approximately 3.4%.
That adjusted figure would still have fallen below Wall Street’s forecast, but it shows that pharmacy deflation accounted for a meaningful portion of the reported slowdown.
Higher fuel prices also pressured lower income households, leaving them with less money for discretionary purchases. Management said fuel related expenses were expected to exceed its original annual forecast by more than $2 billion.
Walmart has reduced prices on approximately 11,000 products and plans to use most of its $2.9 billion tariff refund to support further grocery and general merchandise discounts through the end of the year.
Those reductions could help Walmart defend or expand its market share. However, continued price investment also creates uncertainty about near term profit margins.
Weak Third Quarter Forecast Overshadows Higher Annual Guidance
The largest disappointment came from Walmart’s third quarter outlook.
The retailer expects quarterly sales growth of between 3% and 3.75%, considerably below the approximately 4.9% expected by analysts. Adjusted earnings are projected at $0.62 to $0.64 per share, compared with Wall Street’s forecast of around $0.67.
Walmart nevertheless raised its full year sales growth forecast to between 4% and 5%. It also increased its adjusted earnings guidance to between $2.80 and $2.87 per share.
However, the midpoint of the earnings range remains below the approximately $2.90 analysts expected. Investors consequently looked past the higher annual forecast and concentrated on the weaker immediate outlook.
Walmart’s official fiscal 2027 second quarter earnings materials showed that the company remains profitable and continues expanding overall revenue. The concern is the pace of future growth rather than a current operating loss.
Walmart’s Online Business Remains Strong
Not every part of Walmart’s business slowed.
Global e-commerce sales increased 23%, including 24% growth in the United States. Walmart Connect, the company’s U.S. advertising business, expanded 43%.
The results demonstrate that Walmart continues attracting online customers and building higher margin businesses outside conventional store sales.
However, that growth was not enough to offset concerns about the rare comparable sales miss, slower customer traffic and cautious spending among lower income households.
WMTon Falls 10.7%
Walmart’s decline quickly spread to the tokenized stock market.
Walmart’s Ondo tokenized stock, WMTon, traded near $104.79 after falling 10.7% over 24 hours. The token moved between $104.34 and $117.47 during the period.
WMTon recorded approximately $692,000 in trading volume, representing an increase of about 56% from the previous day. Its circulating market capitalization stood at approximately $2.11 million, based on around 20,146 tokens.
The token was also trading about 22.5% below its May all time high of $135.25, according to CoinGecko.
WMTon’s market capitalization represents only the value of the circulating token supply. It should not be confused with Walmart’s corporate market value.
Verdict for WMT and WMTon
Walmart’s decline is primarily a reaction to slowing growth inside its core U.S. business rather than weak headline earnings.
Revenue, adjusted earnings, e-commerce and advertising all increased. However, the rare comparable sales miss, slower traffic and below consensus third quarter forecast challenged the premium valuation investors had assigned to Walmart.
Pharmacy deflation explains part of the slowdown, while the company’s growing digital and advertising operations remain important strengths.
Nevertheless, Thursday’s approximately $81 billion market value loss shows that investors are placing greater importance on future consumer demand than on one quarter’s revenue and earnings beat.
The crypto market is now on an explosive price run, with Bitcoin, Ethereum, and XRP hitting multi-week highs after several months of disappointing performance.
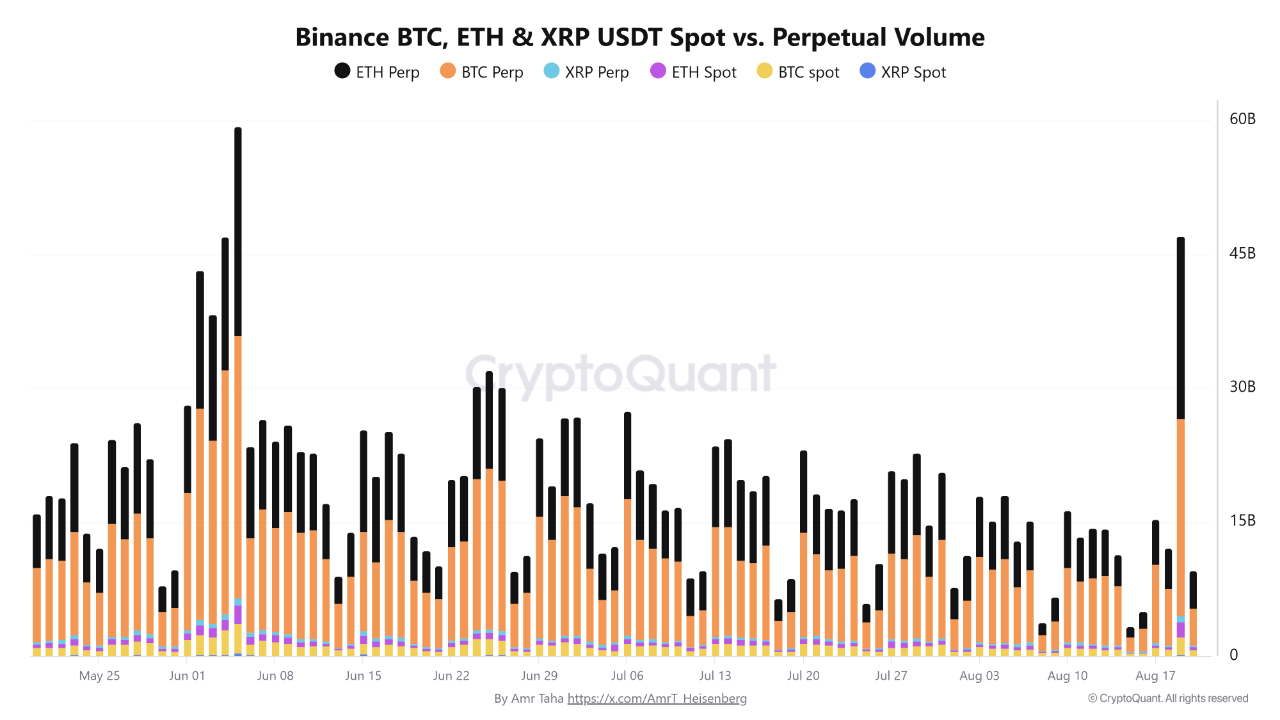
Notably, the trigger happened yesterday, August 19, as trading activity surged across top exchanges like Binance. In particular, combined spot and perpetual trading volume of BTC, ETH, and XRP reached $46.6 billion, according to CryptoQuant data.
The latest spike marked the highest combined trading volume since June 5, when activity reached roughly $59.4 billion. Yet, the August 19 total remained about 21.5% below that peak as Bitcoin broke higher and regained momentum.
Perpetual Markets Drive Trading Surge
Perpetual contracts accounted for most of the activity, generating about $42.7 billion, or 91.7% of the combined volume.
Bitcoin perpetual volume led the market at approximately $22 billion, followed by Ethereum at $20 billion. XRP perpetual volume reached roughly $718 million.
Spot markets added another $3.85 billion. This included about $1.96 billion in BTC volume, $1.69 billion in ETH volume, and $198 million in XRP volume.
Essentially, perpetual trading activity was roughly 11 times larger than spot volume, highlighting the dominant role of derivatives in the latest market move.
Chart for Bitcoin, XRP, Ethereum Spot and Perpetual Volume | CryptoQuant
Bitcoin Breaks Above $71,500; XRP and Ethereum Follow
The surge in trading activity coincided with a sharp Bitcoin rally. BTC broke above $70,000 today for the first time since June. Notably, just yesterday, it traded at $64,400 but has soared by more than 12% to $72,307 at press time.
The increase in volume suggests the breakout was due to stronger market participation, particularly in leveraged perpetual markets.
Meanwhile, the momentum spilled into the altcoin market almost immediately, with many coins posting more impressive gains than BTC.
For instance, Ethereum has surged by 19.25% over the past day, reaching $2,285 and nearly erasing all the losses recorded over the last 90 days.
XRP has also surged by 16%, reaching $1.15 after touching $0.9800 last week. However, its 90-day performance still remains deeply negative, at a 15.35% decline.
Key Factors Helping Crypto Surge
Notably, the acceleration in crypto trading activity follows changes in the broader macroeconomic backdrop.
Yesterday, U.S. President Donald Trump welcomed top crypto and financial leaders for a meeting on the future of digital assets. These included executives from Ripple, Coinbase, Chainlink, Kraken, Robinhood, and Nasdaq, making the gathering a “who’s who” of finance, crypto, and technology.
Trump said his administration had “ended the war on crypto” and outlined its digital-asset agenda, including the Strategic Bitcoin Reserve, Digital Asset Stockpile, stablecoin legislation, and efforts to modernize financial rules for blockchain-based markets.
Meanwhile, the U.S. Treasury announced plans to at least double liquidity-support buybacks for longer-dated Treasury securities, increasing the previous maximum of $2 billion per operation to at least $4 billion, beginning September 9.
Longer-term Treasury yields subsequently declined, while the U.S. dollar weakened. U.S.-Canada trade tensions also showed signs of easing after Washington delayed planned 50% tariffs on Canadian imports for three days as negotiations continued.
With Bitcoin now trading above $72,200, stronger trading activity, a major BTC breakout, and shifting macroeconomic conditions could keep volatility high across the BTC, ETH, and XRP markets.
XRP price has surged 16% over the past day, climbing to around $1.15 after briefly falling to $0.98 last week.
Interestingly, the rebound has pushed the coin above a primary descending trendline that had capped its price since July 2025. The latest breakout may mark a major upset in the token’s long-running downtrend.
XRP Breaks Year-Long Bear Market Trendline
On X, market watcher Bird said XRP has “officially broken out” of the bear market trendline in place since July 2025. He cited more than a year of downward price action, arguing that the latest surge represents a decisive break from the trend.
The accompanying weekly chart shows XRP moving above a descending resistance line that began near the token’s 2025 peak and continued to guide its price lower through 2026. The breakout comes after XRP fell to approximately $0.98 last week before reversing sharply higher.
XRP weekly chart
XRP Reclaims the 50 EMA
Technical analyst ChartNerd also highlighted an important development on XRP’s daily chart. According to the analyst, XRP’s daily candle closed at $1.10, marking its first close above the daily 50 EMA in more than three months.
The move matters because the 50 EMA acted as a key technical barrier during XRP’s prolonged decline. Reclaiming the indicator signals that short-term momentum is shifting in favor of buyers.
ChartNerd has now posed a key question for XRP traders: What comes first — $1.50 XRP or $1.00 XRP?
That question reflects the sharp change in market momentum following XRP’s recovery from below $1.
More Bullish Calls
Analyst Michael XBT also expressed a strong bullish outlook for XRP amid the ongoing breakout. Since last week, when XRP price dipped under $1, he has urged XRP holders not to sell.
The last price action has now reinforced his outlook. Michael’s long-term chart highlights a large multi-year pattern, which he describes as a seven-year pennant approaching a breakout.
“History will repeat,” Michael XBT wrote, adding that he believes the current setup could fulfill his earlier bullish prediction.
Price Still Faces a Major Test
Despite the breakout, XRP’s broader performance remains considerably weaker than its latest 24-hour move suggests. The cryptocurrency’s sharp rebound has not yet erased its longer-term losses, with XRP still down approximately 15.35% over the past 90 days.
That makes the $1.10-$1.15 region an important area for bulls. Holding above the broken trendline and maintaining the 50 EMA reclaim could strengthen the case that XRP’s prolonged downtrend is ending.
Conversely, a failure to sustain the breakout could turn the move into another false breakout and reopen the possibility of a return toward the $1 level.
Meanwhile, the ongoing move is being supported by Bitcoin, which is now above $72,500. Provided BTC remains up, the environment could support higher prices for XRP.
Moderna shares plunged one day after their historic 177% rally, erasing approximately $14.2 billion from the biotechnology company’s market value as investors reassessed the valuation created by its cancer-treatment breakthrough.
MRNA traded near $138.89 at 10:31 a.m. ET on Thursday, down 20.35% from Wednesday’s closing price of $174.38. The stock fell as low as $136.35 during the session.
Based on Moderna’s approximately 399.24 million outstanding shares, the decline reduced its implied market capitalization from about $69.62 billion to $55.45 billion.
The reversal followed an extraordinary session in which Moderna stock surged 177%, climbing from Tuesday’s $62.96 close to $174.38 on Wednesday. It reached an intraday high of $176.66.
MRNAon Falls From $193 to $136
The volatility was even more dramatic in the tokenized market.
Moderna’s Ondo tokenized stock, MRNAon, reached an all-time high of $193.43 before falling to $136.20—a peak-to-trough decline of approximately 29.6%.
At the available snapshot, MRNAon traded near $139.84, placing it 27.7% below its record. The token had approximately $567,000 in 24-hour trading volume and a reported market capitalization of around $358,000.
That token-market-cap figure represents the value of the circulating MRNAon supply. It should not be confused with Moderna’s corporate market capitalization.
The widely circulated $62-to-$195-to-$136 price sequence therefore combines two different instruments. The $62.96 starting point was Moderna’s Nasdaq closing price, while the higher $193.43 peak and $136.20 low were recorded by MRNAon.
The pullback also coincided with MEXC listing MRNAON/USDT for spot trading at 09:00 UTC on August 20. The listing expanded the venues available to tokenized-stock traders during an exceptionally volatile period.
Moderna’s Rally Exceeded New Wall Street Targets
No new clinical setback was announced before Thursday’s decline. The reversal instead appears to reflect profit-taking and concerns that Wednesday’s rally pushed Moderna beyond even the most optimistic updated analyst valuations.
UBS raised its Moderna target to $150 while maintaining a Neutral-equivalent rating. Bank of America increased its target to $170 and upgraded the stock to Neutral.
Goldman Sachs lifted its target to $120 while retaining a Neutral rating, and Morgan Stanley increased its forecast to $89 while maintaining an Equal Weight recommendation.
Moderna’s Wednesday closing price of $174.38 exceeded all four targets, including Bank of America’s Street-high $170 forecast. That valuation gap gave investors a reason to secure profits after the stock nearly tripled in one session.
Even after Thursday’s decline, MRNA remained above the latest targets from UBS, Goldman Sachs and Morgan Stanley at the time of reporting. Google Finance showed an average analyst target of approximately $82.62, although estimates varied widely.
Detailed Phase 3 Results Remain Unreleased
The underlying clinical development remains significant.
Moderna and Merck said their Phase 3 INTerpath-001 trial met its primary recurrence free survival endpoint and a key secondary endpoint measuring distant metastasis-free survival.
The trial enrolled 1,137 patients with surgically removed, high-risk stage IIB-IV melanoma. It compared Keytruda alone with Keytruda plus Moderna’s personalized mRNA treatment, intismeran autogene.
Intismeran is individually manufactured using mutations identified in each patient’s tumor. The treatment is designed to train the immune system to recognize and attack cancer cells carrying those mutations.
However, Moderna and Merck released only topline Phase 3 findings. They have not disclosed hazard ratios, absolute recurrence rates or the complete numerical efficacy results.
The study will also continue evaluating overall survival. Detailed results are expected to be presented at a medical conference and discussed with regulators.
What Comes Next for MRNA and MRNAon?
Moderna’s decline represents a valuation reset following an unusually aggressive rally—not evidence that its experimental cancer treatment has failed.
At $138.89, MRNA remained approximately 121% above its August 18 closing price. MRNAon was still up about 129% over seven days despite trading nearly 28% below its record high.
The next major catalyst will be the complete Phase 3 dataset, followed by regulatory discussions and clarity regarding a potential approval timeline.
Until those details arrive, MRNA and MRNAon could remain highly volatile. Wednesday’s rally priced in substantial commercial expectations before investors received the trial’s complete numerical results.
Alphabet owned Waymo has revealed new details about the computing system powering its robotaxis.
The disclosure, published on August 20, provides the clearest look yet at the onboard computer responsible for processing information from Waymo’s cameras, lidar and radar.
Waymo’s custom application-specific integrated circuit, or ASIC, performs front-end processing that cleans and combines sensor data before sending it through the vehicle’s broader artificial intelligence system. Its 1,000-TOPS performance is equivalent to one quadrillion operations per second.
However, the ASIC is only one part of Waymo’s wider computing architecture. The company also named AMD, Micron, Nvidia, Samsung, SanDisk, Socionext and TSMC as hardware suppliers supporting the platform.
Waymo Custom Chip Does Not Eliminate Nvidia or AMD
Waymo is developing the most specialized parts of its autonomous driving computer internally, but it is not attempting to manufacture the entire system itself.
The company said it concentrates its engineering resources on real-time sensor fusion and front-end machine learning, where tight integration between hardware and software can improve latency and efficiency.
For other workloads, Waymo combines its custom silicon with third-party CPUs, GPUs, accelerators, memory and storage technology.
The seven named suppliers collectively operate across those semiconductor categories. However, Waymo did not identify which components each company provides, disclose contract values or reveal expected purchasing volumes.
The announcement should therefore not be described as seven newly signed partnerships or major new semiconductor orders. It confirms that these companies participate in Waymo’s hardware supply chain but does not quantify the potential financial benefit to any individual supplier.
Waymo Onboard Computing Power Has Increased Twentyfold
Waymo’s broader onboard computer is designed around responsiveness, durability and redundancy.
The system must process sensor information within milliseconds while withstanding road vibrations, temperature extremes and continuous operation. It is also designed to remain compact and nearly silent so that the hardware does not disrupt the passenger experience.
Redundant computers operate in parallel, allowing a backup system to take over if the primary system fails.
Waymo has increased its onboard computing capacity twentyfold over the past eight years, according to details reported by The Verge.
Much of Waymo’s model training and simulation still occurs in data centers. However, immediate driving decisions must be made inside the vehicle because sending sensor data to the cloud would introduce unacceptable delays and connectivity risks.
Alphabet Gains Control Without Building Every Component
Waymo’s hybrid approach gives Alphabet greater control over the parts of the system that differentiate its autonomous-driving technology without requiring it to recreate every processor, accelerator and memory component.
That balance could become increasingly important as the robotaxi fleet expands.
Waymo currently operates approximately 4,000 vehicles across more than 10 cities and completes around 500,000 paid trips each week. A larger fleet will require substantial quantities of onboard computing hardware, potentially creating a growing market for the semiconductor suppliers involved.
However, vehicle volumes remain the critical variable. Without details about component content, pricing or procurement commitments, investors cannot calculate how much revenue Waymo may generate for AMD, Nvidia, Micron, Samsung, SanDisk, Socionext or TSMC.
Sixth Generation Waymo Driver Moves Toward Mass Production
Waymo is preparing to deploy its sixth-generation Driver across multiple vehicle platforms.
The purpose built Ojai robotaxi is the first vehicle scheduled to debut the sixth-generation system. Waymo has also designed the technology for integration into the Hyundai IONIQ 5.
The latest generation uses a streamlined sensor configuration and pushes more processing into custom silicon, helping Waymo reduce hardware complexity and costs while maintaining multiple sensing methods.
Waymo said its factory in Mesa, Arizona, is scaling toward the capacity to integrate tens of thousands of autonomous vehicles annually. That figure represents potential manufacturing capacity not current production volume.
The company’s Ojai expansion update said the new vehicle would initially become available to selected riders in San Francisco, Phoenix and Los Angeles before expanding into additional markets.
What the Disclosure Means for Alphabet and Chip Stocks
The new details strengthen Alphabet’s autonomous driving narrative by showing that Waymo controls a critical part of its computing stack.
Custom silicon could improve performance, reduce latency and lower hardware costs as Waymo moves toward larger-scale deployment. At the same time, the supplier list shows that Waymo’s vertical integration does not remove established semiconductor companies from the robotaxi opportunity.
The disclosure is therefore strategically positive for Alphabet and potentially supportive for the seven named suppliers. Nevertheless, it is not evidence of new contracts or immediately material semiconductor revenue.
The financial impact will depend on how quickly Waymo expands its fleet, how much hardware each vehicle requires and which suppliers capture the largest share of future production.
Ask the XRP community what the CLARITY Act would do, and the answers tend to fall into two camps.
One says XRP is still waiting on legal clarity, and that the bill is the moment its commodity status finally gets settled. The other says that was already handled in March, when regulators named XRP a digital commodity, and that the legislation is now mostly symbolic.
Both are half right, and the half each one misses explains why the September vote matters less than people think, and more than people think, at the same time.
Where things stand after March
On 17 March 2026, SEC Chairman Paul Atkins and CFTC Chairman Michael Selig announced a joint interpretive release setting out how federal securities laws apply to crypto assets.
This was not a staff memo, which is what most earlier crypto guidance amounted to. The release binds both agencies, and it names 18 major cryptocurrencies as examples of digital commodities, XRP among them alongside Bitcoin (BTC), Ether (ETH) and Solana (SOL). It also replaces earlier staff statements, including the SEC’s 2019 framework for investment contract analysis.
For an asset that spent four years at the centre of an SEC lawsuit, that is a real shift, and it settles the first claim. XRP has held a formal federal commodity classification since March.
Why that classification is less settled than it looks
The second claim is harder to dismiss, until you look at what the SEC itself has been saying.
On 18 August, the agency proposed a new set of rules for crypto fundraising, built on the March guidance. Announcing it, Atkins made a point that got less attention than the rules themselves. He said laws passed by Congress remain essential, because only they are durable enough to stop the agency’s current work from being undone by a future regulator.
That is the man who signed the March classification saying it could be reversed. An interpretation is an agency’s reading of the law, not a change to the law. The March release leaves the Supreme Court’s Howey test in place and changes how it gets applied. The law underneath has not moved. What changed is how two agencies say they will read it, and a future Commission could read it differently.
There is a simpler point too. The industry does not act as though the question is closed. More than 200 crypto firms spent this year pushing the Senate for a law. Nobody lobbies that hard for something they already have.
Two separate things in one bill
Most coverage treats CLARITY as a classification bill, which undersells it.
The classification part is real. It would move XRP’s status from something two agencies decided into something Congress wrote down, changeable only by Congress. But the bill also builds market oversight that does not currently exist. Today the CFTC can pursue fraud and manipulation in commodity spot markets, but it does not supervise them. CLARITY would give it proper authority over digital commodity spot trading, including a registration system for exchanges, brokers and dealers, capital and record-keeping requirements, and a rule that customer assets sit with approved custodians.
Right now, US spot crypto venues have no federal regulator overseeing them. For the institutions everyone keeps waiting on, knowing what XRP is only answers half the question. The other half is whether they can hold it somewhere their own rules allow.
What the flow data shows
There is something close to a live test running. XRP has a favorable court ruling, a federal classification and seven US spot ETFs. If regulatory clarity alone were enough to bring in institutional money at scale, it should be visible by now.
It isn’t. The funds have taken in $1.51 billion since launching, but $666 million of that arrived in the first month. Across the first six months of 2026 they added roughly $329 million, and July brought just $27.29 million. In the week ending 8 August, net inflows came to $1.01 million.
That is still money coming in rather than going out, and it has been positive for four weeks running. The point is the size. A committed group of holders keeps adding small amounts, and no second wave has arrived behind them. What would bring one is platform-level allocation from wirehouses and model portfolios, and those committees tend to want rules that cannot be withdrawn by the next administration.
What the chart suggests
Trading Chart 20 August 2026
On the weekly timeframe, XRP has been tracking the broader crypto market lower, which is what usually happens. Most altcoins follow Bitcoin (BTC) for most of the cycle, and this move is no exception.
The more interesting detail is the weekly RSI, currently near 31.7. It has flattened out and appears to be forming a bullish divergence, making a higher low while price continues to make lower lows. That is not a signal that a bottom is in. It is a reason to pay attention.
Below current price, the 0.618 Fibonacci retracement on the log scale sits near $0.90. Beneath that, the 0.702 comes in around $0.75, which falls in the middle of what is often called the long reload zone, an area where longer-term buyers, bot and algos tend to rebuild positions.
XRP remains in a downtrend. But it is moving towards levels that have historically drawn longer-term interest, and that approach may coincide with whatever the Senate does in September.
What happens in September
The Senate returns on 14 September with a vote set for the 15th. Before the recess, Majority Leader John Thune filed cloture on the motion to proceed, which makes that a procedural vote rather than a vote on the bill. Passing it means the Senate has agreed to start debating. After that comes a 60-vote threshold, reconciliation with the Senate Agriculture and House versions, and a signature. Few expect all of it to happen this year.
None of that changes the underlying position. XRP’s commodity status is real and it can be undone, and if the statute stalls in September, it stays that way.
Trading XRP with PrimeXBT
For traders, the September vote is less about whether XRP suddenly becomes a commodity and more about how the market reacts to the next step in US regulation. A procedural win, a delay, or an unexpected setback could all create volatility around an asset already approaching technically important levels.
PrimeXBT, a global multi-asset broker and crypto assets service provider, gives traders a way to act on those moves through Crypto Futures on PXTrader 2.0, with the flexibility to go long or short depending on their market view.
PrimeXBT offers over 170 Crypto Futures, with competitive trading costs including a 0.01% maker fee and taker fees from 0.045%, which can fall as low as 0.015% with VIP Tiers program for high-volume traders. For market analysis and execution, PXTrader 2.0 combines TradingView-powered charts with a real-time order book, giving traders greater visibility into price action and market depth. Risk management is built directly into the trading experience, with adjustable leverage, Stop Loss and Take Profit controls, liquidation price preview, and a choice between cross and isolated margin, giving traders more control over their exposure as market conditions change.
Traders can deposit, withdraw and exchange crypto directly with PrimeXBT, or use their crypto as trading capital to explore opportunities across other markets, including CFDs.
As we approach September, XRP is one to watch closely, with upcoming developments potentially bringing new market moves and trading opportunities.
PrimeXBT is a global multi-asset broker and crypto asset service provider trusted by traders in more than 150 countries. The platform bridges traditional and digital markets within one integrated environment, redefining versatility and innovation in online trading. Clients can access Forex, CFDs on indices, commodities, shares, crypto, and Crypto Futures, as well as buy, store and exchange cryptocurrencies. This unified experience extends across both the native PXTrader 2.0 platform and MetaTrader 5, supported by advanced risk-management tools and a wide range of funding options in crypto, fiat and local payment methods. Since 2018, PrimeXBT has focused on empowering traders through broad multi-asset access, fair and transparent conditions, professional-grade technology and dedicated human support. By combining expertise, trust and a client-first approach, PrimeXBT sets a benchmark of excellence in the financial industry and provides traders with the tools they need to trade, grow and succeed with confidence.
Disclaimer: The content provided here is for informational purposes only and is not intended as personal investment advice and does not constitute a solicitation or invitation to engage in any financial transactions, investments, or related activities. Past performance is not a reliable indicator of future results. The financial products offered by the Company are complex and come with a high risk of losing money rapidly due to leverage. These products may not be suitable for all investors. Before engaging, you should consider whether you understand how these leveraged products work and whether you can afford the high risk of losing your money. The Company does not accept clients from the Restricted Jurisdictions as indicated on its website / T&Cs. Some products and services, including MT5, may not be available in your jurisdiction. The applicable legal entity and its respective products and services depend on the client’s country of residence and the entity with which the client has established a contractual relationship during registration.
Super Micro Computer says an independent board investigation found no evidence that its current senior management knew about an alleged scheme to divert export controlled artificial intelligence servers to China.
The review also found no evidence that Super Micro directly sold restricted products to known prohibited parties or locations. Most importantly for investors, investigators concluded that the company’s previously issued financial statements remain reliable.
However, the findings do not end the underlying criminal case or provide Super Micro with government exoneration. The company was not charged in the federal indictment, while the three individuals accused of participating in the alleged scheme remain subject to separate legal proceedings.
SMCI rose approximately 3% to $37.66 shortly after the Nasdaq opened Thursday, compared with its previous close of $36.58, according to Google Finance.
Super Micro Computer Tokenized bStock, SMCIB, traded near $38.40 after gaining approximately 3.8% over 24 hours.
Review Finds No Knowledge Among Current Senior Management
The investigation was overseen by Lead Independent Director Scott Angel and Audit Committee Chair Tally Liu. The independent directors retained Munger, Tolles & Olson to conduct the work, supported by forensic accounting consultant AlixPartners.
Investigators examined customer transactions identified in the federal indictment alongside transactions involving other customers that purchased export-controlled products.
According to the company’s completion announcement, the review found no evidence that current senior management knew about the alleged diversion arrangement or any actual diversion of restricted products.
That wording requires context. “Current senior management” does not include every person who held a senior position during the period covered by the allegations.
Yih-Shyan “Wally” Liaw, one of the three defendants, was a Super Micro senior vice president and board member before resigning and leaving the company in March. The review’s conclusion concerning current management therefore does not amount to a finding about every former executive connected with the alleged transactions.
The company also took disciplinary action against employees working in sales, technical support and business development. Some employees were terminated for violating company policies or its code of conduct.
Super Micro’s board adopted all recommendations intended to strengthen the company’s export-compliance program. Independent directors will oversee measures that have not yet been fully implemented.
The $2.5 Billion Figure Requires Context
The investigation found no direct sales to known restricted parties. However, federal prosecutors allege that the scheme was specifically designed to hide the product’s ultimate destination.
The Justice Department’s March indictment alleges that Liaw, Taiwan-based sales manager Ruei-Tsang “Steven” Chang and contractor Ting-Wei “Willy” Sun used a Southeast Asian company as an apparent end customer.
Prosecutors claim false documents identified the intermediary as the legitimate buyer. Servers were allegedly repackaged in unmarked boxes before being transported to China, while nonoperational dummy servers were staged to mislead inspectors.
The intermediary allegedly purchased approximately $2.5 billion of Super Micro servers during 2024 and 2025. That figure represents its total orders not a specific Justice Department finding that every server covered by those orders reached China.
Prosecutors separately alleged that at least approximately $510 million of controlled servers were diverted to China during a three-week period between late April and mid-May 2025.
All those claims remain allegations. The defendants are presumed innocent unless proven guilty, and Super Micro itself is not named as a defendant or co-conspirator.
The board review materially reduces the risk that current management knowingly approved the alleged transactions. It does not independently disprove prosecutors’ claim that individuals deceived Super Micro’s compliance team and government inspectors.
The Financial Finding Is the Main Development for SMCI
Super Micro’s August 11 results warned that the export control review could affect its forecasts, preliminary figures and prior period financial statements.
The company reported fiscal 2026 revenue of $39.1 billion and net income of approximately $2.23 billion. An investigation finding that export related transactions required accounting adjustments could therefore have created another major financial reporting problem.
The review’s conclusion removes that specific threat. Super Micro says the transactions examined did not produce an identified adjustment to previously issued financial statements.
However, its fiscal 2026 results remain preliminary and unaudited. Super Micro said its financial closing procedures were incomplete and that its independent auditor had not audited, reviewed or compiled the figures when they were released.
The investigation’s completion should therefore be described as removing an export-related adjustment risk not as converting the company’s preliminary results into audited financial statements.
The 2024 Review Had a Different Scope
Super Micro completed a separate independent review in December 2024.
That investigation examined accounting concerns, related-party disclosures, sales practices and 11 export transactions. It found no evidence that anyone at Super Micro knowingly attempted to evade export restrictions or knew that products could be diverted to prohibited destinations.
The subsequent federal indictment alleges conduct occurring during 2024 and 2025. The two investigations were conducted by different independent directors, law firms and forensic consultants, and they may not have examined the same transactions or evidence.
The latest findings therefore do not necessarily conflict with the indictment. They address whether Super Micro’s current management knew about the alleged scheme and whether the examined transactions undermined its financial statements.
Separate government inquiries also remain outside the board review’s authority. Super Micro previously disclosed an SEC investigation and an additional subpoena received in April 2026, while Taiwanese authorities have separately investigated suspected server diversion.
SMCIB Trades Above the Underlying Stock
Binance market data showed SMCIB near $38.40, with approximately $609,500 in 24-hour trading volume. The token traded between roughly $35.77 and $38.76 during the period.
Compared with SMCI’s $37.66 regular-session price at the cited snapshot, SMCIB traded at a premium of approximately 2%.
That difference is not necessarily an arbitrage opportunity. SMCIB trades through a separate order book, covers different trading hours and can experience wider spreads or slower price adjustment.
SMCIB provides tokenized economic exposure linked to Super Micro stock. It is not the same security as a Nasdaq-listed SMCI share.
The Verdict
The investigation’s completion is moderately bullish for SMCI and SMCIB because it removes the immediate possibility that the board review would force adjustments to Super Micro’s previous financial statements.
It also supports the company’s position that its current senior management did not knowingly approve the alleged diversion arrangement.
However, this is a board-commissioned investigation not government exoneration. The federal criminal prosecution and separate regulatory inquiries remain unresolved, while the internal review itself resulted in disciplinary action across several departments.
Consequently, Super Micro’s immediate financial-reporting risk has declined, but its export-compliance, legal and reputational overhang has not disappeared.