Home Blog Page 5

Meta Stock Rises 2.6% as Binance Supports METAB Dividend Distribution

0

Meta Platforms (NASDAQ: META) shares rose 2.60% to $682.55 in pre-market trading on Monday at 05:14 a.m. ET, after closing 2.43% lower at $665.75 on Friday. No specific catalyst for the early stock move was independently confirmed.

The gain came amid broader strength in U.S. equity futures, with Nasdaq futures up about 0.95% and S&P 500 futures up about 0.62% during Asian trading.

Meta’s board declared a cash dividend of $0.525 per share on Sept. 10 for holders of its Class A and Class B common stock. The dividend is payable on Sept. 28 to shareholders of record as of the close of business on Sept. 21.

Sept. 21 is also Meta’s ex-dividend date. Investors who buy the shares on or after the ex-dividend date are not entitled to the Sept. 28 dividend.

The company has maintained the same $0.525 quarterly dividend rate during 2026. The payment represents an annualized dividend of $2.10 per share.

Meta Keeps Quarterly Dividend at $0.525 Per Share

Meta began paying a quarterly dividend in 2024 and increased the payout to $0.525 per share in 2025.

In its second-quarter 2026 results, Meta reported revenue of $60.80 billion, up 28% from a year earlier. The company made $1.35 billion in dividend and dividend-equivalent payments during the quarter and ended June with $90.26 billion in cash, cash equivalents, and marketable securities.

Binance to Support METAB Dividend Distribution

Binance said it will support the Meta dividend distribution for holders of Meta Tokenized bStocks, traded under the METAB symbol. Users holding METAB at a snapshot taken at 00:00 UTC on Sept. 21 are eligible for the distribution.

Binance said it will reinvest the net dividend amount into additional METAB units or fractional units after applicable withholding taxes, fees, costs, and other deductions. On-chain holders will receive the distribution through an adjustment to the bStock multiplier rather than a direct cash payment.

The exchange suspended METAB deposits and withdrawals at 23:30 UTC on Sept. 20 as part of the corporate-action process, while spot trading remained available. Binance’s announcement also covered dividend distributions for Broadcom, Invesco QQQ Trust, and Seagate tokenized bStocks.

Binance says bStocks are tokenized securities issued by BTech Holdings Limited and provide economic exposure linked to the underlying securities. Holders of Meta’s tokenized bStock do not directly own Meta common shares through the tokenized product.

METAB Trades Near $681

CoinMarketCap showed Meta Tokenized bStocks at about $681.32, up 2.07% over the previous 24 hours. Reported 24-hour trading volume was about $3.01 million, up 58.01%, while the tokenized stock had a market capitalization of about $3.77 million.

Meta Connect Scheduled for Sept. 23-24

Meta Connect 2026 is scheduled for Sept. 23 and Sept. 24. The company has said the event will include updates on artificial intelligence, AI glasses, and virtual reality, with Chief Executive Mark Zuckerberg scheduled to deliver the keynote.

XRP Floods into Binance at 663% Above Normal: What’s Happening?

0

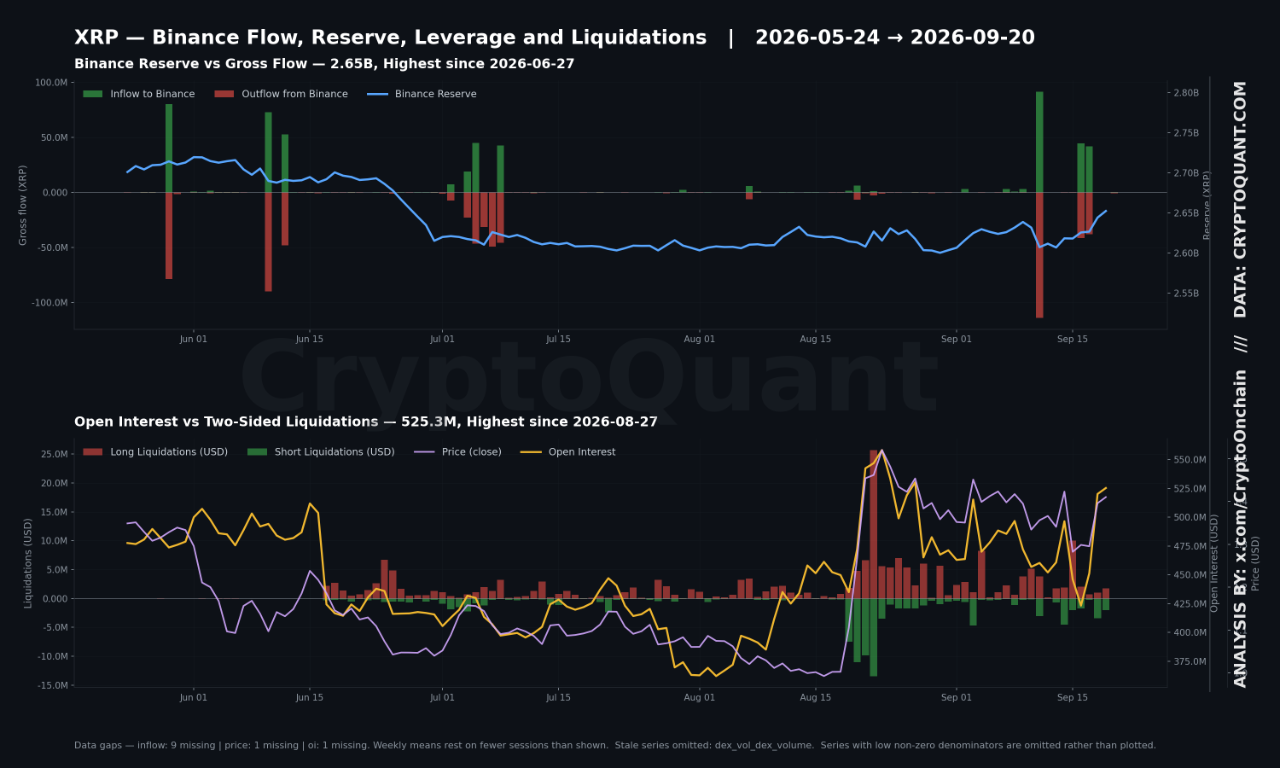
XRP exchange data showed an unusual spike during the week ending Sept. 20, as more tokens flowed into Binance.

Notably, Binance recorded average XRP inflows of 21,718,631 tokens per day, which stood 663% above the quarterly baseline. 

However, the increase did not continue throughout the week. Most of the activity came from three sessions that also fell around major regulatory and economic events.

XRP Inflows Concentrate Across Three Sessions

For context, the weekly data show no recorded XRP inflows on Sept. 12, 15, 18, or 19. In addition, Sept. 20 also had no recorded price, open interest, funding, or transaction data. 

This left three sessions responsible for most of the weekly average. Specifically, XRP inflows reached 91.2 million tokens on Sept. 11, 44.5 million on Sept. 16, and 41.7 million on Sept. 17.

XRP Binance Flow | Source: CryptoQuant

Moreover, The Crypto Basic reported on Sept. 18 that whale inflows to Binance over the previous 30 days had reached about 1.6 billion XRP. This marked the highest level since March 2026. 

Large-wallet transfers had declined steadily from May through July before flipping higher in August and rising in September. The change stood out as one of the quarter’s major on-chain developments.

Clarity Act Vote and Fed Rate Decision

Interestingly, the Sept. 16 and 17 inflow spikes came just after two major events. On Sept. 15, the U.S. Senate failed to move the Clarity Act forward after a 49-50 procedural vote. The bill sought to establish formal regulatory definitions for digital assets, including XRP.

Also, the Federal Reserve raised the federal funds target range by 25 basis points to 3.75%-4.00% on Sept. 16. The move marked the Fed’s first rate increase since 2023. Meanwhile, the 10-year Treasury yield closed the period at 4.96%.

XRP fell toward $1.27 during the Federal Open Market Committee session before recovering to close at $1.410 on Sept. 19. This makes the timing of the September 16 and September 17 inflows notable. 

One possible explanation, though the data do not confirm it, is that traders or large holders moved XRP between exchanges while adjusting their positions around the rate decision instead of preparing for outright selling.

Binance Sees Record Turnover

Meanwhile, further data shows that XRP moved in both directions during the period. Monthly inflows rose 457%, while outflows increased 167% from the previous period. Despite the rise in gross flows, Binance’s XRP reserve ended the week at 2,630,628,140 tokens.

The reserve stood just 0.22% above the quarterly baseline and 0.34% higher week-over-week. At the same time, XRP outflows averaged 11,565,238 tokens per day. The number of deposit addresses also averaged 788 per day, which was 129% above the quarterly baseline.

The rise in both inflows and outflows suggests that much of the activity involved XRP moving in and out of the exchange. In other words, the higher turnover did not lead to a major change in Binance’s net holdings. 

XRP Seeing Rising Leverage

Network activity remained relatively weak despite the increase in exchange flows. XRP’s NVT ratio fell 32.1%, while the transaction count declined 16.4%. This means network activity did not rise alongside the price recovery and higher exchange turnover.

In the derivatives market, open interest reached 477.1 million, up 9.4% from the quarterly level, while the estimated leverage ratio rose to 0.181, a 9.1% quarterly increase. Funding settled at 0.004 after doubling week-over-week, showing that long-biased traders faced higher costs for maintaining their positions.

Liquidations also hit both sides of the market. Short liquidations averaged 2.34 million XRP per day, up 199% week-over-week, while long liquidations averaged 2.93 million XRP per day.

XRP Maintains Weekly Recovery as 50-Week SMA Becomes Next Major Technical Level

0

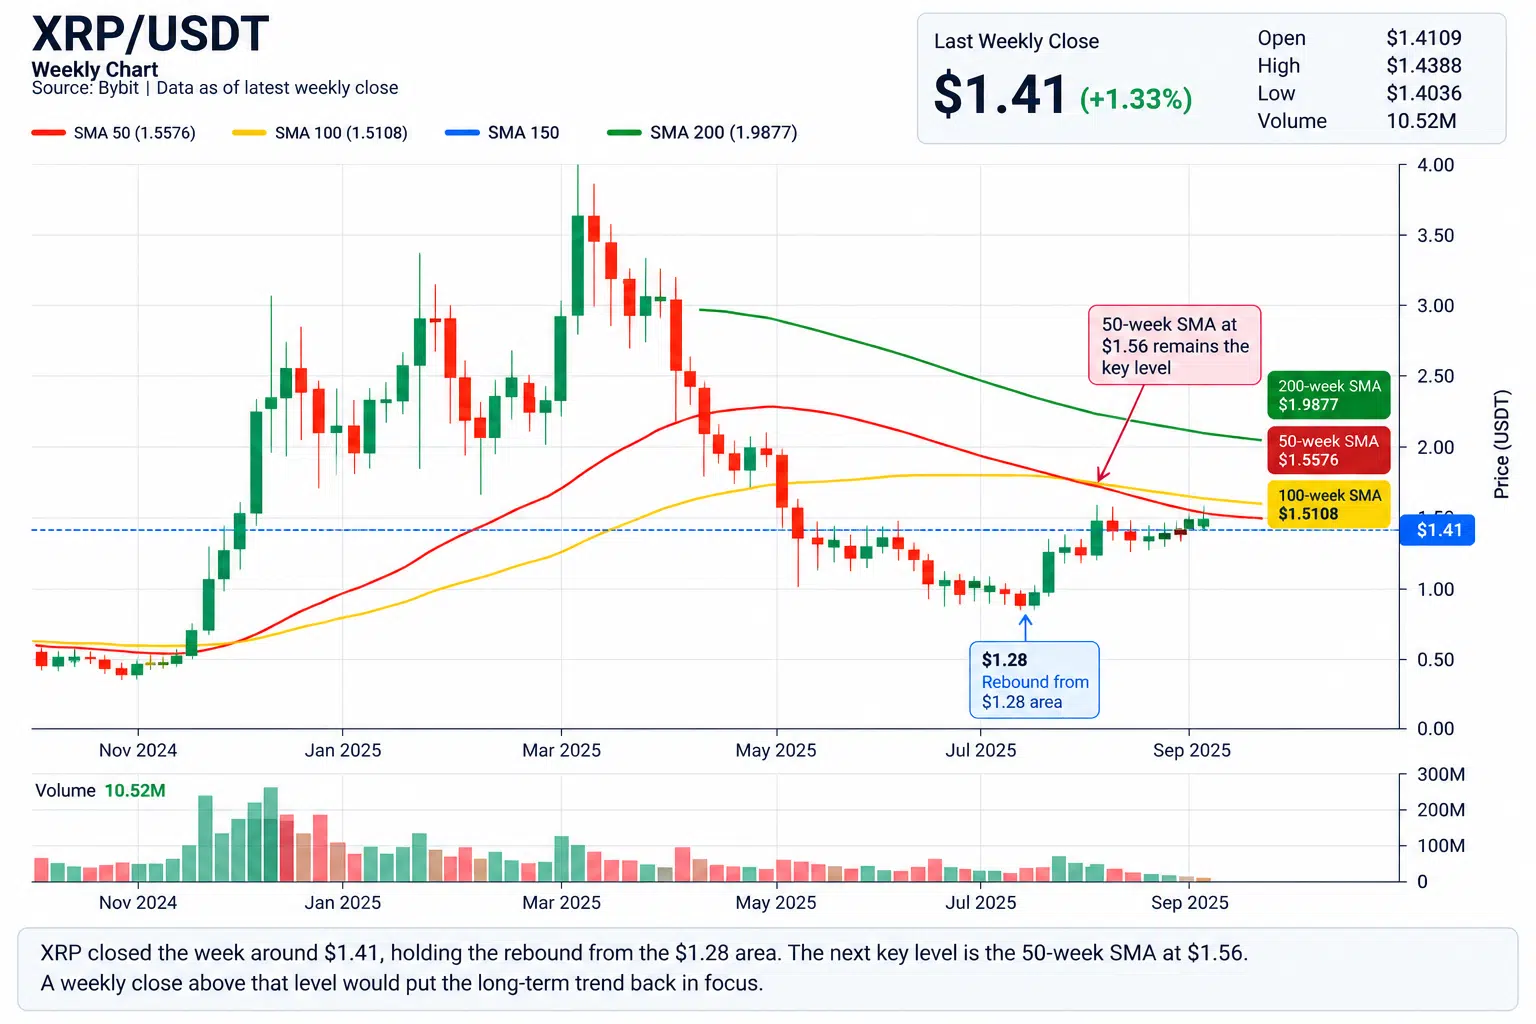
XRP Holds Weekly Rebound Near $1.41 as 50-Week SMA Stands at $1.56.

XRP closed the latest week around $1.41, maintaining most of its rebound from the $1.28 area, according to the weekly XRP/USDT chart. The move leaves the cryptocurrency below its 50-week simple moving average, which currently sits near $1.56.

The latest weekly candle opened at approximately $1.4109, reached a high of $1.4388 and a low of $1.4036, with the chart showing the price around $1.4297 after a weekly gain of about 1.33%. Reported weekly volume stands at approximately 10.52 million XRP.

XRP Remains Below 50-Week SMA

The 50-week SMA at roughly $1.5576 is the nearest major moving-average level displayed above XRP’s current price. From $1.41, XRP would need an increase of approximately 10.5% to reach $1.56.

XRP weekly chart and 50 Week SMA

The chart shows XRP trading below this moving average after a prolonged decline from its 2025 highs. XRP previously traded above $3.40 before entering a sequence of lower weekly highs and lower lows that eventually brought the price close to $1.00.

The recent rebound began after XRP briefly moved toward the $1.00 area. Price then recovered sharply toward $1.40 before entering a narrower weekly range.

Longer-Term Moving Averages Remain Overhead

The chart displays two additional long-term moving averages. One is positioned near $1.5108, while the 200-week SMA stands substantially higher at approximately $1.9877.

This creates a concentration of moving-average levels between roughly $1.51 and $1.56, immediately above the current market price. XRP is presently trading below both levels.

A weekly close above the $1.56 50-week SMA would represent a technical reclaim of that specific long-term moving average. It would also place XRP above the nearby $1.51 moving-average level shown on the chart.

200-week moving average around $1.99 would remain above price.

Latest Weekly Candles Show Consolidation

The five most recent weekly candles show XRP stabilizing after its sharp rebound from around $1.00. The largest candle in this sequence records the initial upward recovery, while the following candles have noticeably smaller bodies.

Several of the recent candles also contain both upper and lower wicks, showing that price moved in both directions during those weekly sessions before returning toward the $1.30–$1.40 region.

Based on the levels displayed, XRP currently sits around $1.41, with the nearby long-term moving-average cluster at approximately $1.51–$1.56 and 200 SMA moving average near $1.99.

Eleanor Terrett Reacts as XRP $1,000 Hype Posts Resurface

0

Crypto in America host Eleanor Terrett has highlighted the growing social media hype surrounding projections that XRP could eventually reach $1,000.

Terrett noted that her X feed had become dominated by debates over the failed CLARITY Act and bullish posts promoting the $1,000 XRP price target. Meanwhile, the projection gained renewed attention across X over the weekend.


$1,000 XRP Prediction Gains Momentum

The latest wave of speculation intensified after EasyA co-founder Dom Kwok suggested that an XRP price of $1,000 is now more plausible than ever.

Although Kwok’s latest post did not explicitly mention XRP, he has previously promoted the $1,000 target, including in April. As a result, his latest comments reignited discussion among both XRP proponents and critics.

Jake Claver, Chairman of Digital Ascension Group, also reacted to Kwok’s comments. He said he would pay attention to the prediction because of Kwok’s professional background and experience.

Similarly, other XRP supporters pointed to Kwok’s résumé, including his reported experience at Goldman Sachs and Circle and his involvement with EasyA. They argued that his background gives greater weight to his latest comments about XRP potentially reaching $1,000.

XRP’s Long-Term Valuation Question

The $1,000 target is not new to the XRP community. Similar projections have resurfaced several times in recent years. For example, in 2024, crypto exchange Uphold asked the XRP community what they would do if the asset reached the milestone.

However, the prediction has also faced criticism. Crypto analyst ChartNerd dismissed the $1,000 target as hype and urged traders to exercise caution when considering aggressive XRP price projections.

Similarly, XRP Ledger dUNL validator Vet argued that investors should focus more on the network’s adoption and development than on specific price targets. He said that growing XRP Ledger adoption in traditional finance could matter more than speculative price projections.

XRP to $1,000 Growth Requirement 

At press time, XRP traded at $1.4394, giving the coin a market capitalization of $89.8 billion.

At that price, XRP would need to surge by roughly 69,373% to reach $1,000. Moreover, assuming a circulating supply of approximately 63 billion XRP, the token would carry a market cap of around $63 trillion at the target price. The scale of that implied valuation has prompted questions about the feasibility of the projection.

Nevertheless, Kwok has previously pushed back against market-cap comparisons, arguing that such calculations do not necessarily capture an asset’s potential value. Meanwhile, some XRP proponents have pointed to the cryptocurrency’s potential role in cross-border settlement as a factor that could influence its long-term valuation.

Still, the $1,000 XRP target remains highly speculative and should not be interpreted as a guaranteed future price. 

Bitcoin Records First Weekly Close Above 50-Week Average Since November 2025

0

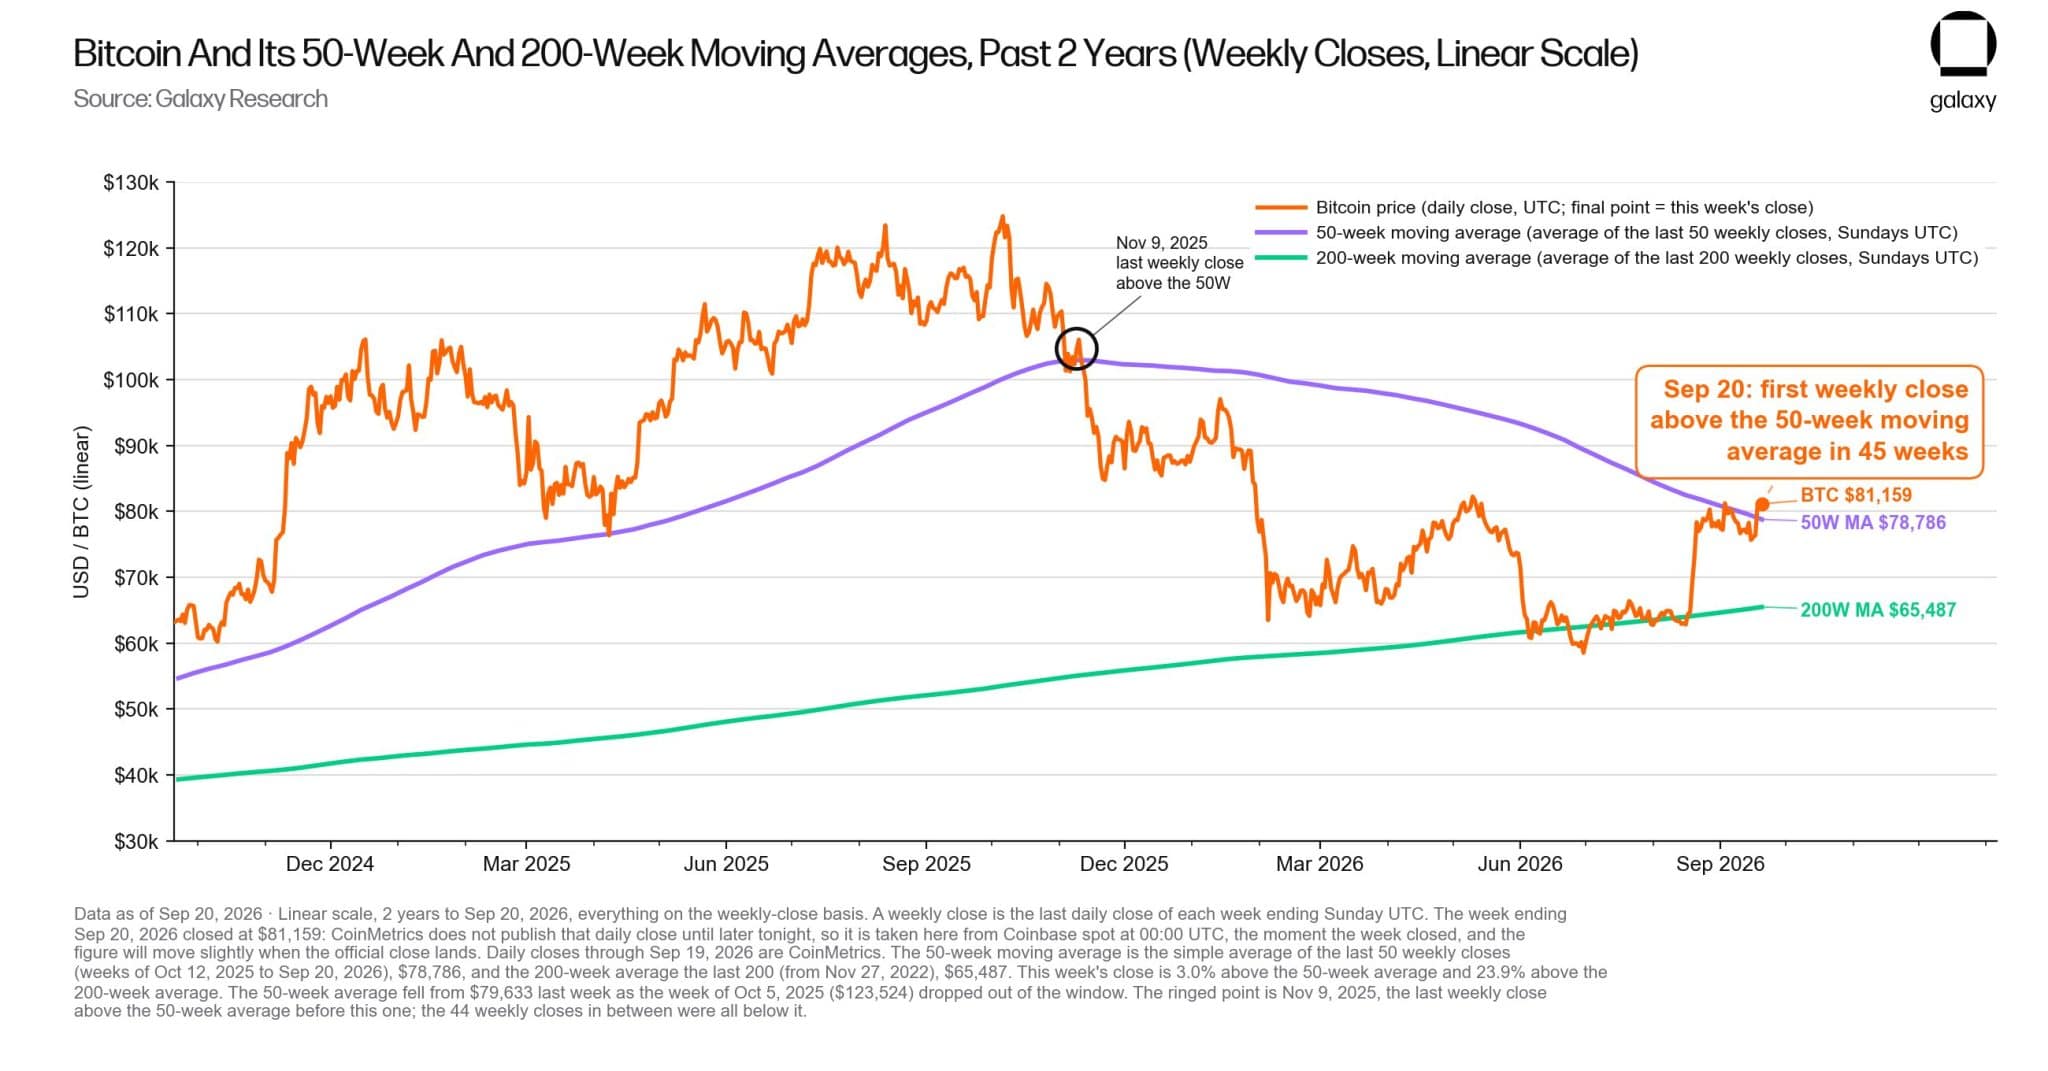
For the first time in 45 weeks, Bitcoin has closed above its 50-week moving average, following a 29% price increase over the past 35 days.

According to data from Galaxy Research, Bitcoin finished the week ending September 20, 2026, at $81,159, compared with a 50-week moving average of $78,786. That placed the weekly close approximately 3% above the long-term average. Bitcoin’s 200-week moving average stood at $65,487, about 23.9% below the latest weekly closing price.

The September 20 close ended a prolonged period below the 50-week average. Bitcoin’s previous weekly close above the indicator occurred on November 9, 2025, followed by 44 consecutive weekly closes below it.

Bitcoin and 50 week moving average
Bitcoin and 50-week moving average

Bitcoin Gains 29% in 35 Days

The moving-average reclaim follows a substantial recovery in Bitcoin’s price. BTC has risen approximately 29% over 35 days, climbing from around $62,900 in mid-August to more than $81,000 by September 20.

August accounted for much of the increase. Galaxy Research data shows Bitcoin began the month near $62,899 and ended around $78,852, representing an increase of approximately 25.4%.

The recovery followed a lengthy decline from Bitcoin’s 2025 highs. The Galaxy chart shows BTC trading above $120,000 during 2025 before falling below $100,000 and eventually reaching the low-$60,000 range in 2026.

Historical Record of the 50-Week Average

Galaxy Research’s historical analysis found that Bitcoin’s 50-week moving average has frequently acted as resistance during previous bear-market periods.

Galaxy’s historical review found 13 occasions since 2011 when Bitcoin regained its 50-week moving average, with BTC avoiding a new market low in 11 cases.

Several recoveries preceded major advances: roughly 600-fold after 2011, 100-fold following the 2014–15 downturn, 22-fold after the 2018 decline, and eightfold from the 2022 low. These figures describe Bitcoin’s historical performance following previous major market declines.

The 2021–2022 cycle was the exception, when Bitcoin temporarily moved back above the average before later setting a lower low.

As of September 20, Bitcoin’s $81,159 weekly close stands above both the $78,786 50-week moving average and the $65,487 200-week moving average, marking the first weekly recovery above the 50-week level since November 2025.

XRP Beats Bitcoin in August With a 30% Monthly Gain

0

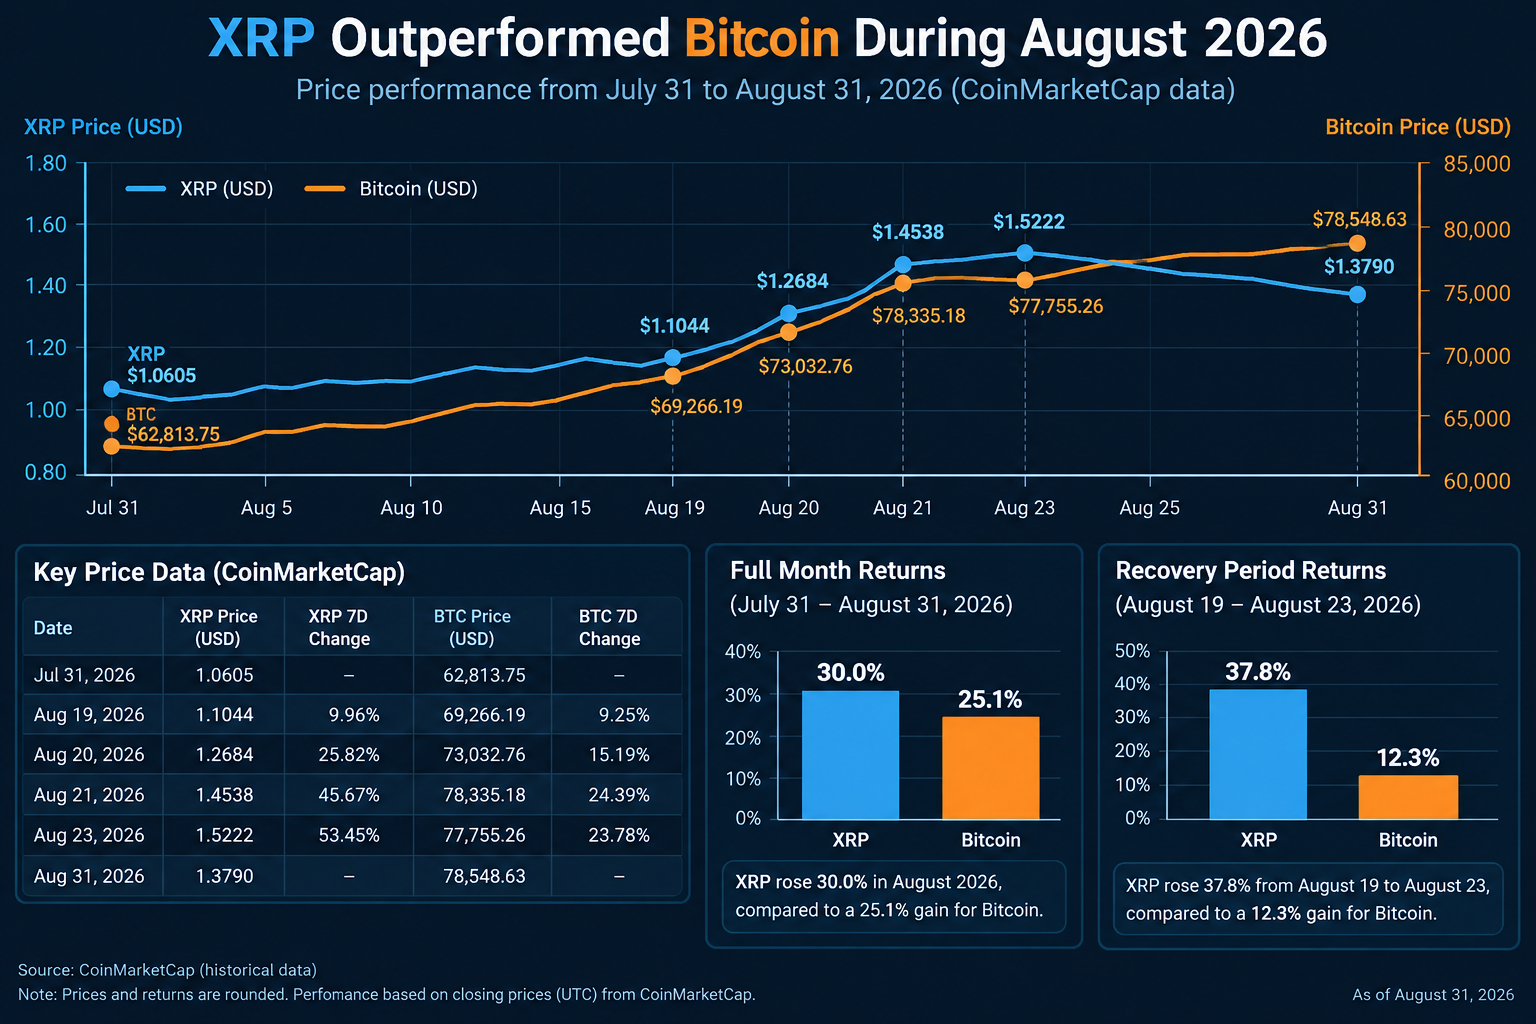
XRP Outperformed Bitcoin During August 2026 Crypto Market Recovery, CoinMarketCap Data Shows.

XRP recorded a substantially larger percentage gain than Bitcoin during the major crypto market recovery in the second half of August 2026, according to historical price data from CoinMarketCap.

XRP Outperformed Bitcoin Across August 2026

The outperformance was not limited to the August recovery window. Across the full month, XRP rose from $1.0605 on July 31 to $1.3790 on August 31, producing a gain of approximately 30.0%.

Bitcoin increased from $62,813.75 to $78,548.63 over the same period, representing a gain of approximately 25.1%.

That means XRP outperformed Bitcoin by roughly 5 percentage points during August, based on CoinMarketCap’s month-end snapshots.

XRP Outperforms Bitcoin in August 2026

The difference was considerably larger during the strongest part of the August recovery. Between August 19 and August 23, XRP rose about 37.8%, compared with approximately 12.3% for Bitcoin. XRP subsequently pulled back from its August highs but still finished the month with a larger percentage gain than Bitcoin.

On August 19, CoinMarketCap recorded XRP at $1.1044, up 10.29% in 24 hours, while Bitcoin stood at $69,266.19, up 7.09%. XRP’s seven-day return was 9.96%, compared with Bitcoin’s 9.25%.

XRP Gains Accelerated as Bitcoin Recovered

The performance gap widened on August 20. XRP reached $1.2684, posting a 14.85% 24-hour increase and a 25.82% seven-day gain. Bitcoin rose to $73,032.76, representing gains of 5.44% over 24 hours and 15.19% over seven days.

By August 21, XRP had climbed further to $1.4538. Its seven-day gain reached 45.67%, while Bitcoin traded at $78,335.18 with a seven-day increase of 24.39%. XRP’s seven-day percentage gain was therefore approximately 21.3 percentage points greater than Bitcoin’s.

The difference expanded again by August 23. CoinMarketCap recorded XRP at $1.5222, up 53.45% over seven days, compared with Bitcoin at $77,755.26, up 23.78% over the same period. XRP outperformed Bitcoin by approximately 29.7 percentage points on that seven-day measurement.

XRP Rose About 38% From August 19 to August 23

Using CoinMarketCap’s daily snapshots, XRP increased from $1.1044 on August 19 to $1.5222 on August 23, a gain of approximately 37.8%. Bitcoin moved from $69,266.19 to $77,755.26, an increase of approximately 12.3%.

The data therefore shows that during this August 19–23 recovery window, XRP’s percentage price increase was about 3.1 times Bitcoin’s.

By August 31, CoinMarketCap recorded XRP at $1.3790 and Bitcoin at $78,548.63, showing that XRP had pulled back from its August 23 level while Bitcoin remained near the upper end of its recovery range.

AgencyLaser Manager Says XRP Is Getting Interesting Again as XRP Story Expands Beyond Payments

0

XRP Moves Above $1.40 as XRPL Expands Lending Infrastructure for On-Chain Credit.

XRP is back above the $1.40 level as attention also turns to new infrastructure being developed on the XRP Ledger for lending, tokenized assets, and institutional credit.

Clarissa Yorke, Partner/KOL Manager at AgencyLaser and followed by 2.3 million users on X, said XRP is becoming “interesting again,” pointing to the combination of XRP’s latest price move and the expansion of financial infrastructure on XRPL.


Yorke highlighted stablecoins, tokenized assets, lending and liquidity as areas expanding the XRP Ledger’s use cases beyond its historical focus on payments.

XRP Ledger Adds New Lending Features

The network-side development comes through XRP Ledger version 3.4.0, released on September 16. The release includes the LendingProtocolV1_1 amendment, which extends XRPL’s Lending Protocol and Single Asset Vault framework with closed-ended vaults and cash-basis accounting.

The underlying Lending Protocol is designed to enable fixed-term, uncollateralized loans on XRPL. Capital can be pooled from depositors through a Single Asset Vault and deployed through loans with predetermined terms. Borrower underwriting and credit-risk assessment take place off-chain, while loan origination and management are handled through the ledger.

The protocol divides participants into three main groups: loan brokers, depositors and borrowers. Loan brokers create vaults and manage associated loans, depositors supply assets to the vault, and borrowers receive funds and make repayments according to their loan terms.

Closed-Ended Vaults Introduce Defined Lending Cycles

One of the principal changes in LendingProtocolV1_1 is the introduction of closed-ended vaults. These vaults operate through three predefined stages: subscription, investment, and redemption.

During the subscription phase, assets can be deposited into the vault. During the investment phase, deposits and withdrawals are restricted while capital can be deployed into loans. During the redemption phase, new loans can no longer be created, and depositors can withdraw their share of the proceeds as the structure winds down.

The dates controlling these stages are established when the vault is created and cannot subsequently be changed, according to XRPL documentation.

XRP, RLUSD and Tokenized Assets Can Be Used in Vaults

Single Asset Vaults can hold XRP, trust-line tokens or Multi-Purpose Tokens (MPTs). XRPL documentation specifically identifies trust-line assets such as RLUSD as an example in its institutional lending framework.

Vaults can also be configured as either public or private. Public vaults permit broader participation, while private vaults can restrict deposits to accounts holding the required credentials through XRPL’s Permissioned Domains framework.

This provides infrastructure through which lending pools can incorporate identity and access requirements while remaining connected to on-chain loan operations.

Upgrade Changes How Interest Is Recorded

LendingProtocolV1_1 also introduces cash-basis accounting for new vaults.

Under the previous model, scheduled interest could be recognized when a loan was originated. Under the new system, interest is recorded as income only when the relevant payment is actually received. As a result, vault accounting reflects realized interest rather than the full amount of future scheduled interest.

The lending design also includes optional first-loss capital, which can provide a buffer against loan defaults. The capital does not eliminate credit risk, but it can absorb part of a loss before depositor assets bear it..

XRP Price Returns Above $1.40

The infrastructure update coincides with XRP trading back above $1.40. Yorke connected the price development with the broader expansion of XRPL infrastructure, stating that the XRP story is becoming larger than payments as stablecoins, tokenized assets, lending and liquidity develop within the ecosystem.

The XRP story is becoming much bigger than just payments.

The two developments remain separate measurable factors: XRP is trading above $1.40, while XRPL version 3.4.0 adds new technical infrastructure for closed-ended lending vaults and cash-basis accounting.

The upgrade itself does not establish future XRP demand or price performance. What it does establish is an expanded set of ledger-level capabilities for credit origination, pooled assets, lending and controlled participation in financial applications on XRPL.

XRP Needs to Break $1.45 and $1.51 to Surge 19.7% to $1.70

0

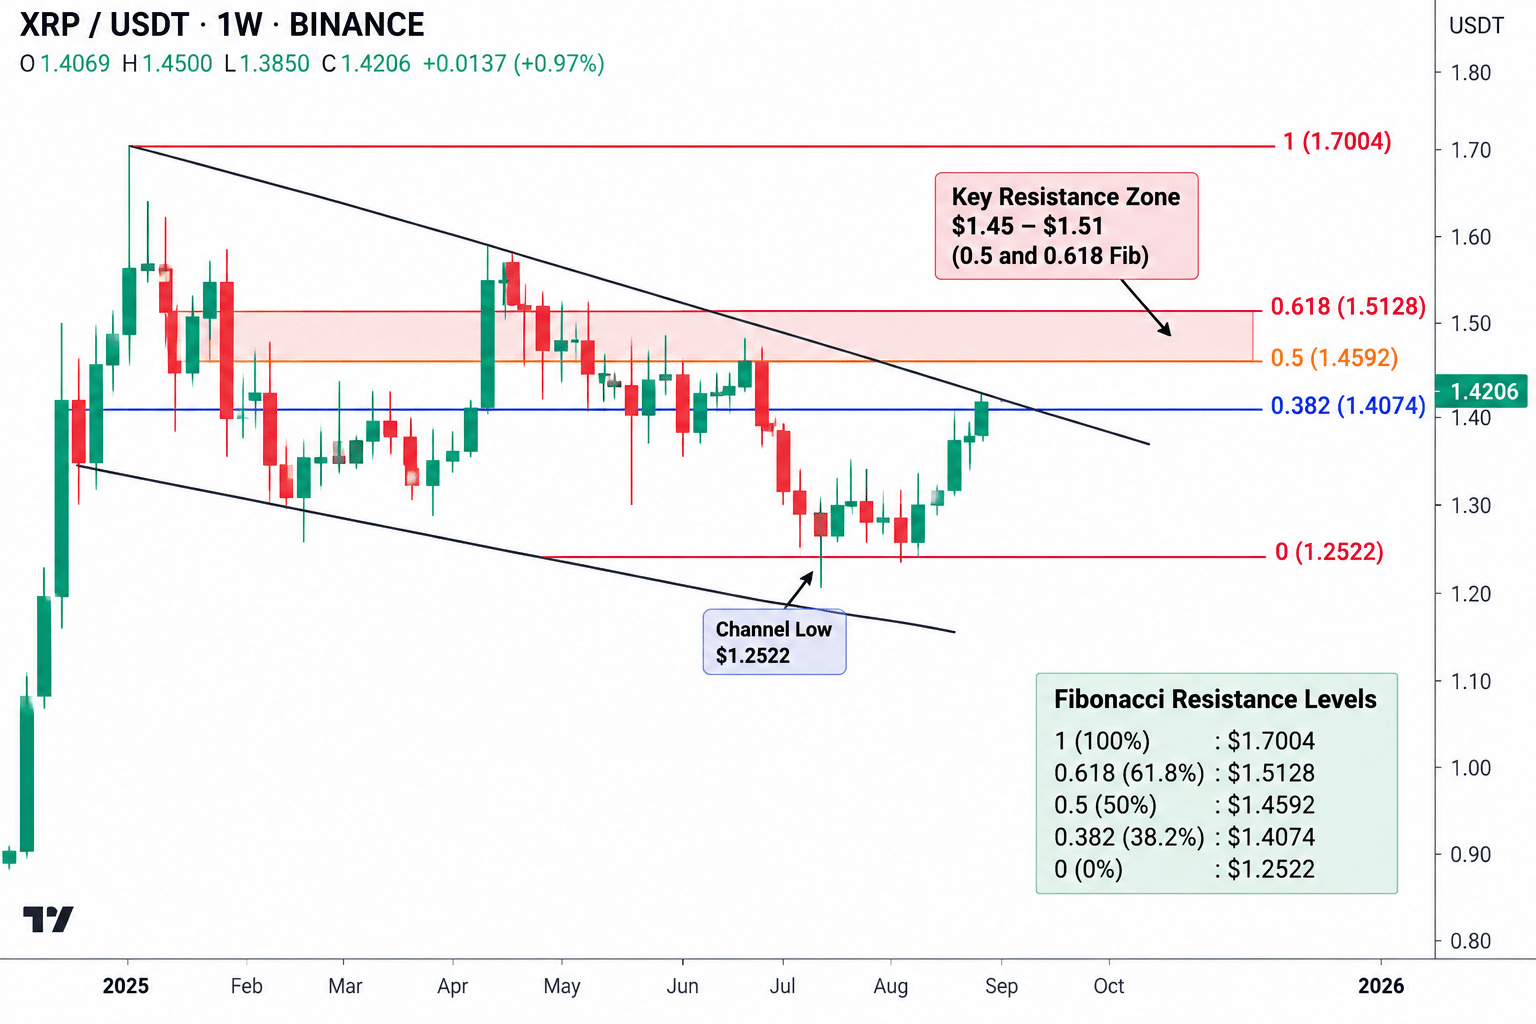
XRP Tests $1.41 Fibonacci Level as $1.45–$1.51 Resistance Zone Comes Into Focus.

XRP is trading around $1.42 on the chart after advancing from the lower boundary of a descending parallel channel. Price has reached the 0.382 Fibonacci retracement at $1.4074, placing it directly around a key resistance area shown on the chart.

XRP resistance levels as xrp tardes around 1.41
XRP resistance levels as XRP trades around $1.42

The Fibonacci structure is measured between $1.2522 and $1.7004. Above the 0.382 level, the next two retracement levels are $1.4592 at the 0.5 Fib and $1.5128 at the 0.618 Fib.

XRP Faces Resistance Between $1.45 and $1.51

The chart therefore places XRP’s next resistance pocket between approximately $1.459 and $1.513. The 50-week EMA is also reported near $1.51, putting it close to the 0.618 Fibonacci level.

XRP has spent roughly five weeks consolidating after rebounding from the lower portion of the descending channel. The latest move lifted price from around $1.29–$1.30 to $1.42, bringing it back to the channel’s descending upper boundary.

The broader Fibonacci range identifies $1.7004 as the upper reference level. From the chart price of $1.4206, XRP would need to rise approximately 2.7% to reach $1.4592, 6.5% to reach $1.5128, and 19.7% to revisit $1.7004.

On the downside, $1.4074 is the first displayed Fibonacci level below the current price, while $1.2522 marks the base of the measured Fibonacci range.

The chart therefore defines the immediate technical structure through four principal levels: $1.4074, $1.4592, $1.5128, and $1.7004.

To Reach $1.70

To reach $1.70, the chart shows two major resistance levels in between: $1.4592 (0.5 Fib) and $1.5128 (0.618 Fib). The $1.51 area is particularly significant because the 0.618 Fib coincides with the 50-week EMA cited in the setup.

A sustained move above $1.5128 would place XRP above the highlighted $1.45–$1.51 resistance pocket. From there, the next major level displayed by the Fibonacci structure is $1.7004, approximately 19.7% above $1.4206.

Crypto Michael Explains Why He’s Still Long on XRP Since Last Month

0

Crypto Michael Keeps XRP Long Open After July Accumulation Call.

Crypto trader Crypto Michael, who has about 126,000 followers on X, says he is still holding an XRP leveraged long position opened last month. The latest position screenshot shows an XRPUSDT perpetual contract using 20x leverage, with an entry price of $0.9918 and a mark price of $1.4036.

The screenshot, timestamped September 19, 2026, displays a return of +830.51% on the leveraged position. The percentage shown represents the leveraged position return rather than XRP’s underlying spot-price increase.

XRP Has Risen More Than 40% From the Entry Price

Using the figures displayed in the position screenshot, XRP increased from the $0.9918 entry to $1.4036, a difference of $0.4118 per XRP.

Image

That represents an underlying price increase of approximately 41.5%. With 20x leverage, changes in XRP’s price produce substantially larger percentage changes in the position’s displayed return.

Michael said in his latest post that he remains in the XRP long and expects the move to accelerate, telling followers that they “don’t want to be sidelined.”

Those statements represent his forecast, rather than an established future XRP price.

July XRP Chart Showed Falling-Wedge Structure

The position follows an earlier XRP call published on July 1, 2026, when Michael wrote: “I’ve been accumulating XRP here. You’re about to see why.”


His July weekly chart showed XRP around $1.06, trading near the bottom of a large falling-wedge structure that had developed after XRP’s decline from above $3. The chart also highlighted a major historical price zone around $1.90–$2.10.

Contemporary reporting on his July analysis recorded $1.90–$2.10 as his next target zone. XRP was trading around $1.15 at the time of that subsequent report.

XRP Position Remains Open Above $1.40

The two screenshots document the sequence from the July accumulation statement to the September leveraged position: XRP near $1.06 on the July chart, a $0.9918 long entry, and a September mark price of $1.4036.

That puts XRP roughly 41.5% above the stated entry price, while the displayed 20x leveraged position shows +830.51%. The position screenshot indicates the trade remained open as of September 19, 2026.

XRP Is Set for a $2 Move as Bullish Chart Pattern Forms

0

XRP is targeting $2 if it completes a bullish chart pattern, according to crypto analyst Ali Martinez.

Martinez says XRP is forming an inverse head-and-shoulders pattern on the daily chart. The key level to watch is around $1.55, known as the neckline.

A break above $1.55 confirms the pattern and sets up a 35% rise toward $2. Martinez also sees room for XRP to move higher.

At the time of the cited CoinMarketCap data, XRP was trading around $1.31, up 1.75% for the day. It was still down 0.35% over the past week but had gained about 30% over the past month.

$1.55 Is the Key XRP Level

Martinez’s chart shows XRP forming an inverse head-and-shoulders pattern, with the right shoulder still developing. The key level is $1.55, which has acted as a major resistance level before. XRP needs to break above $1.55 for the pattern to be confirmed.

Martinez expects XRP to first move toward $1.55, followed by moves to $1.70, $1.90, and eventually around $2.10. From the cited price of $1.31, reaching $2 represents about a 53% increase. Martinez’s 35% gain is calculated from the $1.55 breakout level to around $2.09.

ChartNerd Watches $1.33 Support

Meanwhile, another analyst, ChartNerd, is also watching XRP’s current price area. ChartNerd says XRP bounced after touching its 20-week moving average and returned to the middle of its price channel and the previous $1.33–$1.36 support zone.

This area is important because it becomes resistance if XRP fails to move back above it.

If XRP fails to reclaim $1.33–$1.36, the next challenge is the downward resistance line. For now, XRP is at an important level, trading just below the previous $1.33–$1.36 range.

XRP Chart by ChartNerd

Martinez Previously Watched $1.38

Five days earlier, Martinez pointed to another bullish setup while XRP was trading around $1.31–$1.35. He said XRP would continue moving within a triangle pattern as long as the $1.31–$1.35 support zone held.

He identified $1.38 as the key breakout level. A strong move above $1.38 would push XRP toward $1.60. His latest analysis now focuses on the higher $1.55 level, showing XRP has several levels to break before moving toward $2.

The main levels to watch are:

  • $1.31–$1.35: Immediate support zone
  • $1.38: Near-term breakout level
  • $1.55: Key neckline for the larger pattern

According to Martinez’s analysis, breaking above $1.55 opens the way toward $2.