Home Blog Page 422

New Hampshire Launches First $100M Bitcoin-Secured Municipal Bond

0

The US State of New Hampshire has introduced a Bitcoin-secured municipal bond valued at $100 million.

The move marks one of the most significant attempts yet to connect cryptocurrency with the traditional debt market. The initiative aims to expand financing options for businesses while keeping taxpayers fully insulated from market risk.

State Finance Authority Approves Bitcoin-Pegged Bond

The program is led by the state’s Business Finance Authority (BFA), which approved the Bitcoin-pegged conduit bond earlier this week.

Although the BFA is a state entity, it emphasized that the bond does not rely on government backing. Instead, the authority will supervise the structure while avoiding any repayment obligations. 

To safeguard investors, Bitcoin held in BitGo’s custody will serve as the primary collateral.

The bond launch comes weeks after New Hampshire allowed its treasury to allocate up to 5% of public funds to cryptocurrency. This move created the nation’s first state-level strategic Bitcoin reserve.

Governor Ayotte Welcomes New Investment Path

Governor Kelly Ayotte, who signed the Bitcoin reserve bill in May, welcomed the new bond program. She told Crypto America that the initiative can attract fresh investment while maintaining strong safeguards for public funds.

Republican Representative Keith Ammon described the bond as a controlled trial. Accordingly, he said it will help determine whether Bitcoin can function as high-grade collateral in public finance.

According to Ammon, the BFA’s self-funded structure makes it suitable for this early stage. He added that strong results could lead to a future bond issued directly by the state treasury.

Under the approved terms, borrowers must supply Bitcoin worth roughly 160% of the bond’s face value. In the event of market volatility, a liquidation system will protect bondholders if Bitcoin’s value falls below 130%.

Ammon noted that this structure lets firms unlock capital without selling their holdings or drawing extra attention from the IRS.

Orion Mountainspring of Orrick, the municipal bond law firm supporting the project, praised the move. He said the transaction represents a turning point for both crypto and municipal debt.

In parallel, Orrick helped New Hampshire shape the framework, ensuring it meets regulatory requirements while opening the door to new forms of collateralization.

Economic Development Fund to Benefit From Fees

The state plans to direct all fees and any gains from the collateral program into the Bitcoin Economic Development Fund. BFA Executive Director James Key-Wallace said this fund supports entrepreneurship and business expansion, thereby generating broader economic value beyond its immediate financing role.

Wave Digital Assets Helps Build the Bond Structure

Wave Digital Assets co-founder Les Borsai said the bond represents more than a single financial tool. It opens the door to a new category of debt markets built around digital assets.

To support the effort, Wave partnered with Rosemawr Management, a municipal bond specialist, to refine the structure and align it with established municipal-funding standards.

Borsai said the New Hampshire model demonstrates how the public and private sectors can collaborate on responsible crypto-backed financing. Moreover, he noted that the U.S. bond market, valued at over $58 trillion, offers a major opportunity if this structure gains traction.

He also emphasized that many crypto reserves are currently idle, and that this framework could help convert them into functional financial tools.

Finally, Borsai said the design allows pensions and retirement programs to take limited exposure to crypto while managing risk. He believes broader institutional participation will be essential for long-term adoption.

Solana 4-Hour Bottom Could Launch SOL to $145: Here’s How

Solana shows potential for recovery as it bounces from key Fibonacci support, with analysts advising long-term accumulation.

Over the past 24 hours, Solana (SOL) has demonstrated a mild uptick, rising by 0.4% to reach a current price of $138.33. This slight recovery follows a series of fluctuations, with the crypto asset briefly testing highs of $142.84 before dipping back below $137. Over the past 7 days, SOL has experienced a decline of approximately 13.3%, while in the 14-day timeframe, its performance is also in the red, down by 11.8%.

While the broader crypto market has faced significant challenges over the last week, the recent price action signals that a recovery might be brewing. Solana now boasts a market cap above $77 billion, up 0.5% in the past 24 hours.

Solana Price Analysis

Amid the ongoing trend, SOL’s 4-hour chart reveals a key development that could indicate the crypto is nearing a potential bottom. Specifically, Solana has been experiencing a downtrend, as shown by the price movement within the Fibonacci retracement levels.

Solana 4h Chart
Solana 4h Chart

The most recent price action has tested the 0 Fibonacci level at around $128.78, which acted as a support zone. If the price fails to move below it again, it could act as Solana’s bottom, launching a surge to test new resistance.

The next resistance for SOL exists at $145.25, which corresponds to the 0.382 Fibonacci retracement level. If Solana breaks above this level, the next key resistance would be at $150.33 (0.5 Fibonacci level), followed by $155.42 (0.618 Fibonacci level).

Looking closer at the technical indicators, the MACD shows signs of potential bullish reversal. Specifically, the histogram is showing green bars, indicating weakening selling pressure, while the MACD line has crossed above the signal line. This suggests that the downtrend may be losing steam, and a reversal could be imminent.

Analyst Says Hold Tight 

Shifting to the social commentary end, analyst ManLy recently commented that while SOL has dropped to $138, with a market cap of approximately $76.6 billion, this should not be confused with short-term pain versus long-term potential. He highlighted that the 24-hour trading volume remains strong at over $5.6 billion, indicating active liquidity in the market.

On the blockchain front, ManLy acknowledged that daily active addresses have dipped due to the cooling of the memecoin hype. However, the network continues to handle approximately 2 million active addresses and 56 million transactions every 24 hours.

He emphasized that developers and infrastructure are still actively building, despite a general lack of attention from many investors. ManLy stated that he is not panicking and is instead accumulating, as he believes the ecosystem’s growth momentum is quietly building and that the price has yet to reflect this. He urged others to hold tight during this phase.

Jim Cramer Says It Feels Like a “Cabal” Is Trying to Keep Bitcoin Above $90,000

0

Jim Cramer has suggested that a mysterious group might be keeping Bitcoin above $90,000.

This view comes as Bitcoin continues to struggle, trading at $91,684 amid a 12% weekly loss. Notably, BTC touched a seven-month low of $89,200 earlier in the week and has not fully regained its footing.

Now, Cramer has implied that something unusual might be happening in the market.

Cramer Says Bitcoin Feels “Propped Up”

Cramer posted on X that it “almost feels like a cabal is trying to keep Bitcoin above $90,000.”

He added that while he likes Bitcoin itself, he is not a fan of the various derivatives and “games” built around it.

The comment sparked reactions across the crypto community. Many argue that the forces keeping Bitcoin above $90,000 are visible and explainable, not the result of any coordinated effort.

Community Pushes Back: “It’s Just Math”

X user Tom Alpha countered the idea, explaining that the support around $90,000 reflects structural buying rather than manipulation. He pointed to ongoing ETF inflows and MicroStrategy’s accumulation consistently surpassing daily miner issuance, creating natural upward pressure.

Essentially, large long-term players, institutions, pensions, and even sovereign buyers are absorbing supply. In his view, the level is not being defended by a “cabal”. Instead, it’s simply the result of sustained capital entering the market.

Another commenter, “Hyper Prophet,” offered a humorous inversion of Cramer’s statement, framing it as the typical “Cramer reverse indicator” that often circulates among traders.

Similarly, eToro investor Amer Shouaeb joked that his strategy is simply to do the opposite of Cramer’s calls. He said he sells when Cramer is bullish and buys when he is bearish.

Bitcoin Is Undervalued, Not Manipulated

Meanwhile, veteran Bitcoin analyst Dave Weisberger provided a more detailed interpretation, saying Cramer’s comment contradicts itself.

He explained that investors who understand Bitcoin see it as undervalued relative to its network growth and to gold, which Bitcoin could eventually match or surpass in value.

Weisberger believes the current price drop is just part of normal market fluctuations, caused by older holders selling to new institutional investors as Bitcoin matures. He also noted that conspiracy theories about price manipulation usually make the opposite claim—that big players want Bitcoin cheap so they can accumulate more.

Ultimately, Bitcoin is facing resistance around $90,000 even as long-term demand grows, institutions continue buying, and miner supply remains low.

Shiba Inu Launches Custom Payment Card and 114,678,899 SHIB Giveaway for Early Users

0

Shiba Inu has partnered with digital asset exchange Bitget to debut an exclusive SHIB-branded payment card alongside a community giveaway. 

The Shiba Inu ecosystem team announced the launch through its official X handle, emphasizing that users can now spend their crypto assets seamlessly using the customized SHIB-themed card.  

The announcement follows days of anticipation after Shiba Inu and Bitget hinted at the imminent rollout of a new product. Earlier this week, the team teased that something special was on the way for the ShibArmy. That announcement sparked speculation, with the Crypto Basic suggesting that the upcoming reveal could involve a new payment card or expanded SHIB support on Bitget.

Shiba Inu’s X handle later confirmed that one of these predictions was accurate. Shortly after, the team officially disclosed that it had partnered with Bitget to launch a SHIB-themed payment card. 

Card Features

One of the card’s most notable advantages is its zero-fee spending structure. Cardholders can spend up to $400 per month in crypto without paying any additional charges. This includes no conversion fees, FX fees, and no hidden spreads. 

Signing up for the card is also entirely free, a move designed to lower the entry barrier for users looking to use their SHIB tokens for everyday transactions. 

Shiba Inu Announces 114M SHIB Giveaway 

Meanwhile, the teams also rolled out a special rewards program to celebrate the launch of its payment card. According to the announcement, the first 100 users who sign up for the card will share a pool of 114,678,899 (114.67 million) SHIB. 

Any other participants who join after the first 100 will receive a $5 in SHIB sign-up bonus. This incentive aims to boost early adoption while ensuring that every member of the SHIB Army benefits from participating.

To participate, users must complete the registration form provided in the announcement, download the Bitget Wallet, and open the SHIB × Bitget Wallet Card. The promotional event runs from November 19 to November 26, with all rewards scheduled to be distributed on November 28.  

BlackRock Bitcoin ETF Sees Largest Daily Outflow in History

0

The BlackRock Bitcoin ETF records its largest outflow in history, but some are suggesting this may mark the Bitcoin price bottom.

Notably, the Bitcoin (BTC) market has moved into a steep decline over the past few weeks, and ETF flows now reflect this bearish momentum. Since Oct. 6, BTC price has dropped nearly 28%, and the token now appears on track to post its weakest monthly performance since February 2025.

Similarly, Bitcoin ETFs continue to experience heavy outflows, with the BlackRock iShares Bitcoin Trust (IBIT) reinforcing this negative trend. Since Nov. 12, the BlackRock Bitcoin ETF has logged five straight days of outflows, extending a pattern it has carried since mid-October.

BlackRock Bitcoin ETF Sees Record Daily Outflow

More importantly, the fund’s latest intraday showing stands as its worst yet, as it recorded $523 million in outflows yesterday, Nov. 18. This amount represents IBIT’s largest daily outflow to date, surpassing the previous record of -$463 million set on Nov. 14.

BlackRock Bitcoin ETF Sosovalue
BlackRock Bitcoin ETF | Sosovalue

Interestingly, IBIT saw this major outflow at a time when other Bitcoin ETFs either attracted inflows or recorded no movement. Specifically, the Grayscale Bitcoin Mini Trust ETF (BTC) and the Franklin Bitcoin ETF (EZBC) saw inflows of $139.63 million and $10.76 million, respectively, while the others reported zero flows.

Notably, with the latest $523 million outflow, the BlackRock Bitcoin ETF has now shed $1.425 billion in capital. This marks the fund’s worst 5-day stretch in its history and places it on course for its weakest month yet, as the $1.78 billion in November outflows already exceeds its previous monthly record of -$775.77 million.

These record outflows follow a period when the fund enjoyed seven consecutive months of inflows from March to October 2025, drawing in a substantial $24.927 billion. Following the latest downturn, the BlackRock Bitcoin ETF now holds net assets of $72.76 billion, supported by $63.12 billion in cumulative netflows, and it maintains its position as the leading Bitcoin ETF.

Sign of Bitcoin Bottom?

Commenting on the latest daily performance, Bitcoin Archive raised the question of whether this record outflow could signal a market bottom, just as heavy inflows marked the peak of the previous rally. For context, from Sept. 30 to Oct. 7, the BlackRock Bitcoin ETF posted consecutive inflows totaling $3.73 billion over six days, a period that aligned with BTC’s surge above $126,000 on Oct. 6.

Since that top, Bitcoin has entered a sharp downtrend, erasing $690 billion in market value. After falling to a seven-month low of $89,198 yesterday, BTC has regained the $90,000 psychological level and currently trades at $91,685, while indicators now point to a possible decline in volatility after several weeks of intense selling.

Jake Claver Predicts “Perfect Storm” Toward Triple-Digit XRP, Says XRP ETF Supply Shock Has Begun

0

Digital Ascension Group CEO Jake Claver and the hosts of the Good Evening Crypto podcast have argued that an imminent liquidity crunch is looming for XRP.

They argue this could trigger a dramatic price revaluation fueled by ETFs, institutional adoption, and a potential pre–Clarity Act market event.

Why Claver Believes XRP Is the Only Viable Liquidity Option

The discussion began with a question about why XRP is being highlighted as the primary token capable of solving problems in global financial markets. Claver explained that XRP has a level of legal clarity that most other cryptocurrencies do not.

Specifically, XRP stands out because it is the only digital asset that the U.S. has officially stated is not a security. Meanwhile, many other cryptocurrencies are still awaiting clearer rules. The Clarity Act, which would help provide this clarity, has been delayed due to the U.S. government shutdown.

Claver said this gives XRP a unique advantage if a liquidity crisis occurs before the Clarity Act passes.

“The only option they’re going to have, if there’s enough liquidity in the asset, is going to be XRP to save the day,” Claver said.

XRP Price Surge: $100+ Target and the ETF Effect

Claver also shared his optimistic view on XRP’s future price, saying it could even reach $100 by the end of the year. He said this would require a “perfect storm” of events, citing major financial institutions using XRP for settlements and the launch of XRP ETFs.

According to Claver, as more ETFs emerge and larger players begin using XRP, demand for the token will surge.

Claver claims that currently, much of XRP’s trading takes place in OTC (over-the-counter) markets and dark pools. Accordingly, the price movements are not very visible.

But once those hidden sources run low, ETFs will need to buy XRP directly from exchanges, which could push the price up quickly as demand outpaces supply. Claver warned of this looming squeeze, saying:

“Everybody needs it all at the exact same time, and there’s not enough to go around. That’s where we see a huge move up in price that people aren’t ready for.”

“What If the Clarity Act Passes This Year?”

Meanwhile, co-host Johnny pressed Claver on his prediction that XRP could hit $100 by year-end. Claver insists such a surge requires major settlement markets adopting XRP before the Clarity Act passes.

As the government shutdown delayed the bill, it created a short window where XRP remains the only fully clear asset available for institutions, according to Claver.

But even if the Clarity Act passes, Claver said the XRPL still offers unmatched advantages. He cited digital identity features, built-in KYC/AML, AMMs, and institutional-grade tools, making it a top choice for enterprise players.

Evernorth, Ripple Escrow, and a New Demand Wave

Claver further highlighted how Evernorth and Ripple are working to expand the DeFi ecosystem on the XRP Ledger. Evernorth is raising $1 billion and partnering with institutions to build DeFi projects on XRPL.

He said XRP’s liquidity and regulation-friendly design make it appealing to institutions seeking safe blockchain solutions.

He also referenced upcoming XRPL upgrades, Amendments 64, 65, and 66, which will introduce pseudo-accounts, liquidity pools, and on-chain borrowing and lending. These changes are expected to make XRPL even more capable for institutional DeFi.

Claver noted that companies such as Vivo Power and Arrington Capital are already acquiring XRP at discounted prices. This shows institutional interest and potential long-term effects on XRP’s supply and demand dynamics.

XRP Holders Could Become the Next Wave of Millionaires

Meanwhile, host Abs asked Claver for his thoughts on whether XRP holders could become the next generation of internet-era or crypto millionaires, similar to the early Bitcoin era. Claver replied:

“I’ve literally bet my whole business on it.”

He described the XRP community as older, more private, and mission-driven, unlike the flashier culture in much of crypto. Many of Claver’s clients, he said, have philanthropic goals tied to their anticipated gains.

According to Claver, many want to use their XRP wealth to support local communities, create foundations, or fund medical research. He believes this mindset could lead to a meaningful positive impact if XRP’s value rises the way many expect.

In Sum

Claver believes XRP’s future is aligning with significant changes in global finance, increasing regulatory clarity, and DeFi adoption. Because XRP is a non-security and institutional interest continues to rise, he thinks the groundwork is already in place for a significant price increase beyond $100 in the coming years.

German National TV Speaks on XRP Downturn, Shares Condition for a Run to $16

0

Germany’s leading finance channel, Der Aktionär TV, recently examined the latest XRP drop amid the ongoing Bitcoin and broader market downtrend.

For context, as Bitcoin slides into the $90,000 range, XRP has fallen to the lower end of the $2 region, currently trading at $2.13. Tokentus Investment CEO Oliver Michel joined the program to explain the volatility and to present the conditions that he believes could push XRP toward $12.

Host Johanna Kramär pointed out the XRP market crash. She stressed that XRP has moved with the broader market despite its recent spot ETF launch, asking Michel whether XRP showed key levels similar to Ethereum, which the Tokentus CEO analyzed earlier in the segment.

XRP Usually Rallies from Range Lows

Responding, Michel said Tokentus has continued to track a long-standing XRP price range between $2 and $3. He explained that XRP recently sat in the middle of this band but now leans toward the lower side amid the downturn.

According to him, XRP usually begins major upside moves from the bottom of its range, not from the middle or the top. As a result, he said he feels comfortable with short-term dips toward $2.20, $2.15, $2.10, and even around $2.00, since those levels still leave room for a rebound.

He added that XRP currently drifts toward that lower zone, but this remains part of its normal behavior before strong breakouts. 

XRP ETF Prospects

The pundit then pointed to the Spot XRP ETF from Canary Capital, which launched on Nov. 13 and immediately ranked as the most successful ETF debut in the United States in 2025 across every asset class. The product recorded over $58 million in volume on its first day. 

Michel said Franklin Templeton would launch its own XRP ETF later that same day, while Bitwise and 21Shares would follow in the days ahead. He believes these launches mark the start of a new phase for XRP in traditional finance. However, the Franklin Templeton product has faced delays.

Michel highlighted that the Canary Capital ETF posted its impressive figures despite a weak market environment driven by Bitcoin’s downturn. 

He noted that the ETF’s momentum shows strong underlying demand, which could accelerate once available supply tightens. According to him, if market conditions improve and the coming stimulus measures start to take effect, XRP could respond with a sharp move upward.

Condition for a Possible XRP Run to $16

Meanwhile, to show how volatile the market has become, Michel called attention to XRP’s wild intraday swings. He noted that XRP jumped 4.5% in about ten minutes the previous afternoon, reached $2.30, and then fell 6% over the next two hours. 

He argued that these moves do not look natural and likely involve large market makers who influence the market. The Tokentus CEO warned that anyone trading crypto must develop the nerves to handle such swings.

Earlier on, Michel had also commented on XRP’s market share. He said XRP currently holds about 4% of the market after tripling its share in the last altcoin season. 

If XRP simply doubles its current share to 8%, he believes it could need to trade around $12. However, if the XRP market rises 3x to 13%, the XRP price could hit $16. Nonetheless, this price would materialize if Bitcoin could drop to $1.4 trillion and its dominance slumps to 40%, creating ideal conditions for altcoins.

XRP Price Prediction on Der Aktioner TV

Expert Shares Target as XRP Loses Breakout Level

0

With XRP flirting with lower prices, a prominent market analyst has identified an imminent bearish target should current momentum continue.

XRP is looking pretty weak, as prices continue to consolidate in reflection of the broader market trend. The cryptocurrency is down slightly over the past 24 hours, with a weekly correction of 11%. 

However, XRP has managed to remain profitable to those who bought at the start of the year, with a 2.58% YTD increase. Notably, only XRP, BNB, and Tron are profitable to holders in this timeframe among the top 10 by market cap, as the recent correction has led most assets to relinquish earlier gains.

Further XRP Lows?

Meanwhile, analyst Nebraskangooner is calling for further price declines for XRP, potentially taking the token towards the $1.50 area. Why this bearish disposition? He identified a failed breakout as the catalyst for the price crash.

An accompanying chart lays the foundation for this bearish XRP price prediction. It shows that XRP missed a bullish breakout from a descending triangle on the weekly timeframe, spurred by recent downward momentum.

XRP Breakdown from Descending Triangle

XRP filled the triangle that originated from a rally to the yearly high of $3.66 in July and was close to an upward breakout in late October. However, bears stepped in and prevented this development, driving the token lower.

Eventually, XRP broke below the triangle’s lower support trendline at around $2.2, suggesting it could fall further. Nebraskangooner has set the target of the dump at $1.50, marking a 30% retracement from the current trading price of $2.14.

Long-Term Holders Move from Euphoria to Anxiety

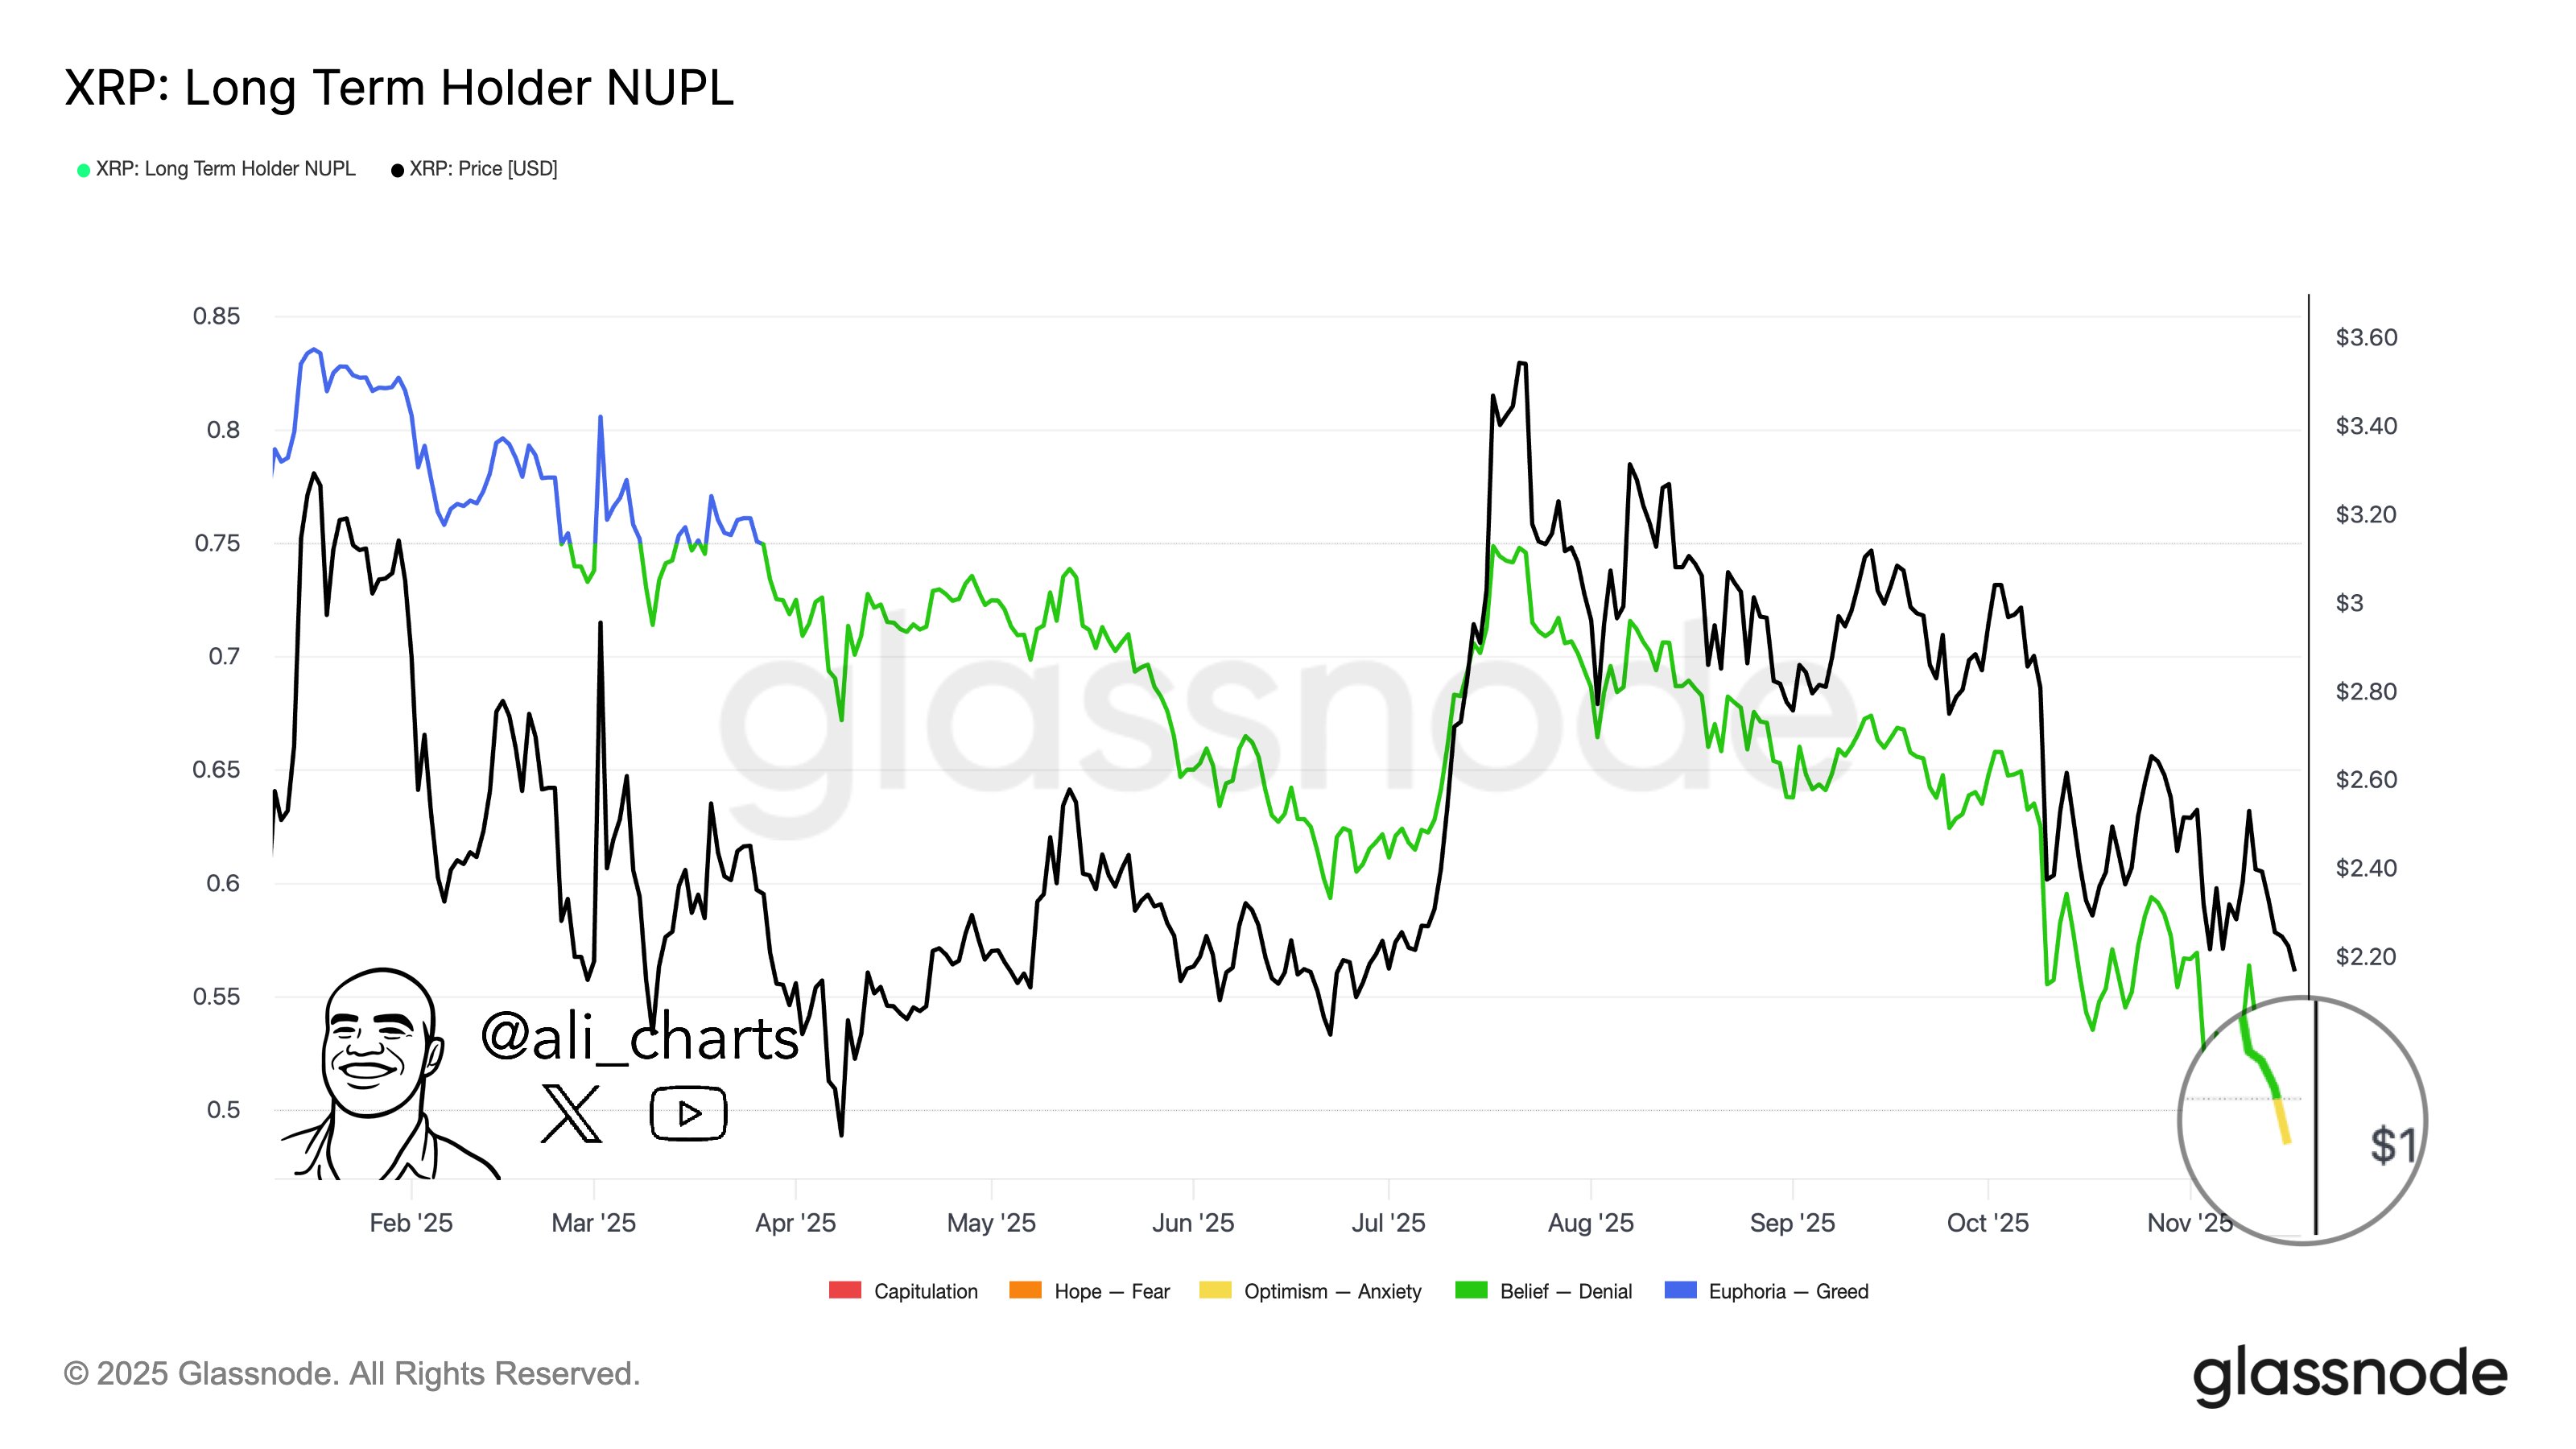
Adding to the bearish momentum is a shift in sentiment among long-term holders. Once euphoric about XRP’s price trajectory, the coin’s persistent underperformance is weakening that enthusiasm.

Glassnode data highlighted this, as these long-term holders first switched from euphoria to denial and are now becoming anxious about XRP. Notably, the analysis measured this mood using the net unrealized profit/loss (NUPL) of long-term holders.

For the uninitiated, this metric measures the profitability of long-term holders by comparing the market cap to the realized cap. A higher NUPL indicates that more holders have unrealized gains, while a lower value suggests the opposite.

The state of anxiety shows moderate profits for long-term holders, but with uncertainty in the market’s direction. This creates more panic selling compared to the denial state, where they have significant profits and euphoric conditions characterized by outsized gains. The sentiment shift comes as XRP flirts with a drop below the psychological $2 price mark.

XRP Long-Term Holder NUPL

Top Analytics Platform Teases Rapid Recovery for Cardano as ADA Enters ‘Extreme Buy Zone’

0

Leading analytics platform Santiment suggests that Cardano is sitting in an extreme buy zone following its double-digit collapse. 

According to Santiment, most established cryptocurrencies are currently showing severe pain in their average trading returns. In its latest 30-day MVRV (Market Value to Realized Value) analysis, the firm highlights Cardano as one of the most undervalued major cryptocurrencies. 

ADA Sees Lowest MVRV, Falls to Extreme Buy Zone 

Santiment notes that Cardano wallets active over the past month are sitting on a negative average return of 19.7%, causing severe pain for investors. This indicates that a trader who bought ADA last month has already incurred a roughly 20% loss. 

Other leading assets are also in the red, though to a lesser degree. Chainlink, Ethereum, Bitcoin, and XRP all show 30-day negative MVRV levels of 16.8%, 15.4%, 11.5%, and 10.2%, respectively, underscoring widespread negative sentiment across the crypto market. 

Notably, due to ADA’s low MVRV, Santiment placed the token firmly within what Santiment classifies as an “Extreme Buy Zone.”

The chart from the analytics platform shows Cardano dropping into the “Buy Here” region, suggesting the recent decline may present an attractive accumulation opportunity for investors looking to buy at cheaper rates. 

Cardano Enter Extreme Buy Zone

Potential Rebound for Cardano?

Santiment emphasizes that the most strategic accumulation occurs when many traders are in pain due to losses. In such conditions, Santiment noted that negative MVRV values often precede a strong rebound. 

At the moment, ADA has continued on its downward trajectory. It briefly dropped to $0.45 today and rebounded to $0.46. At the current price of $0.4690, Cardano has plummeted by 16.81% over the past week, bringing its 30-day loss to 30.28%. 

Despite ADA’s continued downturn, several crypto analysts maintain an optimistic outlook for a major rebound. Earlier this month, The DApp Analyst suggested that Cardano could stage a 97% surge after its RSI mirrored a pattern seen earlier in the year. The projection placed ADA at a potential target of around $1.10 at the time of the analysis.

Meanwhile, AltcoinPioneers offered a more conservative projection. He argues that ADA could rise to $0.65 if buyers show strong accumulation while the asset successfully breaks through key resistance levels.

While Santiment’s analysis signals the possibility of a recovery due to ADA’s deep negative MVRV ratio, the token remains weighed down by broader market weakness. As a result, the timing of any meaningful rebound is uncertain. 

Will Bitcoin Finally Benefit Bulls as Futures Flow Favour Bears?

Bitcoin shows bearish momentum, with futures flows favoring sellers and technical indicators suggesting potential volatility drop.

Bitcoin’s current price movement, which stands at $91,524, reflects a 0.3% increase in the past 24 hours. However, the recent price action has been volatile, trading around its seven-month lows. 

This follows a decline that saw BTC briefly dip below $90,000, its faintest price since April. Despite a brief recovery towards the $94,000 level, Bitcoin struggled to maintain its gains as market sentiment remained cautious. 

Over the past 7 days, Bitcoin has decreased by 11.3%, and in the last 14 days, it has fallen by 10.1%, indicating a generally bearish trend.

Bitcoin Technical Analysis

On the technical end, Bitcoin is currently showing strong bearish signals, as indicated by several key technical indicators, although things might reverse in the near future. The price is trading just above the lower Bollinger Band at $89,474.81, which typically suggests an oversold condition.

Screenshot 2025 11 19T115321813
Bitcoin

Prices near the lower band often point to further declines unless the market finds support and reverses course. On the positive side, the Bollinger Bands have expanded in the latest trading sessions, indicating higher volatility, but this may also signal an impending contraction as volatility drops.

This could also possibly push Bitcoin towards the middle band, acting as immediate resistance at $101,241, hence benefiting the bulls. Further resistance also exists around the upper Bollinger band at $113,008.

Meanwhile, the Moving Average Convergence Divergence further confirms the bearish sentiment. The MACD line is below the signal line, which is a clear indication of downward momentum. Additionally, the negative histogram confirms that selling pressure remains strong, and the overall trend is still heavily skewed toward the downside. 

A potential reversal could occur if the price recovers back towards the middle Bollinger Band, and the MACD shows signs of bullish crossover.

Bitcoin Futures Flow Data

Elsewhere, the futures flow data extracted from Coinglass reveals selling pressure in Bitcoin trading, with a clear bearish sentiment across multiple time frames. Over the 4-hour and 8-hour intervals, the net inflows are slightly negative or show marginal positivity, reflecting a continued trend of traders exiting positions.

Screenshot 2025 11 19T121331963

The 4-hour net inflow is negative (-$3.52M), while the 8-hour also shows a negative net inflow of -$392.51M.

Looking at the longer-term data, such as the 12-hour and 24-hour flows, the negative trend intensifies. The 12-hour netflow shows a sharp outflow, with a dramatic -929.39% change, highlighting increasing selling pressure.

The 24-hour data also reflects a net outflow of -$678.38M, suggesting that overall market sentiment remains bearish, as investors find safety amid the market uncertainty. This trend suggests that the downward pressure on Bitcoin’s price may persist in the near term.