Home Blog Page 425

Expert Shares Simple XRP Game Plan: Details

0

As XRP shows signs of life, an expert trader has shared a simple yet elaborate game plan for its subsequent price development.

Notably, analyst DrBullZeus shared this in his recent X update, coinciding with a broader market downtrend. After a low of $2.11 on Monday, XRP slipped further to $2.10 today before a notable rebound from the area to change hands at $2.19 at press time.

Simple XRP Plan

Amid this downturn, the expert trader elaborated on his game plan for XRP, insisting that it “is simple.” He highlighted a key support zone for XRP, stating that its price action around the area would determine its next trajectory.

Specifically, he expressed enthusiasm about the $2.06 demand level and how XRP has held up nicely above it. Notably, XRP dropped to the support on November 4 but quickly bounced to reclaim higher prices.

He highlighted that XRP has confirmed the “make-or-break” support, with signs of life around when it tested the area. Notably, DrBullZeus’s chart suggests that XRP could correct to the $2.06 support again to form a double bottom before its next leg up.

Resistance Area Targets

After the retest happens, the trader predicts further upside to subsequent resistance levels. He identified three higher levels to watch when the XRP price starts to recover.

Simple XRP Plan
Simple XRP Plan

The first major resistance is at $2.30, an area XRP lost yesterday with its 2.34% correction. Capturing this preliminary target paves the way for the analyst’s “real” targets at $2.45 and $2.69. The former aligns closely with November 10’s lower high, and the latter is the peak price of October 27.

From the current market standing of $2.19, this rally to $2.45 and $2.69 represents an 11.8% to 22.8% growth.

Meanwhile, his key strategy is patience. He recommends remaining unwavering in the face of market uncertainties, reiterating that a bounce to higher levels is in the plan as long as XRP stays above $2.06.

Aligning XRP Prediction

The analysis correlates with a recent commentary from market veteran Ali Martinez. He highlighted the $2.15 support as the “line in the sand for XRP.”

If the level holds, then a rebound is the subsequent proceeding, as the coin has done in the past. Martinez shared the possibility of a move to $2.40 and $2.70, aligning with the mid and upper resistance trendlines in a price range formation.

Crypto Bank AMINA Wins Hong Kong License to Offer Institutional Trading and Custody

0

Swiss-based AMINA Bank AG has gained regulatory clearance in Hong Kong to launch crypto trading and custody services for institutional clients. 

The approval marks a major milestone for global firms entering one of the world’s most tightly regulated digital-asset markets.

AMINA Secures Type 1 License Upgrade

The bank announced that the Hong Kong Securities and Futures Commission granted its local subsidiary a Type 1 license uplift. This milestone, it says, makes it the first international bank to receive such authorization.

This upgrade is significant because institutions in Hong Kong have long faced limited access to bank-grade crypto services, largely due to the region’s strict compliance environment.

With the license upgrade in place, AMINA can now support 13 major cryptocurrencies. The list includes Bitcoin, Ethereum, USDC, Tether, and several leading DeFi tokens. This broader asset range aims to meet rising demand from clients seeking secure exposure to well-established digital currencies.

The bank says this added access strengthens its ability to serve a growing institutional market.

Sharp Rise in Local Crypto Trading Activity

The approval comes amid a sharp rise in regional crypto activity. AMINA reported a 233% increase in trading volume across Hong Kong exchanges in the first half of 2025 compared with a year earlier.

This surge reflects stronger participation from institutional traders, thus signaling renewed confidence in regulated crypto markets.

Building on this momentum, AMINA plans to widen its local offerings. Michael Benz, the bank’s Hong Kong head, said the license opens the door to private fund management and structured products. He added that it also paves the way for offering derivatives and tokenized real-world assets.

According to Benz, these additions will therefore enable the bank to deliver a broader suite of regulated crypto solutions to institutional clients.

Hong Kong Strengthens Position as Global Crypto Hub

AMINA’s approval aligns with Hong Kong’s broader push to attract global digital-asset firms. The city has positioned itself as a regulated hub for crypto innovation, thereby encouraging foreign entrants even though established local players such as Tiger Brokers and HashKey already serve the market.

This competitive environment illustrates Hong Kong’s efforts to strike a balance between innovation and stringent oversight.

New Stablecoin Rules Drive Further Market Interest

Regulatory developments have played a key role in shaping this landscape. Hong Kong introduced new stablecoin rules in August, prompting major institutions such as HSBC and ICBC to consider applying for licenses.

Soon after, the city approved its first Solana ETF in late October, moving ahead of the United States and reinforcing its ambitions in regulated digital-asset products.

Alongside these changes, Hong Kong also strengthened rules regarding self-custody of crypto assets. Authorities said that the shift aims to reduce cybersecurity threats rather than restrict user control.

Hoskinson: Bringing Stablecoins to Cardano Is NOT My Job

0

Cardano founder Charles Hoskinson has responded to criticism about his reluctance to attract a top-tier stablecoin to the blockchain. 

Tempers have flared within the Cardano community after an unidentified whale lost more than $6 million while swapping ADA for the USDA stablecoin.

User Loses $6M Swapping ADA for USDA

As reported by The Crypto Basic, a wallet that had been dormant for five years suddenly became active and exchanged 14.4 million ADA for US Dollar Anzens (USDA), a Cardano-based stablecoin.

However, instead of receiving the expected $6.9 million worth of USDA, the trader ended up with just 847,696 USDA, resulting in a staggering loss of approximately $6.05 million. Multiple sources have attributed the incident to the user interacting with an illiquid liquidity pool and opting for a lesser-known stablecoin, which caused severe slippage during the swap.

Cardano Fan Calls Out Hoskinson

Notably, Cardano community members have expressed mixed reactions to the development. Some users blamed the trader for overlooking clear indicators that the swap would return far less value, while others directed their frustration at Hoskinson.

In particular, an X user accused him of only reacting after problems occur and demanding to know why he has yet to launch the stablecoin that the community has been requesting.

Hoskinson Reacts

Reacting, Hoskinson responded emphatically that he is not responsible for bringing a stablecoin to Cardano. He posted the statement dozens of times consecutively, making it clear that launching a stablecoin on Cardano is not his responsibility.

While Hoskinson and his company, IOG, originally designed and built the network, Cardano has since evolved into an ecosystem where independent teams can develop products such as stablecoins.

Currently, Cardano’s stablecoin market remains relatively small, with a total market value of about $37.8 million. This represents only a fraction when compared to industry giants like Tether’s USDT.

Who Is Responsible for Bringing Stablecoins to Cardano?

Responding to users questioning who is responsible, Hoskinson clarified that the task falls to the Cardano Foundation. He noted that the Swiss-based nonprofit was allocated 600 million ADA, worth roughly $280.98 million, to bring stablecoins to the network.

Despite stressing that it is not his obligation, Hoskinson’s IOG previously partnered with COTI to launch the Djed stablecoin. However, adoption fell short of expectations, and the token currently has a market cap of just $3.82 million.

Hoskinson has also attempted to attract a major stablecoin issuer to Cardano. He has been in discussions with Ripple executives about bringing RLUSD, which recently surpassed a $1 billion valuation, to the Cardano ecosystem. While discussions are ongoing, no official launch date has been announced.

Urgent Need for Cardano to Improve Its DeFi

Meanwhile, Hoskinson stated that the trader’s recent loss highlights the urgent need for Cardano to strengthen its DeFi ecosystem by next year. He emphasized that while the network has the necessary technology, it is up to the community to collectively determine how to mobilize capital and integrations to support growth.

Will Avalanche Bounce From Support as $2.58M is Liquidated From Market?

Avalanche could test and bounce from key support as technical indicators show oversold conditions, and a potential for volatility breakout.

The Avalanche (AVAX) price has seen a 6.6% drop over the past 24 hours, currently changing hands at the $14.57 level. Over the past 7 days, AVAX has seen a 16.9% drop, and in the 14-day period, it is down 10.6%, indicating a sustained period of bearish price action.

Looking at the 24-hour chart, it shows a downward move in AVAX’s price, with a notable dip around the $15.70 range and recovery attempts that have brought the price back towards the $14.50-$14.60 region. Despite the slight recovery towards the end of the day, the overall trend remains bearish.

Avalanche Price Analysis

On the daily AVAX chart, the technical indicators suggest a continuation of the bearish trend with some signs of potential short-term consolidation. The price is currently trading just above the lower Bollinger Band, indicating that Avalanche is in an oversold condition. This is a positive sign in the long term.

Screenshot 2025 11 18T112452385
Avalanche

Notably, the contraction of the bands suggests that the market is in a period of consolidation with lower volatility. Typically, after this kind of narrowing, we can expect a volatility breakout, where the price makes a sharp move in one direction.

Further, the MACD is showing a bearish crossover, with the MACD line below the signal line. This suggests that momentum is still to the downside, and there is no immediate sign of reversal. The histogram is negative and shrinking, indicating that the selling pressure is easing, but it’s not yet turning bullish. 

If the price breaks upward above the $16.76, representing the middle band resistance, it may indicate a reversal or recovery. Conversely, if the price breaks downward below the $14.18 support, placed at the lower band, this could signify a continuation of the bearish trend.

AVAX Liquidation Data 

Meanwhile, the recent Avalanche liquidation data indicates significant selling pressure in the market, particularly affecting long positions. Over the 12-hour and 24-hour timeframes, the majority of liquidations were from long positions, with $678.98K and $2.58M being liquidated, respectively. 

Screenshot 2025 11 18T115430822

This suggests that AVAX has been in a strong downtrend, forcing many traders who were holding long positions to close their trades at a loss. In contrast, short liquidations during these periods were relatively smaller, indicating that bearish sentiment has prevailed, but not to the same extent as the pressure on longs.

Interestingly, in the 1-hour and 4-hour timeframes, the data shows more short liquidations, with $35.76K and $58.63K liquidated, respectively. This could indicate brief price rallies or squeezes, causing more short sellers to be caught off guard.

Ultimately, if the price falls below the support and the liquidation trend continues, further downside movement could ensue. However, if there is a significant shift in market sentiment or a potential short squeeze, there may be a chance for a rebound.

Cameron Winklevoss Calls Bitcoin Dip Below $90K a ‘Final Chance’ to Buy

0

Bitcoin slipped under the $90,000 mark for the first time since April, rattling traders already shaken by weeks of volatility. 

However, Gemini co-founder Cameron Winklevoss maintains that this downturn may be the final opportunity for investors to buy Bitcoin at these levels.

Bitcoin fell to $89,537 at press time, losing 6% in a day and dropping 4.37% for the year. The decline pushed the asset below a crucial threshold that traders have been watching closely throughout 2025.

Meanwhile, in a latest post on X, Cameron Winklevoss argued that sub-$90,000 prices may soon disappear for good. His comment reflects his long-standing view that short-term weakness does not change Bitcoin’s long-range trajectory.

Winklevoss Brothers Maintain Long-Range Bullish View

Cameron and Tyler Winklevoss have repeatedly described Bitcoin as a modern counterpart to gold. 

Earlier this year, they said the asset could eventually reach $1 million, driven by its strengthening role as a store of value. They believe adoption is still in its early stages and that future investors may view today’s prices as historically low.

This perspective, in turn, shaped Cameron Winklevoss’ latest remarks, which frame the current decline as an opportunity rather than a threat.

October Turbulence Sets the Stage for the Current Slide

The ongoing correction began shortly after Bitcoin posted a new all-time high of $126,200 on October 6, 2025. Subsequently, the situation worsened on October 10, when nearly $19 billion in leveraged positions vanished in a single day. This liquidation wave accelerated the current correction.

Analysts note that the pullback falls within Bitcoin’s usual post-halving cycle. Historically, major peaks occur 400–600 days after each halving, including the one completed in April 2024. This timing has added context to the current volatility.

Multiple Forces Are Driving Market Stress

Several industry executives blamed the weakness on ETF outflows, whale selling, and rising geopolitical tensions. Together, these factors have contributed to persistent uncertainty and a reduction in investor confidence.

According to The Kobeissi Letter, the current decline looks more like a routine unwinding of leverage rather than a shift in fundamentals.

Nevertheless, fear has risen sharply. CryptoQuant analyst JA Maartun reported that the Fear & Greed Index fell to 10, its lowest reading since July 2022.

Industry Executives Expect a Bottom to Form Soon

Despite the gloom, some industry executives believe the worst may be near.

For instance, on Monday, Tom Lee, chairman of BitMine, told CNBC that traders are still processing the October 10 liquidation wave. Furthermore, he added that uncertainty around possible Federal Reserve rate cuts in December continues to pressure markets.

Lee said technical indicators now suggest that a market bottom may form this week. He also referenced insights from Tom Demar of Demar Analytics, who similarly sees signs of exhaustion in the sell-off.

Matt Hougan, CIO at Bitwise Asset Management, likewise agreed that a rebound may be near. In fact, he called current prices a “generational opportunity” for long-term investors.

Hougan pointed to concerns about the economy, AI valuations, and President Donald Trump’s tariffs as factors in the current market stress.

Predictions of a Strong Rebound Later This Year

Tom Lee forecasts Bitcoin to regain lost ground if equities strengthen in the coming months. Specifically, he believes a stock market rally could push Bitcoin to a new all-time high before year-end. Ultimately, this view offers some optimism as traders search for stability in the weeks ahead.

Chainlink Breaks Below Crucial Fib Support: Where Is Its Next Stop?

The Chainlink price is struggling to hold key support levels, with reduced futures open interest, raising questions about its next move.

Notably, Chainlink (LINK) is currently priced at $13.30, reflecting a 5.8% drop over the past 24 hours. When comparing LINK’s performance to Bitcoin and Ethereum, it mirrors the market downturn, especially as Bitcoin has fallen below $90,000.

Over the past 7 days, LINK has seen a 10.6% slump, while over the past 14 days, it is down 17.9%. However, with the price trend witnessing declines over these timeframes, the question remains: Will Chainlink manage to rebound and recover, or will it continue to fall further?

Chainlink Price Analysis

Looking at Chainlink’s weekly chart, the crypto asset still faces a bearish trend, with the price struggling to hold above key support levels. The Fibonacci retracement levels show that LINK has tested the latest support around the 0.786 level at $13.91 and broke below it. 

Chainlink
Chainlink

If LINK fails to reclaim and maintain this level, it may fall further towards the $12.00-$13.00 region, with the 1.0 Fibonacci level sitting at $10.11 offering the next major support.

Meanwhile, as for resistance, the $16.89-$19.00 range stands out as a key zone that LINK may struggle to surpass in the short-term. If the price can manage to break above these levels, it could signal a shift towards a bullish recovery.

In terms of momentum, the MACD indicator is signaling bearishness. Specifically, the MACD line (blue) remains below the signal line (orange), and both are in negative territory, suggesting that the current downtrend is likely to persist. The histogram, which is also in the red, shows that the selling pressure is still in play.

LINK Open Interest Declines

Looking at the Chainlink Futures Open Interest chart, there is an interesting correlation between the LINK price and the open interest in futures contracts over the past several months. Specifically, open interest shows a steady increase in futures activity as the price of LINK rises.

Screenshot 2025 11 18T111628004

From June to August 2025, there was a significant surge in open interest, reaching its peak around August, which coincided with a rise in LINK’s price to above $25. However, as LINK’s open interest started to fluctuate downwards in late-August and into September, the price followed a similar downward trend.

As of November 18, open interest stands at $527.21 million, indicating reduced speculative activity as the market sentiment has turned bearish. This could also signal a potential for stabilization or even a rebound, as lower open interest may indicate that less pressure is being placed on the asset.

Massive Bullish Divergence to Spark XRP Reversal: Analyst

0

XRP trades well within bearish territory, but an emerging bullish divergence on the daily chart could spark a price reversal to greater heights.

XRP Shows Resilience

No doubt the market is falling, but XRP has shown strength compared to most other cryptocurrencies. Bitcoin is down 14.8% in the past seven days; Ethereum and Solana have corrected 16.2% and 18% in the same timeframe, but XRP has a milder 13% decline.

Analyst “Guy on the Earth” is in awe of this resilience. He highlighted that he couldn’t believe that XRP would be above $2 when Bitcoin dropped to $91,000. Notably, BTC has fallen further to $89,520, but XRP remains well above the $2 price mark, changing hands at $2.14.

XRP Could Bounce from Here

Furthermore, the commentator identified a developing bullish divergence on the daily chart, with the potential to spur a price rebound. An accompanying chart further elaborates on the divergence between XRP’s price action and the relative strength index (RSI).

XRP Bullish Divergence

XRP has been trending on a lower low pattern since the October 2 high of $3.10. The coin fell from the resistance area to the October 10 low and has continued to make new lows after each lower high formation.

However, the RSI has been making higher lows. These conflicting developments align with the bullish divergence pattern, which usually precedes a price recovery. The analyst expects the rebound to start playing out soon, if it will.

Notably, the target for this run would be a retest of the resistance at $2.70, where it previously faced rejection during a lower high formation on October 27.

Prospects of Further Price Lows

Nonetheless, XRP could correct further from here, according to “Guy on the Earth.” He warned that the $2.2 support was an opportunity for paper hands to exit the market, and the bull market support around $1.90 and $2 is the “last chance.”

If bears conquer the $2 support as they did to the $2.2 zone, then the analyst predicted a longer consolidatory phase. He asserted that XRP could reach $0.85, a low last seen in mid-November 2024. From the current trading level, this represents a 60.2% decline.

Meanwhile, parallel analyses do not agree with this. Cryptollica shared that while XRP might drop below $2 to retest $1.95, he expects a bounce from that area to a new all-time high of $10 per coin.

Cardano Founder Reveals Official Launch Date for Midnight’s NIGHT Token

0

Charles Hoskinson, the founder of Cardano, has announced the official distribution and trading date for NIGHT, the native token of Cardano’s privacy-focused sidechain, Midnight. 

Speaking at the Midnight Summit, which began yesterday, he confirmed that the highly anticipated NIGHT token will launch on December 8, 2025. On that date, the Midnight team will distribute NIGHT to eligible recipients. At the same time, multiple exchanges will list the token, with trading commencing immediately. 

NIGHT Token Distribution 

The announcement comes a few months after the Glacier Drop’s launch. This airdrop was open to 34 million users across eight blockchains, including Cardano, XRP Ledger, Ethereum, Solana, and Bitcoin, to claim a share of the NIGHT token. Eligibility was based on users holding $100 worth of their native assets at the time of the snapshot.

While claims opened on August 5, the actual NIGHT token distribution will begin on December 8, just weeks from now. Once distribution starts, trading will go live immediately on multiple exchanges. 

For context, eligible beneficiaries will only receive a portion of their claimed NIGHT tokens on December 8, 2025. The remainder will be distributed gradually over the next 12 months in four equal 25% tranches, unlocked every 90 days to promote long-term network engagement. 

In the meantime, the Midnight airdrop is currently in the Scavenger Mine phase, which requires users to earn a share of NIGHT tokens for completing computational tasks. This phase will end tomorrow, on November 19. The team has already minted all 24 billion NIGHT supply in anticipation of the distribution and trading. 

Midnight Roadmap 

Meanwhile, Hoskinson outlined Midnight’s broader rollout plan. Once NIGHT trading starts in December, the next phase of Midnight’s launch will begin in the first quarter of 2026 with the introduction of a federated mainnet.

He disclosed that this early mainnet will operate in a hybrid model. Specifically, Cardano’s development arm, Input Output Global (IOG), will manage some nodes, while others will be run by major corporate partners, including one unnamed Fortune 500 company.

During this federated era, more than 100 ecosystem partners already building on the Midnight testnet will be able to deploy their dApps and begin using the network in real production environments. 

Furthermore, the Cardano founder disclosed that after the launch of Midnight’s federated mainnet, the team will roll out the project’s incentivized testnet. According to him, this incentivized testnet could go live in the second quarter of next year. 

This phase will onboard Cardano stake pool operators (SPOs) who intend to run Midnight nodes under real network conditions. Through this program, SPOs will test performance and prepare for Midnight’s transition to its final form, which Hoskinson referred to as a “hard-forked network for the final consensus algorithm from the mainnet.” 

Here is The Indicator That Shows Zone to Buy XRP Dip

0

With the market in a state of panic, Santiment says the reliable XRP MVRV indicator suggests that this may be a good time to consider buying the XRP dip.

Bitcoin fell under $90,000 this morning, dragging altcoins like XRP down with it. Notably, while the XRPL native token has shown resilience in holding above the $2 price mark, it has corrected by 3.65% over the past 24 hours and by 13% in the previous week.

Buy the XRP Dip: Santiment

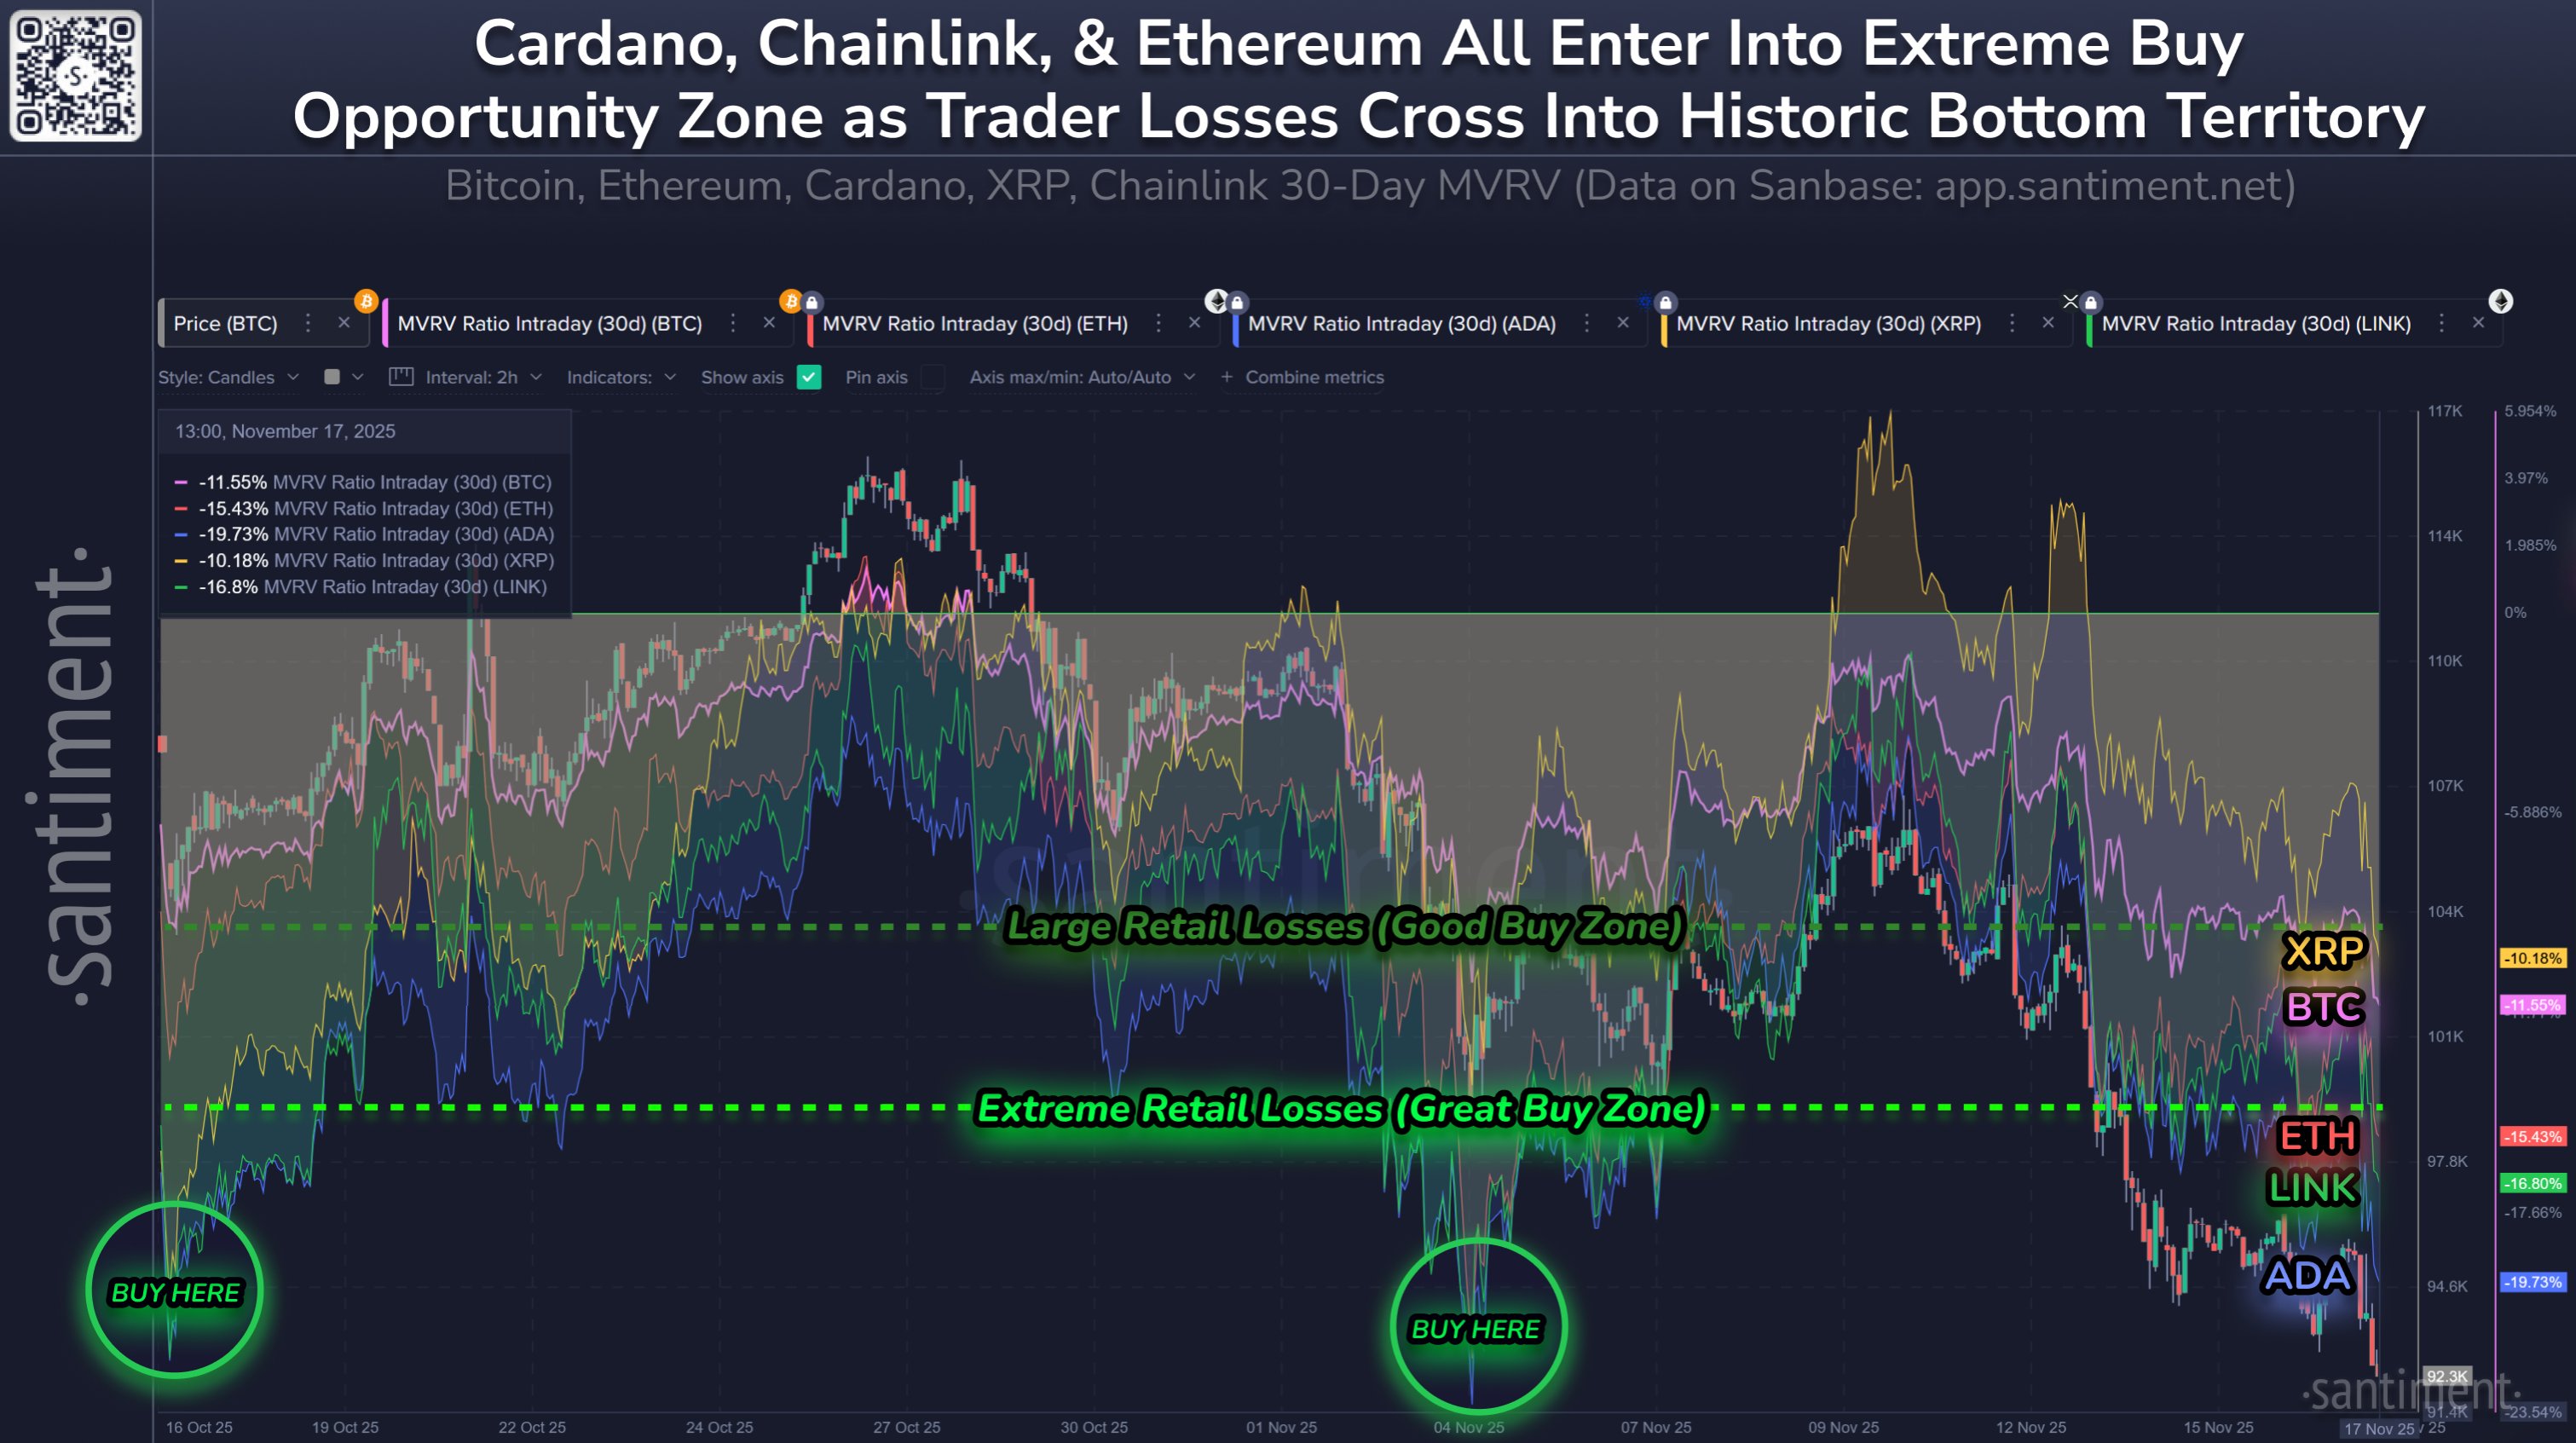
However, this might be the best time to buy the dip, according to data from Santiment. The market intelligence platform highlighted in a Monday social media post that most of the major cryptocurrencies are becoming unprofitable for short-term holders.

Wallets that bought XRP in the past 30 days are experiencing an average portfolio decline of 10.2%, indicating significant pain for average trading returns. While this may be unfortunate for those affected, Santiment emphasized the need to buy now. The platform noted that this is a “good buy zone” for XRP.

XRP MVRV Supports Clarion Buy Call

Strengthening this conviction, Santiment employed the market value to realized value (MVRV). For the uninitiated, the indicator compares the current market price of an asset with its realized value. This metric measures the value of the asset in relation to the last time it was moved, showing when holders are in a loss or in profit.

Santiment noted that the MVRV is a good metric to identify good buy zones. While support and resistance provide similar context, the MVRV offers a more accurate reference. The platform highlighted that the lower the MVRV, the higher the chances of a rapid rebound.

“Buy assets when average trader returns of your peers are in extreme negatives,” Santiment added.

Meanwhile, the data shows that XRP has fared better in terms of performance compared to other major assets in the past 30 days. Although this is positive for prices, it means XRP has a higher MVRV Z-score.

The tweet shows that Bitcoin holders who bought in the past 30 days have an average loss of 11.5%, also presenting a good buy zone. However, other assets like Ethereum, Chainlink, and Cardano are in the “extreme buy zone” territory, with performances of -15.4%, -16.8%, and -19.7% for buyers in the past month.

XRP MVRV Flashes Buy Signals

XRP at $2 is a Blessing

Notably, Santiment’s analysis adds to the growing sentiment that XRP is a good buy at the current price levels. Coach JV also shares this sentiment, stating earlier this month that XRP trading around the $2 support is a blessing.

He advised taking the opportunity to load up, suggesting that one’s disposition towards this dip would determine their financial status in the near future. Income Shark also believes this is true, stating that those who missed the chance to buy XRP under $2 would soon have the opportunity.

Here Are Updated Timelines for Remaining Spot XRP ETF Launches

0

XRP community analyst Zack Rector has released a new breakdown of the updated XRP ETF rollout, outlining when each remaining issuer is likely to launch.

His review clarifies confusion around dates, filing requirements, and which issuers have properly triggered the SEC’s 20-day countdown rule.

Why Some XRP ETFs Can Launch Without SEC Sign-Off

Rector explained that U.S.-based spot ETFs no longer require explicit SEC approval if issuers remove the delay clause from their S-1 filings. Once that language is removed, a 20-day automatic countdown begins, allowing the product to go live even without the agency’s final sign-off.

This is how Canary Capital launched its Litecoin, XRP, Bitwise, and Grayscale Solana products during the U.S. government shutdown.

Canary’s XRP ETF already went live on November 13 after making amended filings on October 24.

Confirmed Launch Windows: Bitwise, Grayscale, Franklin Templeton

After reviewing the SEC’s EDGAR database, Rector shared the verified timeline:

Bitwise — Earliest Launch Date

The Bitwise XRP ETF has the earliest launch window of November 20, just two days away. Bitwise updated its S-1 on October 31 with the correct language, placing the earliest launch date on Friday.

Interestingly, in a tweet on Monday, Bitwise even teased an upcoming development without adding context:

“You will not believe what I just heard,” the statement read, accompanied by an anticipating emoji.

Members of the XRP community believe the firm is referring to its XRP ETF.

Grayscale and Franklin Templeton Launch Dates

Meanwhile, the Grayscale XRP ETF has a launch date of November 24. Grayscale filed its updated S-1 on November 3. The 20-day mark falls on Sunday, November 23, making Monday, November 24 the expected launch date.

Likewise, the Franklin Templeton XRP ETF is set for November 24 after the issuer updated its S-1 on November 4 with the proper language.

Rector noted confusion online about Franklin allegedly launching on November 18, clarifying that no filing supports that date.

Issuers That Failed to Trigger the Countdown

Rector highlighted three issuers that have not updated their filings correctly and therefore have no active countdown:

  • WisdomTree and CoinShares — Last Updated October 10
    No updated S-1 has been filed since, and the required language is missing.
  • 21Shares — Updated November 7, but With Incorrect Language
    Rector expressed disbelief at the oversight, noting that 21Shares’ updated S-1 still contains the delay clause, preventing the ETF from moving forward.

Unless the SEC decides to proactively approve all remaining spot XRP ETFs at once, these issuers will remain behind.

No Major Sell-the-News Event Expected

Rector said he does not expect another heavy sell-the-news reaction once the remaining ETFs go live. In his view, the recent pullback in XRP price after the Canary Capital ETF launch was the true sell-the-news moment.

He argued that historically, ETF-induced pullbacks have created major buying opportunities, pointing to Bitcoin’s correction to $48,000 before surging to $120,000, and Ethereum’s 40% drop before rallying 130%.

Rector added that he continues to increase his XRP long position at these levels.