Home Blog Page 424

XRP Price Prediction for 2026: Here Are 4 Reasons Why XRP Could Hit $5

0

Amid the ongoing bearish trend impacting XRP, experts believe the token could reach a new all-time high of $5 by next year. 

The asset currently trades at $2.17, down 10.97% over the past month and 9.21% over the past week. Major cryptocurrencies like Bitcoin, Ethereum, and Cardano have also recorded significant losses in the same period.

Despite the broader downturn, XRP remains one of only three top-10 cryptocurrencies still in positive territory year-to-date. Although its YTD growth is now modest at 4.6%, the token maintains a substantial yearly upside of 92%.

XRP to Hit $5 in 2026?

Meanwhile, last year, optimism was high, with many projections calling for XRP to reach ambitious targets, such as $5 by the end of 2025. However, with just six weeks left in the year and the market under sustained pressure, XRP remains trapped in the $2 range.

Now, commentators have shifted the timeline to next year. For instance, an X user predicted that XRP would hit $5 by 2026, assuming “everything goes well.”

From its current price, XRP would need to rally 131.41% to reach the $5 target. This surge would lift its market cap to over $300 billion.

4 Factors That Could Push XRP to $5

Multiple factors support the price outlook. For context, XRP’s November 2024 breakout was triggered by the resolution of the SEC v. Ripple lawsuit.

For five years, that case cast a shadow over XRP’s prospects, discouraging institutional interest and limiting broader adoption. As the lawsuit ended, XRP jumped to $3.65 before sliding back to $2.17 amid the market-wide downturn.

With the legal uncertainty finally behind it, several other catalysts could help pave the way for the next wave of XRP’s rally, potentially pushing it toward the $5 milestone in the coming year.

ETF Inflows

The broader crypto market has already witnessed how Bitcoin reacted to strong inflows into its spot ETFs. A similar scenario could unfold for XRP.

Earlier this month, the first U.S. spot XRP ETF officially launched on Nasdaq, led by Canary Capital. According to SoSoValue data, the fund has already recorded net inflows of $276 million.

More spot XRP ETFs from issuers such as Franklin Templeton and 21Shares will debut later this month, potentially boosting cumulative inflows. Given how ETF demand helped fuel Bitcoin’s rally earlier this year, XRP could experience a comparable trajectory if inflows accelerate.

XRP Treasury Efforts

Corporate adoption is also emerging as a potential catalyst for XRP. Several publicly traded companies, including VivoPower, Webus, Wellgistics Health, and Worksport, have announced plans to establish or expand their XRP treasury holdings.

In addition, Ripple recently joined a joint venture with SBI, Kraken, and other firms to create a $1 billion XRP treasury, the largest corporate XRP treasury to date.

As more companies accumulate XRP for their reserves, the circulating supply on the open market could decline significantly. This reduction in available tokens may ease selling pressure and help drive the asset’s price higher over time.

Institutional Adoption of Ripple’s Payment Solution

Ripple remains a leading provider of cross-border payment infrastructure, with XRP serving as one of its core bridge assets. Financial institutions such as Tranglo and SBI have already integrated Ripple’s technology for cross-border settlements, and further adoption is expected.

As Ripple’s payment solutions gain traction, institutional interest in XRP could strengthen accordingly.

Favorable Crypto Market Outlook

Although the crypto market has struggled in recent weeks, many analysts anticipate a shift in momentum. JPMorgan recently forecast that Bitcoin could reach $170,000 next year—a move that could ignite a broader market-wide bull run.

Historically, assets like XRP have followed Bitcoin’s trajectory during such rallies, suggesting the token may benefit from any renewed bullish sentiment.

While these catalysts could help propel XRP toward $5 next year, it is important to note that external macroeconomic pressures could still undermine upward momentum, as seen earlier this year.
Analyst Releases Four XRPBTC Macro Simulation Models with an Average XRP Price of $11

0

As XRP gains against Bitcoin, a market analyst has presented four XRPBTC macro simulation models of the possible directions the pair could take from here.

Notably, the crypto market has dropped sharply since October, and XRP has moved in the same direction with a decline of more than 25% over this period. XRP now trades near the lower end of the $2 range. 

XRPBTC Simulation Models

However, despite the broader downturn, XRP has held up better than Bitcoin this month. BTC has seen an even steeper pullback, which has allowed XRP to gain 3.71% against the crypto firstborn in November. With this strength, the XRPBTC pair now stands at 0.00002374.

Amid the ongoing trend, market analyst EGRAG Crypto released a simulation that presents four possible macro outcomes for the XRPBTC pair. 

He stressed that this commentary does not seek to predict the future. Instead, he built the models to show multiple possibilities regarding XRP’s direction from here. After reviewing the data from all four scenarios, he arrived at a mean XRP value of $11.

XRPBTC 5D Chart EGRAG Crypto
XRPBTC 5D Chart | EGRAG Crypto

Specifically, EGRAG explained that his analysis uses different XRPBTC ratios linked to specific chart structures. Each structure supports its own technical logic.

Descending Triangle Breakdown and Breakout

For Scenario A, EGRAG considered a possible breakdown from the descending triangle. Notably, this event would lead to an XRPBTC ratio of 0.00001030. Based on this ratio, a BTC price of $100,000 would place XRP at $1.03, while a BTC price of $30,000 would put XRP at $0.309.

According to the market analyst, this remains the bearish option, but it still fits within the range of realistic macro corrections. However, a positive breakout of the same descending triangle is not out of the question.

This leads to Scenario B, which considers a bullish breakout from the descending triangle. Such a move would lead to an XRPBTC ratio of 0.000048. According to EGRAG, this type of breakout usually marks the first major expansion wave for XRP. With this ratio, BTC at $100,000 would lift XRP to $4.80, and BTC at $170,000 would raise it to $8.16.

XRP Falling Wedge and Bull Pennant Breakout

Meanwhile, Scenario C focuses on a break above the macro falling wedge. This longer-term bullish structure leads to a ratio of 0.000073. EGRAG called this a high-probability path if XRP manages to break out of the multiyear compression phase. At this ratio, BTC at $100,000 would put XRP at $7.3, while BTC at $170,000 would move XRP to $12.41.

Notably, his final setup, Scenario D, considers a bullish pennant breakout, which he believes is the strongest structure on the macro chart. This model would result in a ratio of 0.00013. Under this, XRP would reach $27 if BTC climbed to roughly $207,700. If BTC instead remained at $100,000, XRP would stand at $13.

According to EGRAG, these scenarios do not represent XRP price predictions. However, all the models combine to present a full view of potential price directions, with the average result across all simulations placing the XRP price at $11.

Here’s One Sure Way XRP Price Could Go Up

0

Amid the ongoing discussions surrounding XRP ETFs, we recently evaluated how these products could provide a sure avenue for an XRP price spike.

The XRP community has been sandwiched between bullish and bearish developments over the past few days. On the one hand, the community recently witnessed the launch of the first pure spot XRP ETF from Canary Capital. However, on the other hand, the price has not reflected the move, especially considering the ETF’s success.

Canary Capital XRP ETF Sees Initial Success

Specifically, the Canary Capital XRP ETF (XRPC) saw about $245 million worth of inflows on its debut, outpacing the BlackRock iShares Bitcoin ETF (IBIT), which observed $111.6 million on its first trading day last January. However, on the second day, XRPC’s flows cooled, but remained positive at around $27 million.

After two trading days, XRPC has already locked up 120.69 million XRP worth $275 million despite coming from an asset manager with less renown and AUM than other heavyweights like Grayscale, Franklin Templeton, and Bitwise. As a result, multiple XRP proponents believe these other products could scoop up more XRP tokens when they launch.

Specifically, besides the Canary Capital fund, six more spot XRP ETF filings lie on the SEC’s desk. These include filings from Bitwise, Grayscale, Franklin Templeton, 21Shares, CoinShares, and WisdomTree. Issuers like Grayscale and Bitwise have amended their S-1s to launch later this month.

A Projected $800M Monthly Inflow

Amid the anticipation, we recently assessed how much impact they would make on the XRP price if these six products became successful, not just on their first trading days. Specifically, if all seven products, including XRPC, bring in $800 million every month for a year, they would purchase $9.6 billion worth of XRP within this period.

For perspective, the $800 million figure is only about 2.9x higher than XRPC’s two-day inflow of $275 million. Considering six more products would have to combine their inflows to bring in this figure across 20 trading days, it looks highly possible. However, it is not a guarantee.

Interestingly, the projected $9.6 billion inflow still represents a lower value than the $10 billion Canary Capital CEO Steven McClurg predicted for the first month of inflows. However, if the projection materializes, the impact on XRP price could be massive.

Notably, capital inflows do not impact an asset’s market cap at a 1:1 ratio, often leading to higher spikes in valuation in what most analysts call the market cap multiplier. For instance, market watcher Dom spotlighted a 272x multiplier in May, with $61 million worth of capital inflows adding $16.6 billion to the market cap.

One Sure Way XRP Price Could Rise

However, for this assessment, we consider a more modest 100x multiplier. With this, the $9.6 billion inflow could lead to an additional valuation of $960 billion for XRP. Currently, XRP has a market cap of $136 billion, with the addition of $960 billion leading to a potential valuation of $1.095 trillion. 

Considering XRP’s circulating supply of 60 billion tokens, this translates to a price of around $18.3 for XRP, representing a 720% increase from the current price of $2.23. Interestingly, as far back as October 2023, when XRP traded for $0.51, analyst Dark Defender predicted a possible XRP price rally to $18 depending on how its Elliott Wave structure unfolds.

This assessment shows that XRP ETFs remain one of the avenues through which XRP could reach higher prices, much like the impact of Bitcoin ETFs. However, just like the reaction from Bitcoin’s price in early 2024, the XRP price seems to be seeing initial dips. Notably, such price impact rarely emerges immediately due to how ETF structures work.

XRP Could fall to $1.02 or Rise To $5.5, Analyst Shares Why an Upward Break is More Likely

0

With XRP now sitting at a crossroads within a symmetrical triangle, market analyst EGRAG has shared why an upward break may be likely.

EGRAG’s disclosure comes at a time when XRP is attempting a recovery push from the ongoing market collapse. Specifically, after dropping to a two-week low of $2.08 earlier today, XRP has recovered to the $2.19 price at press time. With a 1.36% gain so far today, the token is on track to record its first intraday gain in a week.

XRP’s Symmetrical Triangle

As the recovery attempt kicks in, EGRAG recently reviewed XRP’s chances of breaking outside a persistent symmetrical triangle. For context, XRP started trading within this symmetrical triangle after it collapsed from the $3.66 peak in July. Since then, it has witnessed persistent lower highs, leading to the formation of the triangle’s descending trendline.

XRP Symmetrical Triangle EGRAG Crypto

Notably, the ongoing downtrend, which gained momentum following the Oct. 10 market crash, has pushed XRP toward the lower trendline of the symmetrical triangle. This trendline began forming as far back as November 2024 on the back of the upsurge during the U.S. elections.

EGRAG Shares Why a Bullish XRP Breakout is Likely

Despite the downward push, EGRAG insisted that bullish odds appear to be increasing. Essentially, while he maintains that XRP could break below the lower trendline or above the upper trendline, the chances of a breakout above the upper trendline have increased.

One reason he insists that an upward breakout remains likely has to do with XRP’s relative strength index (RSI). As the price has faced persistent declines over the past few weeks, EGRAG noted that XRP’s 3-day RSI has dropped to an oversold area, sending a “very strong” signal. 

Secondly, the market pundit suggested that the pattern’s symmetry favors a bullish breakout. Notably, XRP has declined to a region between $2 and $2.2, which EGRAG calls a defense zone for the bulls. If the bulls maintain this level as they have done over the past few days, a market recovery could push prices upward.

Breakout Targets

Data from his chart shows that such an upward push would successfully breach the upper trendline of the triangle once XRP recovers the $2.65 price level. The last time XRP saw this price was on Oct. 27. A rally to this area would represent a 21% increase from the current price of $2.19. 

After this breakout, XRP could first face resistance around the $2.79 price area, which aligns with the 50% Fibonacci retracement point. From this area, XRP does not have any significant Fibonacci resistance until the $5.5 breakout target. This aligns with the 61.8% Fibonacci retracement and represents a 109% increase from the breakout price.

However, it is important to note that EGRAG admits that while there is the likelihood of an upward breakout from the triangle, a downward breakout is not out of the question. Notably, a drop below $2.06 could lead to a break below the lower trendline. If this happens, the breakout target is $1.02, representing a 50% drop from the price at breakout.

Here Are Key Resistance Levels BNB Must Break to Reach $1,109

BNB shows signs of potential recovery, but there are multiple key resistance levels it has to break for a possible surge.

The BNB price has experienced some volatility over the last 24 hours, fluctuating between $886.57 and $923.98, with the current price of $919.17 representing a 1.5% decline. Despite the drop, the price shows signs of recovery, climbing back towards the higher end of its daily range.

In the past seven days, BNB has decreased by 5.6%, showing a slight downward trend. Over the last 14 days, the price has also experienced a 2.7% drop, indicating a more moderate decline.

Additionally, the BNB market cap stands at $127.09 billion, down 1.7% in the past 24 hours. This negative performance, which also left Bitcoin reeling below $90,000, has left speculative traders cautious and uncertain. Will BNB bounce back to test resistance?

BNB Price Analysis

The daily BNB/USD chart from TradingView indicates a slight upward movement in the price. This short-term recovery is happening amidst a generally bearish trend in recent months. The price remains below both the blue Tenkan-sen line at $952.67 and red Kijun-sen line at $1,033.50, which act as immediate resistance levels to break for a surge above $1,100.

Screenshot 2025 11 18T140420261
BNB

The Ichimoku Cloud itself is still acting as further resistance at $1,109.66, with the Cloud turning red ahead, signaling that the bearish pressure could persist later. 

On the Awesome Oscillator (AO), the histogram remains negative, showing weaker momentum and further emphasizing the ongoing lack of buying strength in the market. Despite the negative indicators, the price is holding above the key support level of $885.83, which may act as a crucial level to watch. If BNB can maintain its price above this level, it could set up the potential for a rebound.

A Bullish Divergence Incoming?

Elsewhere, as per an analysis from Cryptorphic on November 17, BNB is holding above a key demand zone between $900 and $925, showing signs of potential bullish momentum in the 4-hour timeframe. 

Image

This price range has acted as a support level, with BNB currently maintaining its position on it. A key technical pattern forming here is a bullish divergence, where the price remains flat while the Relative Strength Index is showing higher lows, suggesting that momentum could shift to the upside in the near future.

Cryptorphic also highlights that a breakout above the descending trendline would confirm the bullish momentum, potentially leading to a rise in price towards higher levels. However, if BNB breaks below $880, it will invalidate this bullish setup and weaken the structure.

Expert Outlines Key Lesson as User Loses 14.4 Million ADA

0

Renowned crypto analyst Mason Versluis highlights crucial lessons on profit-taking, liquidity, and risk management after a long-term Cardano holder lost more than $6 million in a single trade. 

The recent loss incurred by a Cardano investor has continued to spark discussions within the broader crypto community. According to details shared by Versluis, the investor who once held 14.4 million ADA refused to sell even after the stash soared to $45 million. This occurred when ADA clinched an all-time high of $3.10 during the 2021 bull run. 

Rather than securing any portion of this life-changing wealth, the investor held through the downturn until the value sank to about $7 million. Versluis indicated that things got even worse when the investor attempted to swap the entire 14.4 million ADA into the Cardano-based stablecoin USDA. Due to extremely low liquidity, the swap resulted in a $6.05 million loss, leaving him with only about $847,000. 

Crucial Lessons 

Notably, Versluis outlined key lessons crypto investors should take from the incident. First, he stressed the importance of taking life-changing profits when the opportunity presents itself. 

When an investment grows to a level that can materially improve one’s financial future, he said, it is crucial to secure a portion of those gains. In this case, he pointed out that the trader could have easily sold $10–$20 million of his ADA when the stash was valued at $45 million.

Second, Versluis cautioned against converting assets into illiquid stablecoins, as the investor did with USDA. He noted that the most reliable and liquid stablecoins currently operate on the Ethereum and Tron networks, and investors should prioritize using them for large conversions, regardless of whether they are strong believers in Cardano. 

CryptoQuant: 40% of Strategy’s Bitcoin Holdings Now at Loss

0

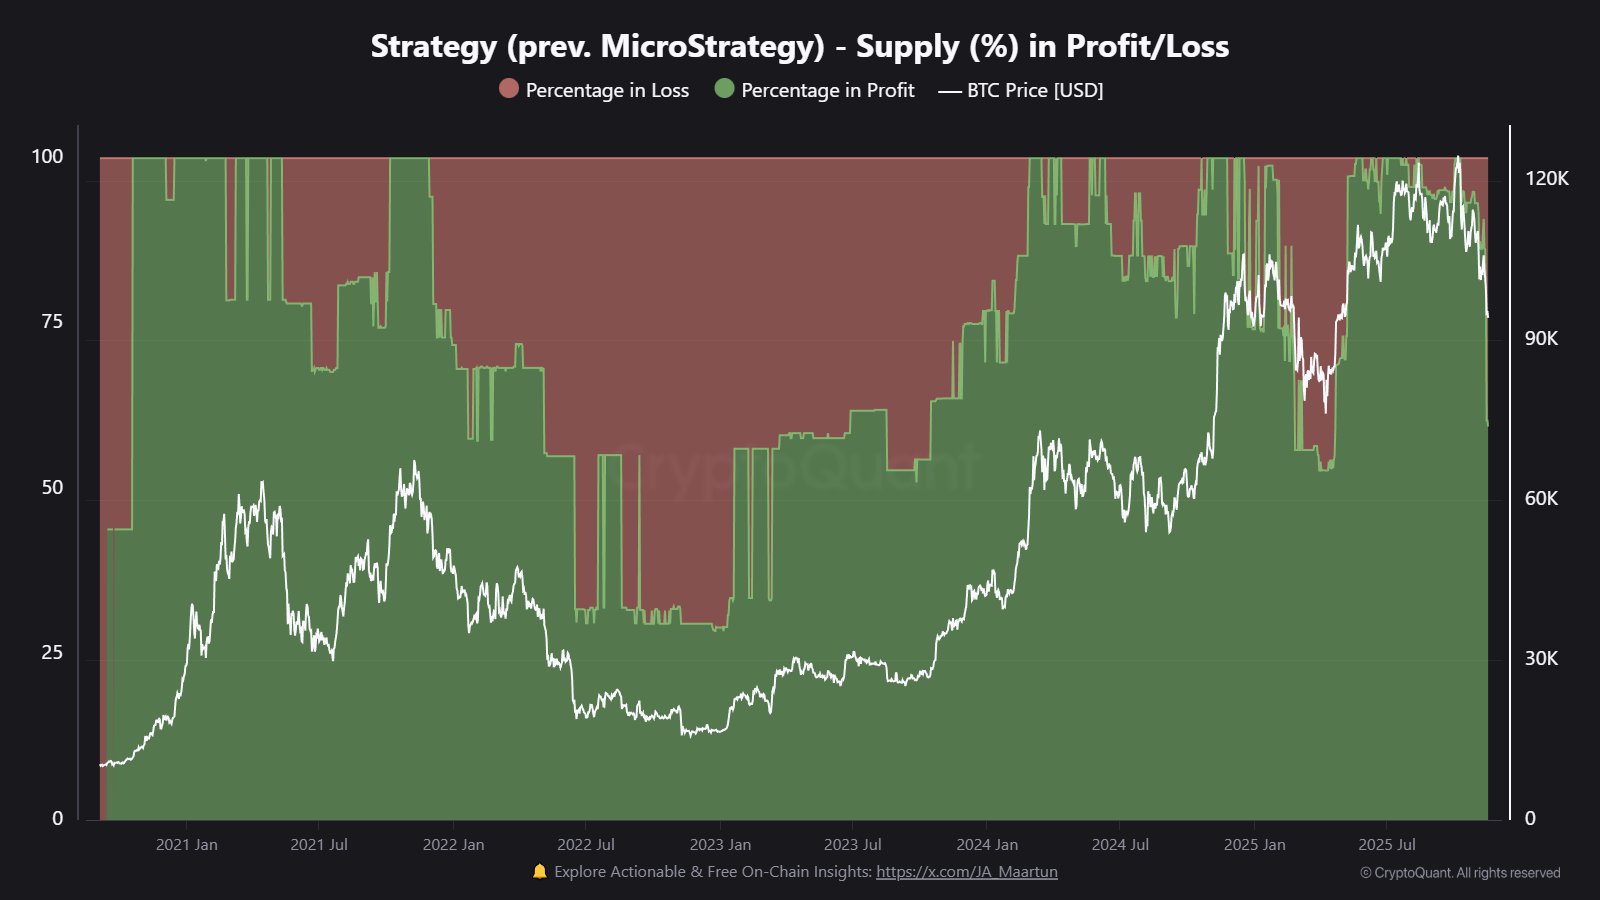
A recent CryptoQuant analysis reveals that up to 40% of the Bitcoin portfolio of Michael Saylor’s Strategy is now seeing losses.

Bitcoin (BTC) has been on a downward slope over the past week, posting intraday losses in six of the last seven days, and is on track to record a seventh loss over eight days. Within this period, Bitcoin has dropped nearly 14%, losing the $100,000 and $95,000 support levels to trade at $91,367 at press time.

Saylor Remains Unfazed by Recent Bitcoin Downtrend

Despite the downtrend, Michael Saylor’s Strategy (formerly MicroStrategy) remains unfazed, instead regarding the dip as an opportunity to procure more BTC. In the latest instance, Saylor disclosed on Monday that Strategy had bought an additional 8,178 BTC tokens for $835.6 million at a price of $102,171 per BTC. 

Notably, with this purchase, the company confirmed that it now holds 649,870 BTC, representing 3.2% of the circulating Bitcoin supply, which it procured for $48.37 billion. With BTC now trading for $91,367 per token, Strategy’s holdings have a worth of $59.38 billion. This represents an overall profit of 22.7%.

40% of Strategy’s Bitcoin Portfolio in Loss

However, a recent CryptoQuant analysis suggests that, in an analytical breakdown of the Strategy holdings, 40% of the portfolio is now seeing losses. According to CryptoQuant, these losses are a result of the recent purchases Strategy made, which have reduced the portfolio’s overall profit ratio.

Strategy Bitcoin Portfolio CryptoQuant
Strategy Bitcoin Portfolio | CryptoQuant

Specifically, for the latest 8,178 BTC purchase, Strategy has lost $88 million within a few days, with the investment now down 10.5%. 

Interestingly, the latest buy is one of three purchases Strategy has made this month despite the ongoing market downturn. Notably, on Nov. 3, Saylor confirmed that Strategy bought 397 BTC for $45.6 million. Moreover, a disclosure on Nov. 10 revealed that the company also amassed 487 BTC for $49.9 million.

Together, Strategy has bought 9,062 BTC for $931.1 million in November. At current rates, these tokens are worth $827.96 million, representing a loss of over 11%. This has contributed to the losses suffered by 40% of the company’s Bitcoin holdings.

Strategy Remains in a Strong Position

However, with an overall profit ratio of 22.7% and a paper gain of $11.46 billion, Strategy remains in a strong position despite the poor performance of the latest purchases. 

The company has seen worse days, especially from mid-2022 to early 2023, when up to 75% of its holdings were in loss. During this period, Strategy’s Bitcoin holdings suffered an overall performance of -33.4%, with losses of around $1.32 billion. In late October 2024, the overall performance went positive and has remained so since then.

Nonetheless, the latest profit ratio of 22.7% is a massive drop from the peak of 68.6% early last month, when Strategy saw gains of $32.47 billion. Following Saylor’s latest disclosure, gold advocate Peter Schiff voiced his usual criticisms, arguing that Strategy’s average price of $74,433 and Bitcoin’s market price are slowly converging.

Franklin Templeton’s XRP ETF Could Hit $150–$250M Day-One Volume, Analyst Says

0

The XRP community is gearing up for another historic moment as legacy asset manager Franklin Templeton prepares to launch its spot XRP ETF, EZRP.

According to XRP market commentator Chad Steingraber, EZRP’s debut could significantly outperform last week’s breakout launch of Canary Capital’s XRPC ETF.

Notably, Canary’s product delivered one of the strongest ETF debuts of 2025, recording $58.5 million in trading volume and $245 million in net inflows on its first day of trading.

But analysts now expect Franklin Templeton’s EZRP to go even further. Steingraber projects the XRP ETF could reach $150–$250 million in first-day trading volume. This could mean more than 2x to 5x Canary’s performance.

Why Franklin’s XRP ETF Could Dominate

The firm manages over 5,000 times more assets than Canary Funds. Franklin controls about $1.53 trillion in assets, while Canary manages under $500 million. Because of its size, Franklin has access to major channels such as:

  • wealth management platforms
  • pension funds
  • bank advisory networks
  • institutional investors
  • brokerage firms

This matters because most traditional investors, financial advisors, retirement planners, and institutional managers prefer regulated ETFs over crypto exchanges or self-custody. Franklin’s XRP ETF will reach that audience. If early demand meets expectations, EZRP could mark the start of large-scale institutional adoption of XRP.

Notably, as The Crypto Basic reported earlier today, Franklin’s XRP ETF will go live automatically on November 24, barely a week from now.

Flat Price Action Despite ETF Demand

The expected surge into EZRP comes at an interesting time. XRP’s price has failed to react positively to the record-breaking debut of the XRPC ETF. Its price has fallen from $2.52 to around $2.15, even as institutional inflows poured in.

As XRPL Foundation Director Fabio Marzella previously explained, this muted price response comes down to ETF structure:

  • ETF trades occur on stock markets, not crypto exchanges
  • Issuers only receive funds on the next business day (T+1)
  • Actual XRP purchases often happen over-the-counter, not on public exchanges

This means ETF-driven accumulation may not appear on price charts immediately. Behind the scenes, however, demand is building and EZRP’s launch could accelerate that trend.

How Large Could XRP ETF Flows Become?

With Franklin Templeton now entering the race, XRP is on track to receive one of the broadest institutional ETF rollouts in the crypto market. Five additional XRP ETF products are lined up from major issuers, including Bitwise, Grayscale, 21Shares, CoinShares, and Valkyrie.

Previous analyses show that if all seven XRP ETFs attract $600 million per month, the market could see $7.2 billion in annual inflows. Analysts suggest these inflows could inject $720 billion into XRP’s market cap based on the multiplier effect, potentially pushing XRP’s price into the $14 range.

While promising, this remains speculative.

XRP Supply in Profit Drops to Levels Last Seen When Price Was $0.53

0

The XRP supply in profit has collapsed to levels last seen when the XRP price traded around the $0.5 zone.

Glassnode, a leading market intelligence platform, highlighted this bearish turn of events on the back of the ongoing market downturn. Specifically, XRP has collapsed with the rest of the crypto market, down 13.88% in November, and on track to record its highest monthly decline since February 2025.

XRP Supply in Profit Dips

With XRP currently trading for $2.16 amid the persistent declines, Glassnode recently called attention to the impact of this downtrend on investor holdings. Specifically, the market intelligence firm revealed that of 63.86 billion tokens in circulation, the XRP circulating supply in profit has dropped to about 58.5%. This translates to 37.36 billion tokens.

According to Glassnode, today, the latest figure indicates that up to 41.5% of the XRP supply, amounting to 28.5 billion XRP, remains in loss. Notably, while this shows that there are still more investors in profit, the recent supply figures represent a massive decline from previous values when XRP changed hands at similar levels.

XRP Percent Supply in Profit Glassnode
XRP Percent Supply in Profit | Glassnode

For instance, when XRP surged beyond the $0.5 range in November 2024, hitting the $2 mark by early December 2024, the profit in supply was much higher.

Specifically, at the $2 price last December, the percentage supply in profit for XRP surged above 95%, signifying that nearly all investors saw gains on their holdings. Notably, most of the investors bought when prices traded between $0.5 and $0.6 for years before the November 2024 rally.

However, with XRP currently trading at $2.15, about 7.5% higher, the supply in profit now stands at just 58.5%. Glassnode confirmed that the last time XRP saw this level of supply in profit, the XRP price changed hands around the $0.5 level.

Reason Behind the Divergence

Notably, this divergence is due to the influx of new investors, who jumped on the XRP rally that began after the November 2024 breakout. Specifically, with XRP breaking above the $2 price, investors who had neglected the token for years eventually entered the market at higher prices, expecting further price appreciation.

When XRP traded between the $2.7 and $3.6 price region from mid-July to early-October, the percent of supply in profit stood at a range of 85% to 100%. However, with prices now tumbling to the lower end of the $2 mark, the supply in profit has collapsed to the current 58.5% range.

According to Glassnode, the current state represents a fragile market dominated by late buyers. The firm’s latest disclosure comes at a time when investors have begun ramping up their profit-taking trades. Specifically, Glassnode revealed that profit-taking volume had risen from $65 million a day to $220 million a day since late September.

MoonPay Says $2,025 in XRP Up for Grabs If This Happens

0

Crypto payment giant MoonPay has sparked excitement across the XRP community after announcing a daring giveaway tied to XRP’s price breakout.

The company tweeted that if XRP hits a new all-time high (ATH) by December 31, 2025, it will reward one follower with $2,025 worth of XRP.

The post went viral, stirring discussion about whether 2025 could still mark the year XRP breaks the 2018 ATH of $3.84.

XRP is currently trading at $2.15, down 4.5% over the past 24 hours and 11% for the week. The asset peaked at $3.66 in July 2025 before retracing, entering a consolidation phase that has frustrated many holders but energized long-term forecasts.

Community Reacts to MoonPay’s “New ATH” Challenge

Many commenters view the giveaway as a fun marketing tactic and a reminder of the community’s conviction. X user Kaivon said the “XRP gang would be eating good” if it happens. He noted that hitting a new all-time high by December 2025 would be remarkable, coupled with one lucky follower winning $2k worth of XRP for free.

Another member, Star Spangled Seabee, said they hope XRP really hits a new peak this year. Others joked, like one user who asked to “push to Q1 2026,” suggesting they’re confident XRP will eventually hit a new ATH—just maybe not before the 2025 deadline.

Why Many Believe XRP Could Hit a New ATH in 2025

While XRP’s price remains far below its cycle peak, many analysts argue that its fundamentals have never been stronger.

The Ripple-SEC case, a major source of uncertainty for years, officially ended in August. This removed a major regulatory cloud and opened the path for institutional participation.

Additionally, Ripple has announced over $2.5 billion in acquisitions this year, including cross-border payment integrations and prime brokerage services. These deals continue to position XRP as key infrastructure for real-time value movement.

Meanwhile, XRP spot ETFs are now entering the market following increasing regulatory clarity. Analysts expect ETF inflows to boost liquidity and attract new classes of institutional investors.

Bullish Cycle Predictions for XRP

While XRP’s price remains below expectations in 2025, some analysts insist XRP can crack a new peak before the year ends.

For instance, XForceGlobal still expects $15–$30 before the cycle ends. EGRAG sees historical compression patterns pointing to $6–$10 and possibly $37.

Zach Rector argues that telling holders XRP cannot reach $100 this year feels like “telling kids Santa isn’t real.”

Collectively, these developments have created a narrative that 2025 may still be when XRP finally clears the long-standing $3.84 barrier.

Ultimately, if XRP does clear its ATH by December 31, 2025, one MoonPay follower will be $2,025 richer, and the XRP community will have one more reason to celebrate.