Home Blog Page 428

Top Chartist Forecasts a Big Cardano Move as Multi-Month Support Breaks

0

Cardano could be gearing up for a massive price move, as recent analytical exposition highlights a multi-month support breach.

Cardano (ADA) has joined the broader market correction, fueled by heightened whale selloffs and macroeconomic uncertainties. Despite a decent 2.26% bounce today to trade at $0.492, ADA has corrected 15.8% and 21.6% over the past week and month, respectively.

Major Cardano Move Incoming

Meanwhile, prominent market chartist Ali Martinez has spotlighted a crucial development on the 4-hour chart, one that could lead to a significant price shift. He noted that ADA has just broken below a key demand zone that has buffered bearish momentum since 2024.

For perspective, bulls have defended the support around $0.512 since ADA reclaimed and retested the zone in early November 2024. Efforts to break below with lows of $0.512 in February, April, and June have all sparked a significant rebound from the area to higher prices.

Cardano Breaks Below Crucial Support

Nonetheless, recent bearish actions saw the support fold. Cardano dropped to a low of $0.491 on November 14, and although it reacted slightly the next day, the predominant price weakness led to a further drop to a low of $0.474 on Sunday.

On this note, Martinez predicted that a “big move” is coming next for Cardano. Such support breaches usually catalyze further downside, suggesting that ADA could see new lows if bearish momentum persists. However, the coin could rally like it did from the $0.512 support if it reclaims and holds the critical area.

Whale Sell-Off Adds to Bearish Pressure

Meanwhile, ADA whales have been busy lately, and they are not buying the dip. A parallel tweet from Martinez shows that they have sold 440 million ADA in one month, adding fuel to the bearish flames.

The sell-off specifically occurred among addresses holding between 100 million and 1 billion ADA tokens. These prominent holders have consistently dumped their holdings since early October, chopping their stash down to 3.83 billion tokens.

Cardano Whales Sell 440M ADA

However, investors remain optimistic about a bullish development for Cardano. A reaction suggested that these sales were a wrong move, as they may end up buying back at higher prices. Another user shared a similar opinion, tapping the imminent Cardano ETFs to spur a comeback.

Analysts are also sharing the same view. A TradingView analysis from AltcoinPioneers has predicted a 25% rebound to retest crucial resistance levels. This builds on his earlier commentary, in which he insisted that a bullish reversal is on course for the 10th-largest cryptocurrency by market cap.

Arthur Hayes Massively Dumping Ethereum and Altcoins Amid Bear Market Fears

0

Arthur Hayes, co-founder of BitMEX, has unloaded a large batch of Ethereum and several altcoins as the market turned lower, according to on-chain data.

According to blockchain intelligence platform Arkham Intelligence, Hayes sold 780 ETH in three separate transactions on Sunday. In total, the value of these sales was about $2.48 million.

As of today, Hayes has moved another 700 ETH, worth approximately $2.22 million, to B2C2 Group. Meanwhile, the BitMex founder is also massively disposing of several major altcoin positions.

Specifically, according to Arkham, he sold 5.02 million ENA, 640,000 LDO, 1,630 AAVE, 28,670 UNI, and 132,730 ETHFI. Collectively, these trades exceeded $2.4 million in value.

However, Hayes has not commented publicly on these moves, and the reason for the selling remains unclear.

Image

Dormant Ethereum ICO Wallet Springs Back to Life

Meanwhile, a separate alert from Lookonchain revealed rare activity from a long-dormant Ethereum ICO wallet. The address, tagged 0x9a67, executed its first transfer in over ten years by sending 200 ETH worth about $626,000.

On-chain records show that this participant purchased 1,000 ETH for $310 during the ICO. That initial allocation is now valued at around $3.13 million, representing a massive 10,097x return.

Price Pressure Mounts as ETH Extends Decline

Notably, the selling activity comes while Ethereum falls below the $3,200 mark. At press time, ETH hovered near $3,195, down 0.33% on the day and 11.56% for the week.

Both Bitcoin and Ethereum have cooled since setting new highs in 2025. ETH attained a peak value of $4,946 in August, whereas Bitcoin recorded $126,080 in October. Bitcoin has since fallen by 25%, while Ethereum has slipped more than 35%.

Tom Lee Sees Early Signs of an “ETH Supercycle”

Despite the downturn, Tom Lee, executive chair of BitMine, offered a bullish long-term perspective.

In an X (formerly Twitter) post, he said the current Ethereum setup resembles Bitcoin’s conditions in 2017, a period that preceded one of crypto’s strongest rallies.

Lee further noted that his firm first recommended Bitcoin when it traded near $1,000. He emphasized that BTC faced several 75% drawdowns, yet still climbed more than 100 times from that call.

Consequently, he believes Ethereum may now be entering a similar “supercycle.”

According to Lee, the market’s weakness reflects uncertainty, rather than fundamental decay.

This 5-Year Dormant User Just Lost $6.05 Million on a Single Cardano Trade: Details

0

A transaction involving a Cardano whale that lost 90% of his ADA worth in a single transaction has taught crypto users a valuable lesson.

The whale awoke after over five years of dormancy to make a transaction he now regrets, on-chain investigator ZachXBT first reported. The user, with wallet address “addr1qy,” changed 14.4 million Cardano tokens on Sunday and got just 10% of the asset’s worth at the current market price.

The transaction, which is his first since September 2020, saw him swap the ADA tokens, worth $6.9 million at the time, for a mere 847,696 US dollar Anzens (USDA). Notably, this culminates in a loss of approximately $6.05 million.

Cardano User Swaps 14.4M ADA for 847,696 USDA

Low Liquidity Pool Choice Hunts Cardano Whale

Notably, this substantial loss followed his poor choice of liquidity pool. Specifically, the trader made the transaction in an illiquid pool and also for a lesser-known stablecoin. The large order spiked the price of USDA, resulting in a high exchange rate.

Specifically, data shows that the USDA stablecoin spiked to near $70 today before settling at $1.04, with the trade potentially contributing to this surge. The move highlights the need to swap tokens, especially large orders, on a liquid pool, as this would have averted the $6.05 million loss.

Notably, the event resulted in him missing out on a massive gain by holding his Cardano tokens for five years. At the time of his last transaction, ADA traded at $0.095. This reflects a staggering 422% growth over the period of his HODL.

Chances of a Fat Finger

While some may argue that the move was intentional, the chance of a fat finger remains. Notably, the address carried out a test transaction, converting 4,437 ADA to the USD stablecoin a few seconds before the disastrous swap for USDA, which has a market cap of $10.39 million.

As a result, the unpopular change in the stablecoin for the test transaction and the actual swap has raised the opinion that it could be a clumsy mistake on the part of the trader. For the uninitiated, a fat finger transaction refers to an error in typing or a misclick, which can have disastrous impacts on blockchain transfers.

A couple of them have been recorded in the on-chain transaction history. For context, a user paid $700,402 as Ethereum transaction fees to move nothing, and stablecoin issuer Paxos mistakenly minted $300 trillion PYUSD tokens.

Wall Street Trader Says Bitcoin Cycle Top Confirmed at $126,000: Here’s How Low BTC Could Fall by Q4 2026

0

Mr. Wall Street, a widely followed Bitcoin trader, has argued that BTC may have reached its cycle peak at $126,000, outlining potential dip prices by the fourth quarter of 2026.

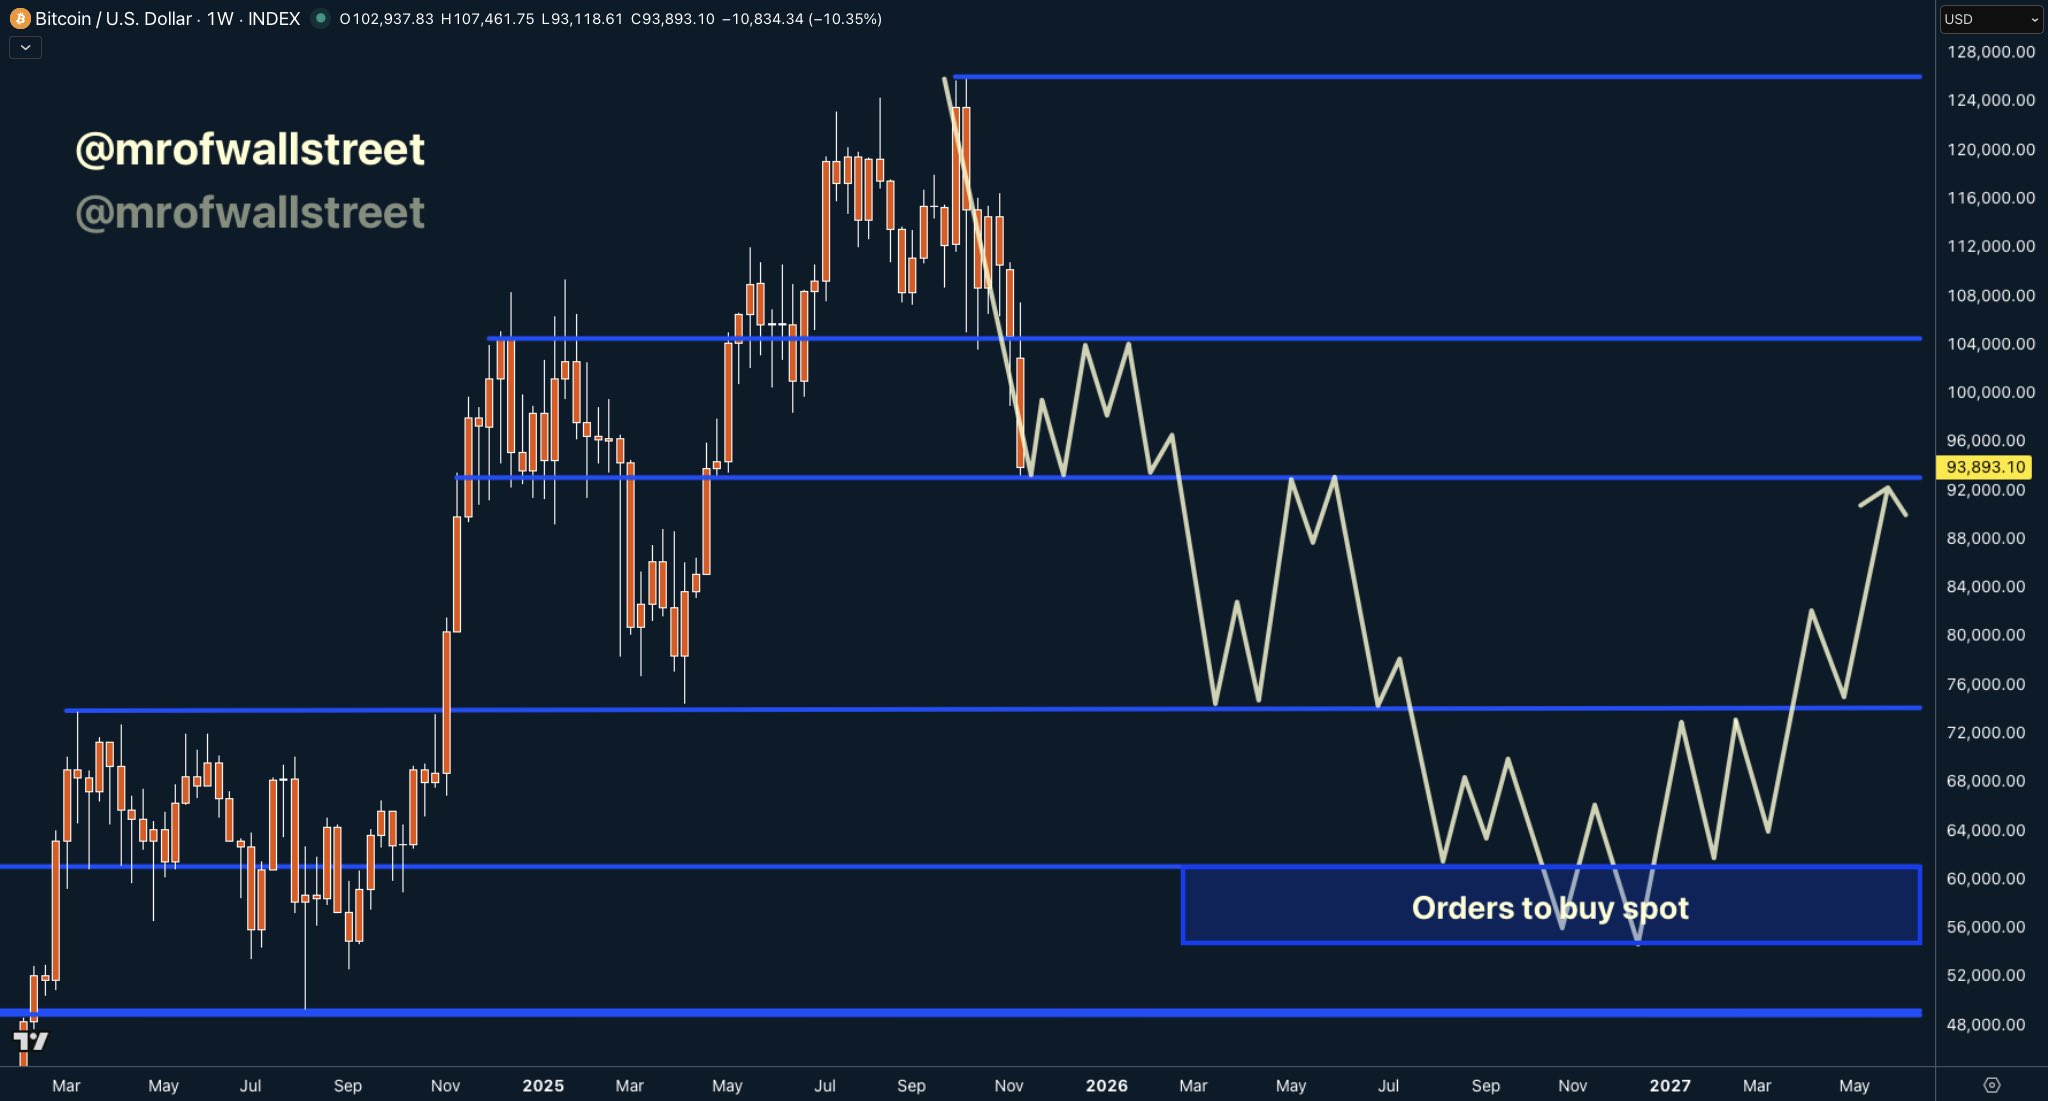
In a post on X, Mr. Wall Street noted that with BTC trading at $94,885, following a 10.6% drop over the past week, the next significant support range lies between $74,000 and $82,000.

The analyst emphasized that the longer-term structure suggests a corrective phase that could extend down to $54,000, following the completion of the bullish cycle.

Bitcoin Cycle: Consolidation, Breakout, and Next Targets

The weekly Bitcoin chart shared by Mr. Wall Street shows that Bitcoin climbed steadily throughout 2024 and into 2025, ultimately reaching its cycle peak in October.

During this cycle, Bitcoin first hit a peak of $73,750 in March 2024, then consolidated for six months before breaking out to $100,000 by the end of 2024. The momentum carried into early 2025, with Bitcoin reaching around $110,000 around President Trump’s inauguration.

After a brief consolidation, another breakout occurred in July, which later saw Bitcoin hit its peak at $126,000 in October. Since then, the market has turned bearish.

Following the cycle top, the chart shows a reversal pattern forming, with Bitcoin dropping below the $104,000 support region.

Bitcoin has now entered a descending structure of lower highs and lower lows, signaling a possible multi-year corrective phase.

Image

With Bitcoin now 24.1% below the cycle top, Mr. Wall Street projects the next major support to be between $74,000 and $82,000, followed by a broader accumulation block between $54,000 and $60,000, which is identified as the final target for Q4 2026.

Is Bitcoin Rally Over?

Despite the bearish outlook, some analysts remain cautiously optimistic. CryptoQuant CEO Ki Young Ju says Bitcoin isn’t in a bear market as long as it stays above $94,635, the average cost basis of 6–12 month holders.

Analyst Rekt Capital noted that for Bitcoin to overcome the bearish signals, it needs to reclaim and close the week above the 50-week EMA, a level essential for preserving its long-term bullish structure. However, this has not held.

The analyst also acknowledged that BTC has been sliding for six weeks after its rejection above $126,000, with the recent dip triggering over $1.3 billion in liquidation.

Amid the market’s volatility, Michael Saylor urged investors to hold steady and not panic, suggesting better days are ahead.

XRPL Foundation Board Director Explains Why XRP Price Is Down Despite ETF Launch

0

The XRP community continues to discuss why XRP’s price failed to rally following the launch of the highly anticipated Canary Capital XRP ETF (XRPC).

While the fund posted one of the strongest ETF debuts of 2025, pulling in $245 million on day one, XRP’s price continued drifting lower.

Now, Fabio Marzella, Founding and Board Director of the XRPL Foundation, has stepped in to explain what’s really happening beneath the surface.

“ETF Trading Happens on the Stock Market, Not Crypto Exchanges”

In a post on X, Marzella noted that many people expected the price to shoot up as soon as XRPC began trading. But the structure of ETF settlement explains why that didn’t happen.

According to him, ETF trades occur on the stock market, not on crypto exchanges, where spot XRP is bought and sold.

Due to the T+1 settlement system, when someone buys an XRP ETF share, the issuer does not receive the cash immediately. The money settles the next business day, and only then can the provider begin purchasing the actual XRP needed to back the fund.

This delay means early inflows don’t immediately translate into spot market demand. Essentially, Marzella stressed that an ETF does not pump the price on day one. The real impact comes later, sometimes quietly at first, then all at once.

Strong ETF Debut, Weak Price Reaction

After XRPC’s debut, the ETF recorded $26 million in trading volume in its first 30 minutes and $58.5 million by market close. Additionally, it logged $245 million in net inflows on the first day.

These numbers made XRPC the top ETF debut of the year, surpassing even the Bitwise Solana ETF. It also placed the XRP fund among the best-performing ETF launches out of more than 900 issued in 2025.

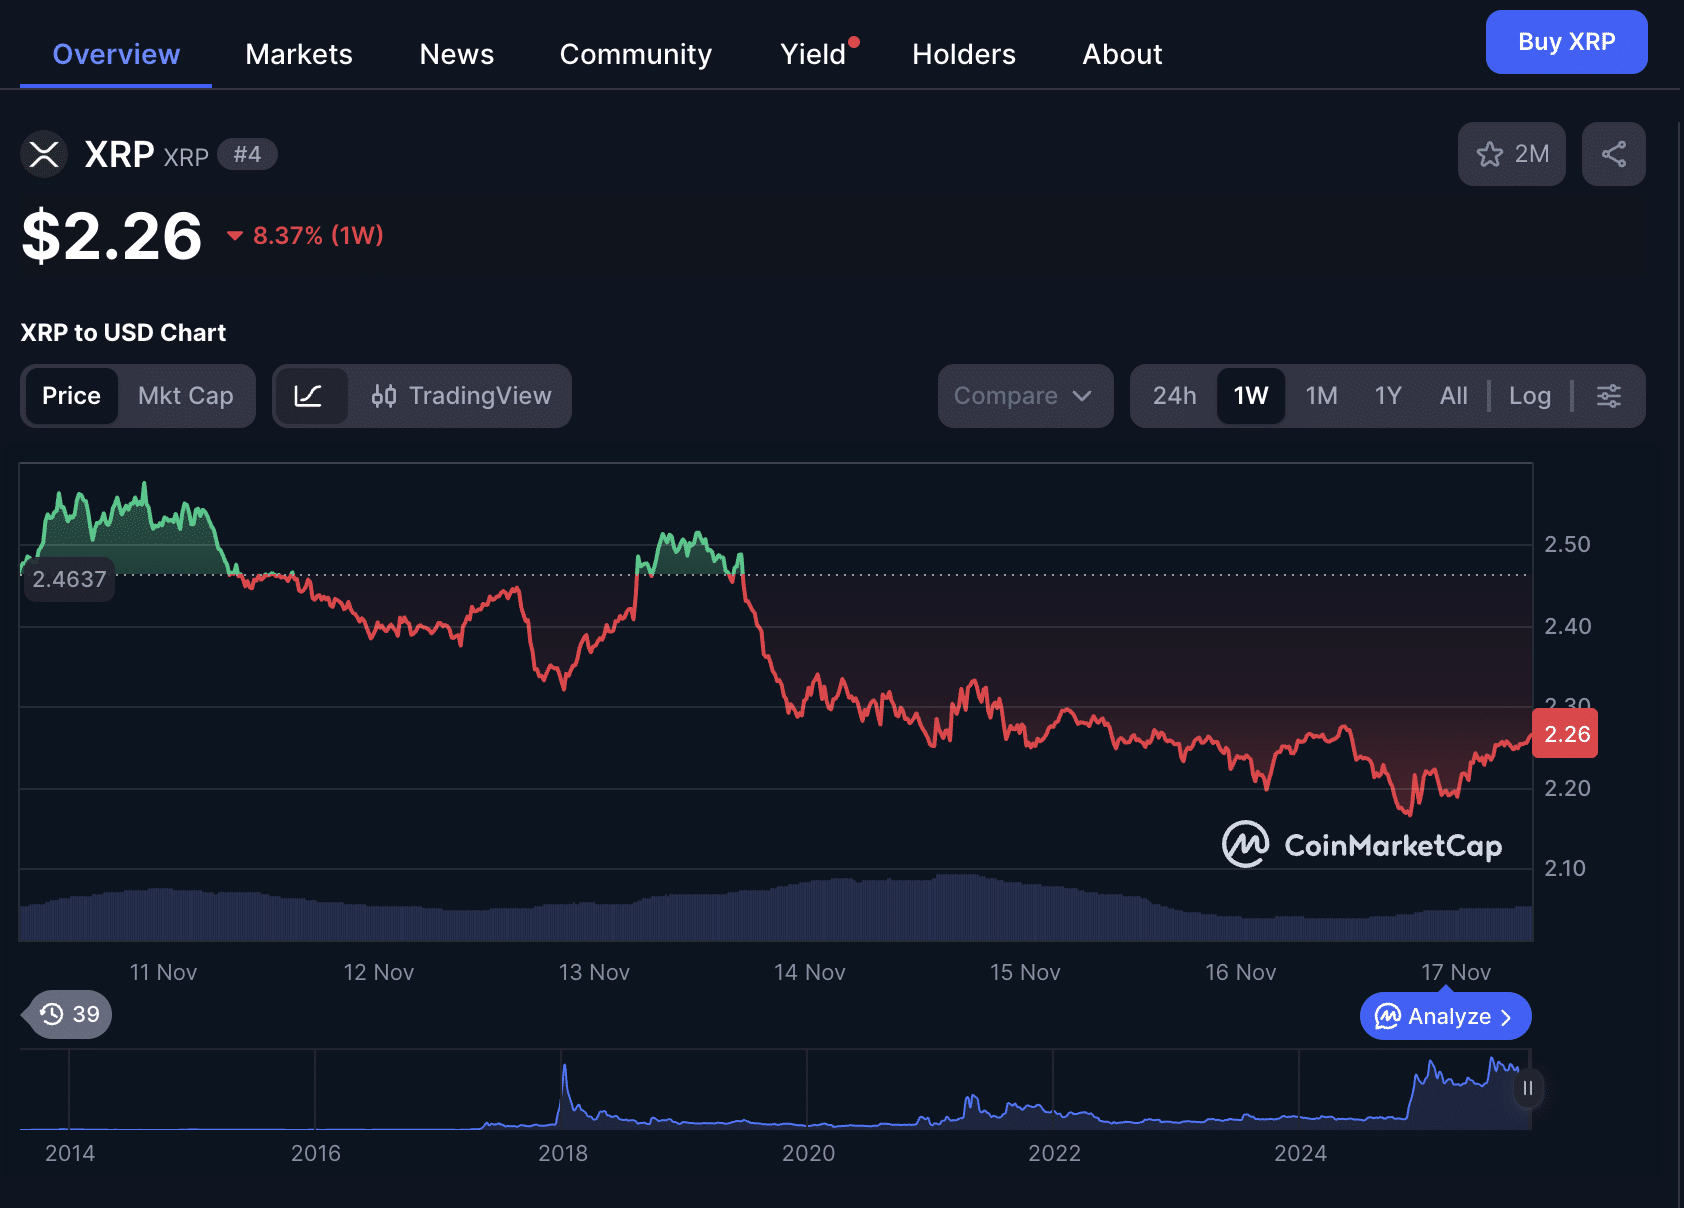
Yet despite this momentum, XRP fell from $2.52 to around $2.28. Since the ETF launch, XRP’s price has dropped to $2.16 before slightly recovering to $2.25 at press time. At this price, the coin is down 8.63% over the past week.

Screenshot 2025 11 17 at 82403 am
XRP chart CoinMarketCap

Bearish Market Dampened the Effect

Marzella also highlighted a second factor behind XRP’s decline: the entire crypto market is bearish.

Bitcoin lost the $100,000 support last Friday and has since fallen to $92,900. This bearish Bitcoin performance dragged the rest of the market down with it. In other words, as major altcoins corrected, XRP followed the trend.

Nick from The Web Alert pointed out that inflows worth tens or even hundreds of millions are still too small to overpower market selling pressure—especially considering XRP’s large supply. Any selling by major holders can offset upward pressure.

OTC Purchases May Hide the Real Buying Activity

Another reason the price impact hasn’t appeared yet is the way ETFs acquire their underlying assets. Even after settlement, issuers rarely buy directly from public exchanges. Large funds like Canary Capital often source assets from over-the-counter liquidity providers, meaning the purchases are not visible on spot price charts.

Marzella ended his explanation with a message of patience. ETF-driven price effects typically lag behind launch-day hype, as seen with Bitcoin’s own ETF debut in January 2024, which initially showed little price reaction before kicking off a major rally weeks later.

Bitcoin and Crypto Market Shed $1 Trillion Amid Leverage and Institutional Outflows

0

The global crypto market has lost more than $1 trillion in just six weeks, marking one of its sharpest downturns since October. 

According to analysts, the slide is not due to weak fundamentals, but heavy leverage and large institutional withdrawals.

The total market capitalization of cryptocurrencies now sits about 10% below levels recorded after the $19 billion liquidation event on October 10. This decline comes despite the absence of major negative news or regulatory setbacks.

Political commentary has even trended positively. For instance, just days ago, U.S. President Donald Trump said he wants the United States to become “number one in crypto.”

Nevertheless, Bitcoin has still fallen 25% in the past month, showing a clear disconnect between sentiment and price performance.

Analysts Identify Structural Issues Behind the Selloff

A research note from The Kobeissi Letter attributes the decline to structural pressures, rather than weakening fundamentals. The downturn began in mid-October, when institutional investors pulled capital from major crypto funds.

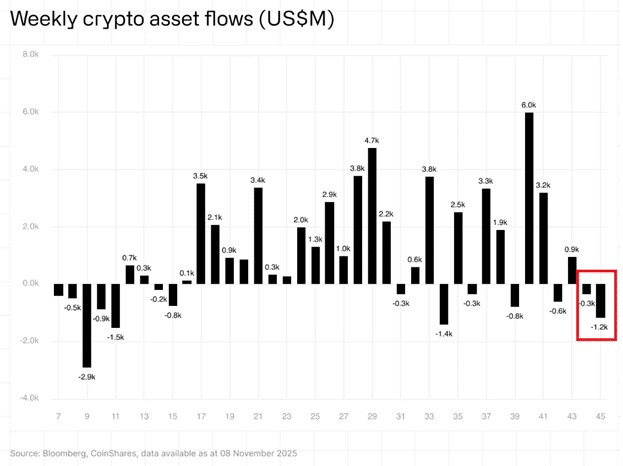
Data from CoinShares shows $1.2 billion in outflows during the first week of November alone. These outflows hit the market at a time when leverage was already extremely high.

Weekly Crypto Asset Outflows

Excessive Leverage Triggers Repeated Liquidations

Leverage remains a defining feature of the crypto market. Crypto traders often use leverage as high as 20x, 50x, or 100x. Consequently, even a 2% price move can force liquidations. This, in turn, creates chain reactions when large numbers of traders simultaneously unwind their positions.

Image

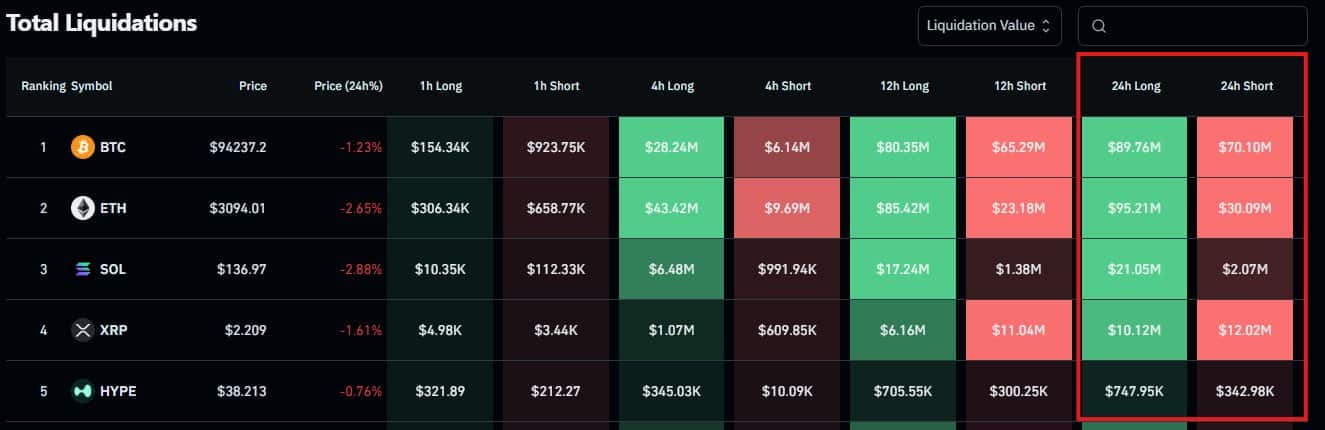
On October 10, forced selling reached $19.2 billion, which produced Bitcoin’s first $20,000 daily candlestick. Since then, volatility has remained elevated.

Moreover, the market has logged three separate liquidation days above $1 billion in the last 16 days. In fact, daily liquidations over $500 million are now routine, particularly when trading volume is low.

Daily liquidations in Crypto Market
Daily liquidations in the Crypto Market

Sentiment Deteriorates as Fear Takes Hold

The Crypto Fear & Greed Index has dropped to 10, a level labeled “Extreme Fear.” This matches the low recorded in February 2025, even though Bitcoin remains up 25% from the trough in April.

Analysts say leverage is amplifying emotional swings among traders, therefore making sentiment unstable and prone to sudden reversals.

Bitcoin and Gold Break from Their Usual Pattern

Furthermore, the Kobeissi Letter notes a major shift in correlations between Bitcoin and Gold. Since the October 10 liquidation wave, Gold has outpaced Bitcoin by 25 percentage points in a single month. This, in turn, marks a clear break from earlier trends, when both assets moved higher together amid strong inflows.

The pain extends beyond Bitcoin. Ethereum has fallen 8.5% this year and dropped 35% since October 6. Analysts describe this as a severe downturn, especially since other risk assets have rallied in the same period.

Analysts See a Reset Rather Than a Fundamental Breakdown

Despite the sharp decline, The Kobeissi Letter argues that fundamentals in the cryptocurrency have improved. The firm believes the market is undergoing a structural reset, driven mainly by leveraged positions being forced out.

Accordingly, analysts say leverage and liquidations, rather than fundamentals, explain the current instability. They expect conditions to stabilize once excess risk is flushed from the system. In their view, the market may be nearing a bottom.

Shiba Inu Eyes Signal Never Seen Before on the Weekly Chart

0

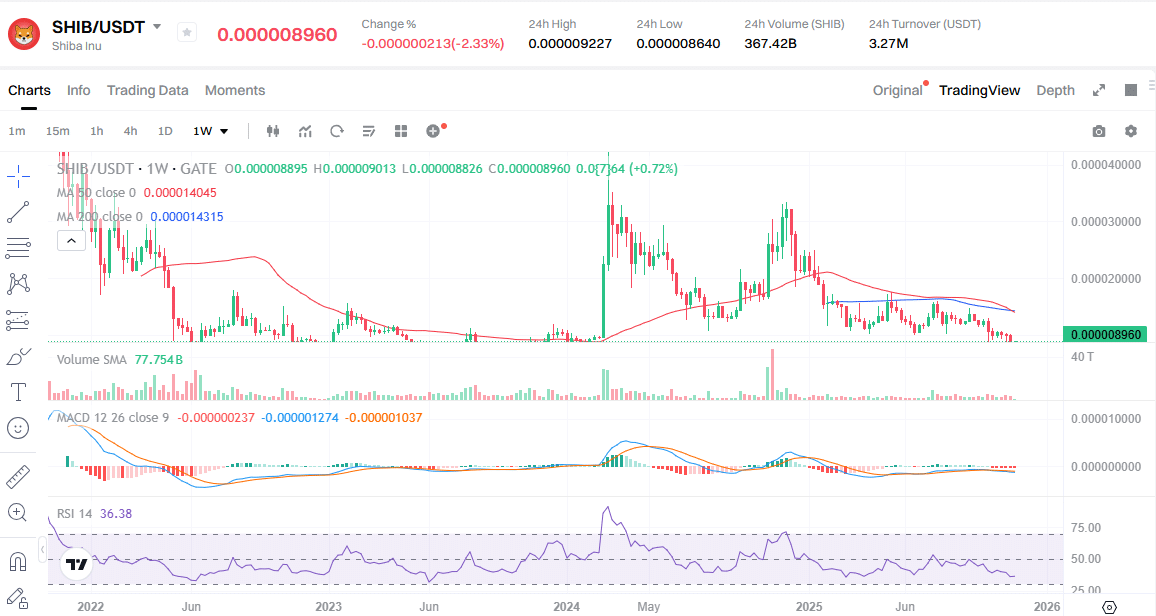
The price of Shiba Inu is approaching a critical zone as it records its first-ever 50-week and 200-week moving averages crossing.

Since making its market debut in 2021, Shiba Inu has never had a golden or death cross on the weekly chart. That has changed, as recent price action has now taken the MA 200 above the MA 50.

Major Signal for Shiba Inu?

For the uninitiated, a death cross in this case occurs when the 50-week moving average crosses below the 200-week moving average. Meanwhile, a golden cross would see the 50-week MA move above the 200-week MA.

As the name suggests, a death cross signals short-term bearishness, indicating that the underlying asset may decline further. However, a golden cross suggests that a bullish price development is on the horizon.

Currently, the 50-week MA trades below the 200-week MA, with bearish price actions indicating a death cross has occurred. However, this was the only possible direction at this point, seeing as the 50-week MA was already above the 200-week MA. At the time of writing, the former is at $0.000014045 and the latter at $0.000014315.

Shiba Inu MA Analysis

While a death cross typically signals bearish price trends, some analysts argue that it is a reflection of past price actions. Shiba Inu has declined 10.37% since the start of November and 27.8% since August, but the cross is just happening now. 

Hence, they argue that the indicator lags prices and may ultimately prove non-detrimental to Shiba Inu. Remarkably, this remains unproven and thus speculative. Moreover, if market conditions improve and SHIB’s short-term price action recovers, the 50-week MA could push above the 200-week MA, leading to the golden cross.

Severe Price Weakness as SHIB Approaches Major Support

Meanwhile, Shiba Inu has turned red in literally all notable timeframes. The meme coin has corrected by 2.1% over the past 24 hours, 11% in the past seven days, and 8.68% in the past month, trading at $0.00000896. These bearish developments further add pressure on holders, who have endured a 57% loss in their portfolio since the start of this year.

Analysts point to SHIB’s hold of the $0.000008-$0.00009 support as a good sign. Specifically, James Waynn predicted that this could spark a rebound, aligning with his ambitious $0.10 projection.

If bearish momentum persists and bears push Shiba Inu below this support, analyst MMB Trader identified the $0.0000060 demand zone as a major stronghold for bulls. He expressed confidence that the area would provide the required momentum to push the token to $0.0000773.

Shiba Inu Says Something New Is Coming For ShibArmy

0

Shiba Inu ecosystem team has ignited fresh excitement within the community after teasing an upcoming integration. 

The weekend brought another wave of market pressure, with Shiba Inu and several top crypto assets experiencing sharp declines. SHIB notably slipped below the $0.000009 threshold, touching lows around $0.0000086.

Something New Is Coming — Shiba Inu Team

Amid growing investor frustration over the downturn, the Shiba Inu team delivered a timely morale boost by hinting at a major upcoming reveal. The message read, “Something new is coming for the ShibArmy,” igniting speculation and excitement within the community. 

It highlighted three key clues relating to the upcoming initiative: “wallet-friendly, unmistakably SHIB, and useful.”

The teaser featured an eye emoji and a credit-card emoji, and it also tagged the official X account of Bitget Wallet.

In parallel, the tweet encouraged community members to make clever guesses about the upcoming initiative, assuring them that full details about the integration would be revealed soon.

Bitget Wallet Reacts 

Indeed, the announcement stirred fresh excitement among Shiba Inu community members, who were eagerly anticipating the details of the upcoming initiative. In the meantime, Bitget also confirmed its involvement in the initiative by commenting, “Very SHIB indeed.” 

The Bitget Wallet X account also quoted the Shiba Inu teaser and playfully asked users to provide wrong guesses only.

Its remark serves as a lighthearted challenge to the community, encouraging members to continue speculating about the upcoming announcement.

What to Expect 

Based on the clues, particularly the credit card emoji and the Bitget Wallet tag, some believed the upcoming initiative is related to payments, wallet integration, or a SHIB-branded credit or debit card. 

Notably, Bitget has already integrated Shiba Inu’s Layer 2 blockchain, Shibarium, into its wallet, enabling users to store, send, receive, stake, and swap SHIB.

Since SHIB is already integrated into the wallet, the team may look to enhance this functionality further, possibly by streamlining the process of trading, managing, or cashing out SHIB within the wallet.

Meanwhile, Shiba Inu promised to share more details about what the integration is about “super soon.” 

Here Is the Price of 1 XRP if XRP Powers 25% of All Remittances Globally

0

How high could the XRP price surge if XRP powered 25% of all remittances globally instead of capturing the broader payments market?

With XRP currently changing hands around $2.25, it has witnessed a remarkable 38,148% increase since its earliest trading days, according to CMC data. However, multiple long-time proponents insist that the altcoin trades far below what its real utility suggests. 

XRP’s Role in Payments

Specifically, they argue that XRP could climb sharply once it gains a meaningful share of global payments. Last December, crypto researcher SMQKE suggested that XRP stands ready to act as the leading liquidity asset for international fund transfers. He called attention to the enormous payments market that moves trillions annually.

Meanwhile, research groups have made equally bold projections. According to SMQKE, analysts from McKinsey and Delphi Digital expect Ripple to secure as much as 80% of worldwide cross-border payment flows within the next ten years. 

In October 2025, market commentator XFinanceBull added that XRP and XLM do not compete. He said they operate like a joint force built to improve a $150 trillion payments industry. 

To him, XLM handles the consumer side, including low-cost personal transfers, remittances, digital wallets, and financial access for underserved regions, while XRP manages institutional duties through treasury operations, cross-border banking, and enterprise finance. 

Also, former Ripple Managing Director Navin Gupta expressed the same ambition earlier when he said Ripple intends to play a major role in global finance. He highlighted that cross-border remittances represent a $155 trillion challenge and stated that Ripple plans to take it on directly.

What if XRP Powered Remittances Alone?

Amid these bullish sentiments, we recently examined how XRP’s price could react if it captured only the remittance market rather than the full cross-border payments sector. For context, remittances represent personal transfers sent by migrant workers to their families. 

Specifically, they remain a smaller component of global flows, totaling nearly $900 billion a year, according to 2024 estimates, while overall cross-border payments rise to roughly $190 trillion. 

In 2024, remittances to low- and middle-income countries reached $685 billion, rising 5.8% from $656 billion in 2023. However, when including high-income economies, total remittances hit $905 billion, marking a global growth rate of 4.6%, up from $865 billion a year earlier. 

XRP Price if It Captures 25% of Global Remittances

Considering these figures, we assessed how XRP might perform if it powered 25% of global remittance flows. Nonetheless, exactly how this could impact the XRP price remains uncertain. As a result, we turned to Google Gemini. 

Notably, Gemini first calculated the share of the $905 billion global remittance market and arrived at $226.25 billion a year. It then used a utility-based liquidity model and noted that a payment asset does not need a market value equal to the total yearly volume it processes. 

XRP Price Prediction Google Gemini
XRP Price Prediction | Google Gemini

For its first estimate, it applied a 10% liquidity requirement, which produced a market cap of $22.625 billion. Gemini then leveraged a 50x multiplier on the captured volume, which resulted in a projected capitalization of about $11.31 trillion.

With the XRP circulating supply currently sitting at 60 billion tokens, Gemini calculated a possible price of roughly $188.50 per token.

Notably, at the $11.31 trillion market cap, XRP will have overtaken all the top banks in the U.S. and across the globe in terms of valuation, sitting pretty as the second-largest asset in the world, only behind gold. Specifically, XRP will have surpassed JPMorgan Chase ($842 billion), Agricultural Bank of China ($401.35 billion), Bank of America ($386 billion), and ICBC ($380 billion). However, this remains highly speculative.

Can XRP Reach $100? Here’s What the Math Says

0

XRP remains under $3 but long-running debates continue to weigh in on whether XRP can ever reach $100.

Some argue the math supports it. Others say it’s economically impossible. This article presents a breakdown of what the numbers actually say, and what would realistically need to happen for XRP to hit the triple-digit mark.

The Market-Cap Reality Check

Before considering any price target, XRP’s supply must be taken into account. With a maximum supply of 100 billion tokens, even a moderate price increase quickly translates into enormous market-cap requirements.

At today’s price of $2.30, XRP’s valuation is approximately $134 billion based on a circulating supply of 60 billion and over $230 billion on the full supply. For XRP to reach $100, the numbers take a dramatic jump.

A $100 price equals a $6 trillion market cap, a level that would put XRP among the largest assets in global financial history. For perspective:

  • Bitcoin sits in $2 trillion range.
  • NVIDIA and Apple hover around $4 trillion.
  • Gold commands roughly $28.2 trillion, making it the world’s most valuable asset.

For XRP to reach $100, it would need to claim a position between NVIDIA and gold. That’s an over 4,230% jump from its current valuation.

Mathematically possible? Yes.

Historically or economically likely? This is where analysts disagree.

The Skeptics: “The Math Doesn’t Add Up”

Critics argue that a $100 or $200 XRP price is not only improbable, but also “economically implausible.”

This view was highlighted in a recent debate sparked by analyst 24HRSCRYPTO, who compared returns from investing $1,000 in Bitcoin versus XRP. While he claimed XRP could deliver far superior gains if it hits $100–$200, skeptics pointed to the market-cap implications.

This conservative camp argues that price projections must consider market-cap mechanics. And under today’s global market scale, triple-digit XRP is far beyond what the system can reasonably support.

The Optimists: “Utility Will Take XRP to $100–$200”

Meanwhile, XRP supporters counter with a different framework altogether. They argue that traditional market-cap logic is outdated when applied to high-velocity liquidity assets like XRP.

Analyst 24HRSCRYPTO insists XRP is a bridge currency to support settlement flows across:

  • Foreign exchange (FX)
  • Tokenized treasuries
  • Stablecoins
  • Real-world asset markets

In their view, institutional liquidity demand, not speculative trading, would drive XRP’s valuation deep into triple-digit territory.

The idea is that if XRP becomes a backbone for global settlement, its price won’t reflect a “market cap” in the traditional sense, but the liquidity required to move multi-trillion-dollar markets efficiently.

This argument remains contentious, but it’s a core belief among those who see XRP as a foundational layer of future financial plumbing.

The FX-Based $125 Argument

Another angle gaining traction comes from financial advisor Whiplash, who suggested XRP could theoretically hit $125 if it were to support a significant portion of the $7.5 trillion in daily forex volume.

Using the circulating supply of 60 billion XRP, he divided the FX daily volume by that supply and arrived at the $125 figure. In parallel, he argued that the token’s value must be high enough to provide sufficient liquidity for these flows.

Meanwhile, even supporters acknowledge that such FX-dominance assumptions are extreme.

So, Can XRP Realistically Hit $100?

Based on the math, yes: it is theoretically possible. But practicality and probability are different questions.

XRP at $100 demands a valuation of $6–$10 trillion, depending on the assumptions about supply. Accordingly, it must outperform or rival the world’s largest assets.

Some projections place this kind of growth decades in the future, between 10 and 20 years. Others think it will never happen.

Ultimately, the reality is somewhere in the middle. XRP’s future depends on whether it becomes a key part of global liquidity or just stays a large crypto without enough scale for a triple-digit price.

In sum, the $100 XRP price is a mix of dream, theory, and long-term speculation.