Home Blog Page 427

Research Firm Identifies What’s Behind the Ongoing Bitcoin Downtrend

0

XWIN Research, a well-known crypto research group, has identified the factors behind the ongoing Bitcoin downtrend.

For context, Bitcoin (BTC) has spent the past few weeks in a sharp pullback. After climbing to $107,465 on Nov. 11, it faced strong resistance, eventually slipping below $100,000 two days later. 

At the current price of $94,700, Bitcoin is nearly 12% below its Nov. 11 high. For November, the crypto firstborn now sits more than 13% lower, which cuts its year-to-date gain to roughly 2.1%.

XWIN Research Blames STHs for the Downtrend

Amid the ongoing panic, XWIN Research highlighted some of the factors fueling this drop. The team explained that several CryptoQuant authors have discussed the downturn, questioning whether long-term holders (LTHs) or short-term holders (STHs) created most of the pressure.

In its review, XWIN Research stated that short-term holders played the biggest role in the steepest part of the decline. According to them, the Short-Term Holder Spent Output Profit Ratio dropped below 1 several times, which showed that short-term holders actively took losses. 

Bitcoin STH SOPR CryptoQuant
Bitcoin STH SOPR | CryptoQuant

They also pointed out that Spent Output Age Bands revealed that holders with coins younger than 3 months accounted for most of the spent volume during the downturn. The group noted that this pattern proves that short-term holders created the strongest and most immediate pressure on price.

Meanwhile, they then stressed that long-term holders also increased their selling, but this behavior fits normal bull-market activity. 

XWIN Research highlighted that Coin Days Destroyed, Realized Profit, and Long-Term Holder Net Position Change all showed higher distribution from long-term holders since September. However, they clarified that these trends do not resemble the heavy, late-cycle blow-off selling seen at previous tops.

Bitcoin STH’s Marginal Selling Fueled the Drop

The research firm also emphasized that marginal selling pressure came from short-term holders who unwound leverage during the drop. 

According to the report, markets always react more strongly to marginal selling during stressful periods. As a result, leveraged short-term holders triggered fast sell-offs and liquidations that pushed the market down more aggressively, even though long-term holders sold larger totals over several months.

Moving on, the group focused on the Realized Capitalization, confirming that it has continued to rise during the correction. They said this rise shows that new short-term holder inflows still entered the market. 

Bitcoin Realized Cap CryptoQuant
Bitcoin Realized Cap | CryptoQuant

However, these inflows did not fully offset the short-term holder capitulation and the steady long-term holder distribution. Essentially, Bitcoin long-term holders created background pressure, but short-term holder capitulation and deleveraging caused the sharp drop from the $126,000 area. 

Despite the persistent declines, XWIN Research suggested that the overall on-chain structure points to a normal bull-market correction rather than the end of a cycle.

CryptoQuant CEO Points to Bitcoin LTH Distribution

Meanwhile, CryptoQuant CEO Ki Young Ju insisted that the downtrend was a result of long-term holders passing coins among themselves, with older holders selling to traditional finance participants who plan to hold for long periods. 

He explained that he predicted a top earlier in the year because older whales sold heavily. However, he admitted that the structure changed as ETFs, Strategy, and other major buyers kept adding liquidity. 

According to him, on-chain inflows remain strong, and the decline is a result of older whales dragging the market down. Ju noted that sovereign funds, pension funds, multi-asset funds, and corporate treasuries now build even larger liquidity channels, which weakens the old cycle theory until those channels eventually slow.

Analysts Already Eyeing Recovery Attempt

However, Glassnode has begun highlighting positive signals. In a recent disclosure, the firm noted that distribution pressure has started to ease across major holder groups. They explained that several cohorts reduced their heavy selling after weeks of intense activity, which suggests the most aggressive supply may now fade.

Meanwhile, market veteran Michaël van de Poppe has kept his eyes open for a recovery attempt. He noted that he wants to see Bitcoin bounce quickly, confirming that the market swept the weekend low around $93,000 and now needs to form a higher low. 

He believes that a successful formation would expose trillions in short liquidity and trigger a strong upward move. According to him, BTC must hold $94,000 to attempt a push toward $100,000 this week. 

Bitcoin 4h Chart Michaen van de Poppe
Bitcoin 4h Chart Michaen | van de Poppe

Robert Kiyosaki Slams Warren Buffett’s Bitcoin Criticism, Calls ETFs and Wall Street Assets “Fake Money”

0

Financial commentator Robert Kiyosaki has fired back at Warren Buffett after the legendary investor dismissed Bitcoin as speculation rather than true investing. 

In a lengthy post, Kiyosaki argued that Buffett’s stance shows his trust in Wall Street and the U.S. financial system.

Kiyosaki on Buffett’s BTC Warning

Buffett has long criticized Bitcoin, most recently suggesting that a major blow-off top could wipe out investors. Kiyosaki acknowledged that Buffett is “arguably the smartest and richest investor in the world,” but said the critique ignores the risks in the traditional assets Buffett champions.

He pointed to repeated crashes in stocks, real estate, and even U.S. government bonds, stressing that major global holders like Japan and China have already been reducing their Treasury exposure.

From Kiyosaki’s perspective, Buffett’s view is shaped by a system that works in his favor. He believes Wall Street-manufactured financial products are far from safe and sees Bitcoin as protection from that system, regardless of its volatility.

Gold, Silver, Bitcoin: Kiyosaki’s “Real” Money

Kiyosaki, repeating a theme he’s promoted for years, divides wealth into three types:

  1. “God’s money” – physical gold and silver
  2. “People’s money” – Bitcoin, Ethereum, and other cryptocurrencies
  3. “Fake money” – government-issued currency and Wall Street products

He says he owns gold, silver, Bitcoin, and Ethereum because they can’t be printed or created by central banks.

Kiyosaki also criticized ETFs, REITs, and other “paper assets,” calling them Wall Street’s version of fake money. While many investors like ETFs for convenience, he says he would never hold paper versions of gold, silver, or Bitcoin when the real thing is available.

Mistrust of the U.S. Financial System

Kiyosaki links his investment approach to a deep distrust of major U.S. institutions. He says the Federal Reserve is not truly federal, has no real reserves, and can’t protect people’s purchasing power.

He also warns that the U.S. Treasury will issue massive new debt, which he believes will benefit wealthy investors holding Treasuries while hurting ordinary people through inflation and higher taxes.

For Kiyosaki, this is why he invests outside the traditional system, not because of formal training, but simple logic. He argues most people buy “fake assets” because schools don’t teach real financial education, a gap he tries to fill with his books and the Cashflow board game.

Bitcoin’s Fixed Supply Maks it Valuable

Kiyosaki concluded by highlighting Bitcoin’s key appeal: its limited supply. With only 21 million coins, he believes its value will rise as governments keep printing money to cover deficits. He sees the U.S. dollar’s decline as inevitable, making saving in cash “stupid,” just as he warned in Rich Dad Poor Dad over 20 years ago.

Bitcoin Reaches Major Milestone as 95% of Total Supply Is Now Mined

0

Bitcoin, the world’s largest cryptocurrency, has crossed a significant milestone in its monetary lifecycle, as 95% of its entire supply has been mined so far. 

Data from multiple sources, including Whale Insider, indicate that Bitcoin’s circulating supply has reached 19,949,776 BTC (approximately 19.94 million), accounting for 95% of its total capped supply. Of the BTC already mined, just 230.09 BTC are classified as unspendable. They refer to coins that can no longer be accessed or spent for various reasons. 

With roughly 19.95 million already mined, around 1,049,996 (1.049 million) BTCs are left to be issued before Bitcoin reaches its hard-coded maximum supply of 21 million. The milestone reinforces Bitcoin’s growing scarcity—a defining feature that many proponents, including Anthony Pompliano, have highlighted as a key advantage over inflation-prone fiat currencies. 

Projected Timeline for the Mining of the Last BTC 

Even though only about 1.05 million BTC remain to be mined before Bitcoin reaches its fixed 21 million supply, these coins will not enter the market quickly. Due to Bitcoin’s halving schedule, the rate of new BTC issuance slows every four years as block rewards decrease. 

This gradual reduction ensures that mining becomes increasingly difficult over time, reinforcing Bitcoin’s deflationary design. At the current pace, the final fraction of Bitcoin—the 21 millionth BTC—is projected to be mined around the year 2140, more than 100 years from now. 

BTC Dips Despite New Milestone 

As scarcity increases, speculation suggests that the price of Bitcoin could spike significantly if demand accelerates. However, several analysts, including Nansen’s research expert Jake Kennis, emphasized that the impact of the new milestone will not take effect immediately. 

In the meantime, Bitcoin’s performance has remained bearish over the past week. Despite hitting a milestone of 95% mined Bitcoin, the apex cryptocurrency still slumped below the $93,000 mark today before rebounding to $94,000. It is priced at $94,004 per coin, down 1.47% over the past day and 11.96% in the past month. 

Holdings by Categories 

Meanwhile, the 95% of mined Bitcoin is spread across a wide range of holders. Bitcoin’s creator, Satoshi Nakamoto, remains the largest known individual holder with an estimated holding of 1.09 million BTC, representing 5.46% of the circulating supply. Exchanges collectively hold about 2.14 million BTC, with Binance alone controlling approximately 570,729 BTC, according to data from CoinGlass.

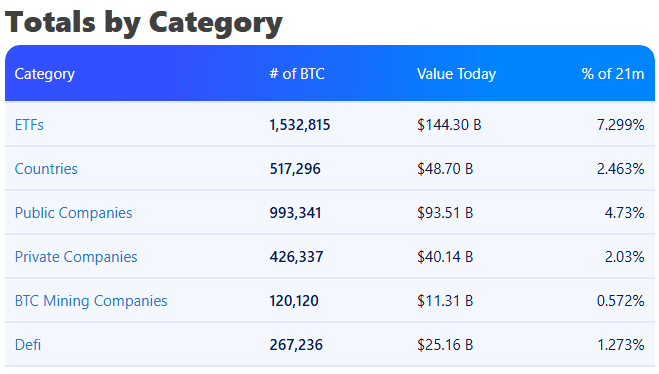
Further, global Bitcoin ETF issuers now manage roughly 1.54 million BTC, while public companies, including major holders such as Strategy and Tesla, collectively own around 993,341 BTC. Several countries, most notably El Salvador, hold a combined 517,296 BTC, while private companies control an additional 426,337 BTC.

Additionally, around 267,236 BTC sits within DeFi projects, while Bitcoin miners themselves retain approximately 120,120 BTC. The remaining Bitcoin supply is held across various uncategorized wallets. 

Bitcoin Holdings by Category

Renowned Trader Opens Massive XRP Short With 20x Leverage

0

The crypto market entered deeper bearish territory over the weekend, with high-risk traders opening massive shorts on major coins like XRP.

On-chain analytics platform Lookonchain revealed that a well-known gambler from Roobet and Stake.com has initiated a new wave of aggressive short positions targeting Bitcoin, XRP, and Zcash, using significant leverage.

According to the data, the trader deployed a total position size of $196 million, employing 40x leverage on BTC, 20x on XRP, and 10x on ZEC. The positions break down:

  • 1,555.56 BTC ($148.5 million)
  • 12.34 million XRP ($27.4 million)
  • 31,016 ZEC ($20.4 million)

The move comes amid heightened market fear after Bitcoin dipped to $92,900 over the weekend, with the crypto Fear & Greed Index hitting 10—the worst level since 2022.

“XRP Could Fall to $0.20”

Among the positions, the 20x leveraged XRP short stands out, especially as sentiment around the token continues to weaken. XRP’s price dropped 11% over the past week, trading at $2.27 despite the launch of ETFs.

Critics argue that the token remains fundamentally overvalued even after multiple corrections.

Widely followed trader Crashius Clay has predicted that XRP could fall all the way to $0.20, noting that even at that level it would “still be overvalued and way too high.”

He cited the tightening macro environment, thinning retail liquidity, and XRP’s mounting competition from stablecoins.

As Clay put it: “There’s no demand for shitcoins when people are down bad; they gotta exit at whatever price they can.”

Clay also highlighted the weakening XRP/BTC pair, calling it extremely bearish. This indicates that XRP’s relative performance against Bitcoin continues to deteriorate.

Echoes of His Earlier Warnings

Clay’s latest comments align with his October warnings, where he described XRP as one of the most fundamentally sound shorts of this cycle, possibly even “in the history of humanity.”

At the time, he argued that this bull run could be XRP’s last, claiming that the rise of stablecoins and CBDCs had eroded its original use case in cross-border payments.

He also pointed to SWIFT’s blockchain-based shared ledger, backed by major banks like JPMorgan and HSBC, as evidence that institutions have moved on from the idea that XRP could become the backbone of international settlements.

Clay has a track record to back up his skepticism. Earlier this year, he disclosed $1 million in short positions that earned him over $800,000 as XRP fell from multi-year highs. He once described XRP as “a disguised meme coin” and one of the easiest shorts of his trading career.

Now, with the market weakening again, his message has returned with greater intensity.

Can XRP Still Reach $10 This Year?

While bearish traders bet on further XRP losses, the community remains bullish. Some see long-term value in Ripple’s global expansion, partnerships, and ongoing ETF launches. Certain analysts insist XRP could still hit $8–$10 this year.

Will Cardano Price Recover as ADA Approaches Short-Term Support?

Cardano may be approaching an imminent short-term support as liquidation data shows ADA punishing the bulls more.

Notably, Cardano (ADA) is facing renewed downward pressure, with its price slipping further in the past 24 hours and deepening a multi-week decline. As bearish sentiment grips the broader crypto market, the coin now trades below $0.50, a psychologically important level, and is testing key support amid declining investor confidence.

Over the past 24 hours, ADA has seen a modest decline of 2.4%, continuing its recent downward momentum. Looking at the 7-day performance, ADA has fallen sharply by 15.6%, marking a significant weekly loss.

Cardano Price Analysis

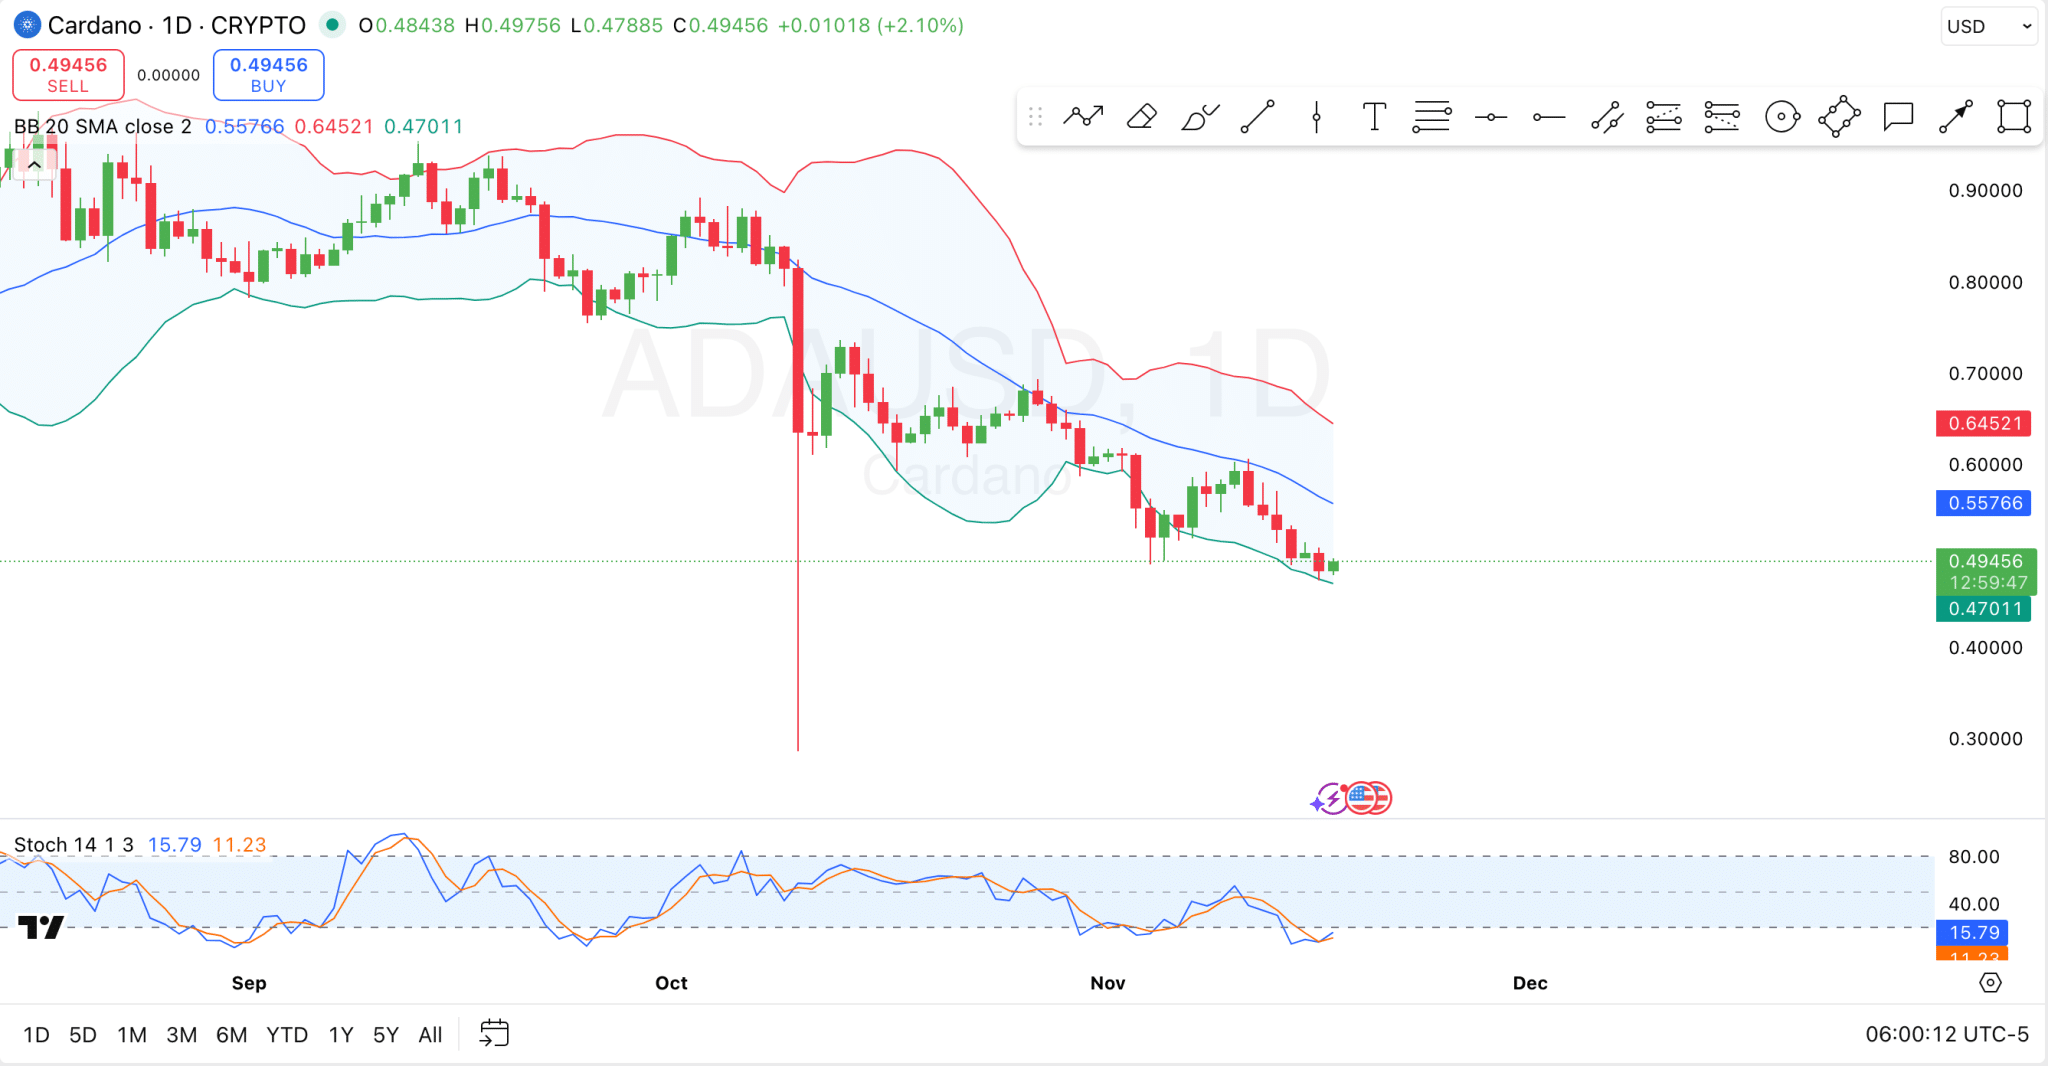
On the technical end, the daily chart reveals ADA consistently trading below the middle Bollinger Band (20 SMA), which currently sits near $0.5577. The upper and lower bands, at $0.6452 and $0.4701 respectively, highlight a potential contraction in volatility, often a precursor to a potential breakout or breakdown.

At the moment, ADA is hovering near the lower Bollinger Band, indicating that it remains in oversold territory and may be approaching a short-term support zone.

Screenshot 2025 11 17T140019558
Cardano

The Stochastic RSI at the bottom of the chart supports this view, with the %K and %D lines respectively at 15.79 and 11.23, well below the typical oversold threshold of 20.

This suggests that bearish momentum could be nearing exhaustion, and a short-term bounce or relief rally may be possible. However, as long as ADA remains below the midline of the Bollinger Bands, any upward movement is likely to meet resistance around the $0.55–$0.56 zone.

Cardano Liquidation Data

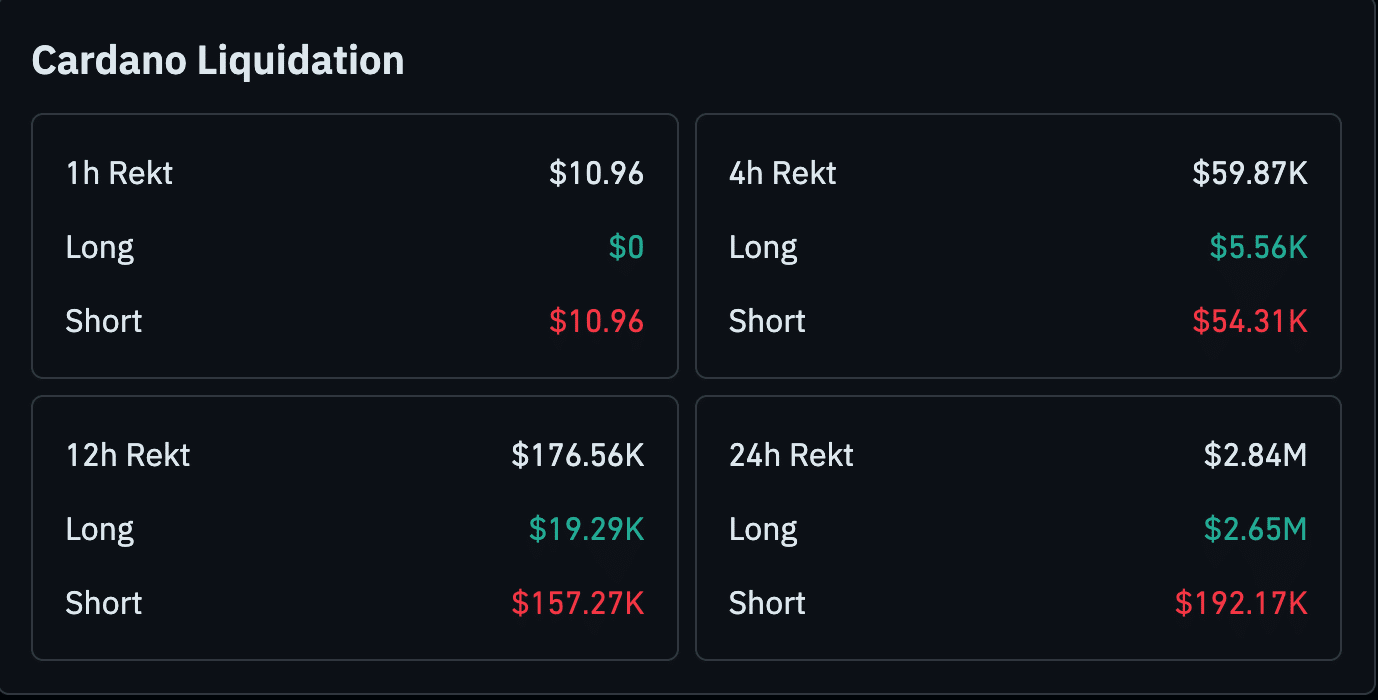
Meanwhile, the latest ADA liquidation figures show a spike in leveraged market activity, with a total of $2.84 million liquidated over the past 24 hours. The data shows that, of this figure, long positions accounted for $2.65 million, compared to just $192.17K from shorts. 

Screenshot 2025 11 17T141032526

This imbalance suggests that a majority of traders were betting on upward price movement, only to be caught off guard by ADA’s continued bearish price action.

In the shorter-term windows, the trend is similar but less severe. Over the past 12 hours, liquidations totaled $176.56K, with $157.27K coming from shorts and only $19.29K from longs, a sign of a possible intraday reversal or price spike that hurt overleveraged bearish positions.

The 4-hour chart shows a smaller $59.87K in total liquidations, dominated again by shorts ($54.31K), suggesting a brief upward move triggered stop-losses on bearish trades.

Here is Level Solana Price Must Break for a Potential Reversal

Solana must break critical resistance as bearish momentum prevails, though oversold RSI hints at a potential short-term relief bounce.

Notably, over the past 24 hours, Solana (SOL) has seen a slight decline of 0.6%, bringing its current price to $141.10. While this short-term dip appears modest, it caps off a deeper 7-day slide of 15.6%, with SOL falling from highs near $169 to a low around $135 before showing a small recovery. The downtrend is part of a broader negative pattern, with Solana also down 24.2% over the past month.

Despite the price drop, SOL continues to demonstrate strong market fundamentals, boasting a market cap of $78.15 billion and 24-hour trading volume exceeding $5.28 billion, up 64% in the last 24 hours.

Solana Price Analysis

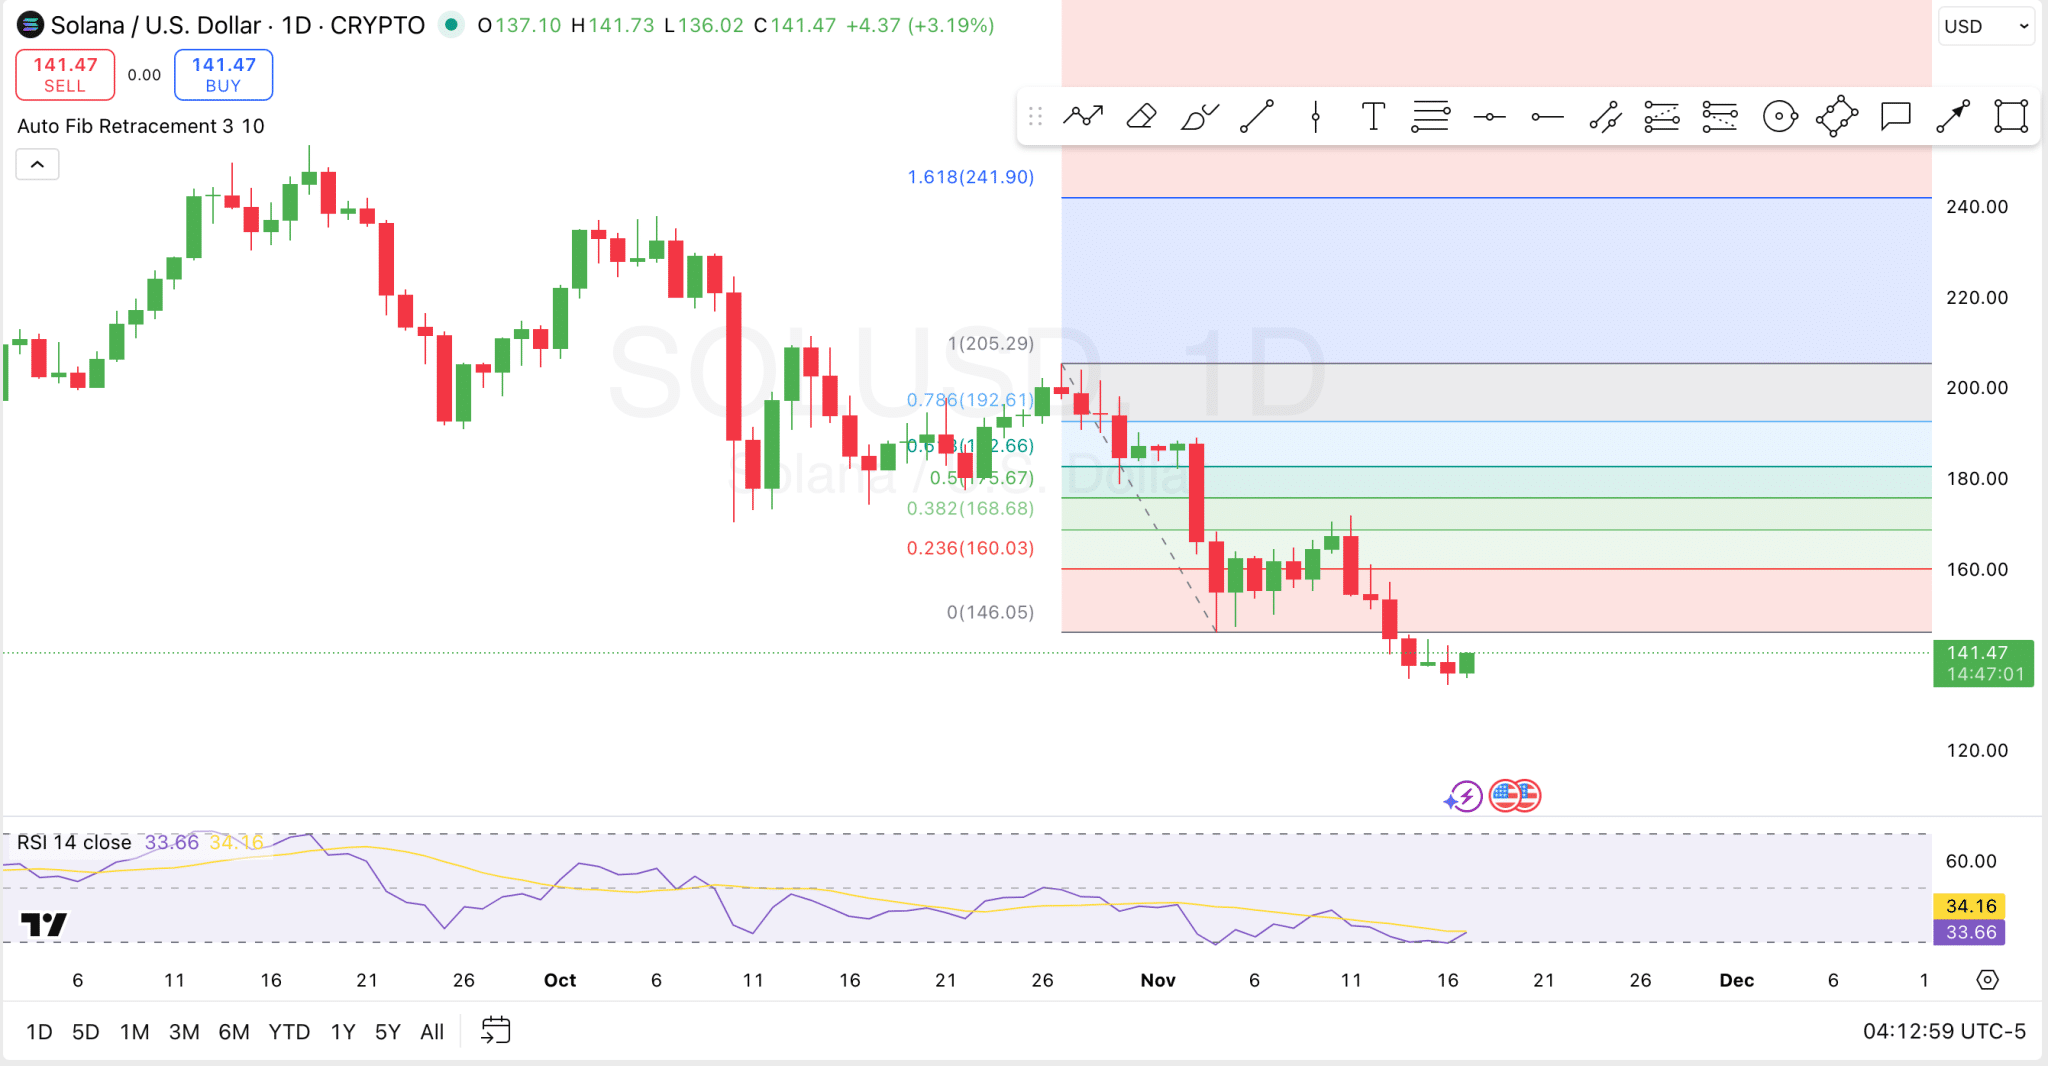
On the technical charts, SOL is showing early signs of a potential short-term reversal after the prolonged downtrend. The daily chart reveals Solana has bounced slightly above its November 16 low, but it remains well below key Fibonacci retracement levels. 

Screenshot 2025 11 17T121308625
Solana

Specifically, the price is trading under the 0% retracement level at $146.05, which suggests that bearish momentum still dominates. For bulls to regain control, SOL would need to decisively break above the $160 resistance and ideally reclaim the 38.2% level at $168.68. Until then, any bounce may be viewed as temporary rather than a full trend reversal.

Adding to the cautious outlook is the Relative Strength Index (RSI), currently sitting at 33.66, which places Solana firmly in oversold territory.

An RSI at this level suggests that selling pressure has been excessive and could be nearing exhaustion, often a signal that a short-term relief rally may be on the horizon. What traders will be watching for is bullish divergence, where price makes a lower low but RSI makes a higher low, potentially indicating weakening bearish momentum. 

A Do or Die Moment?

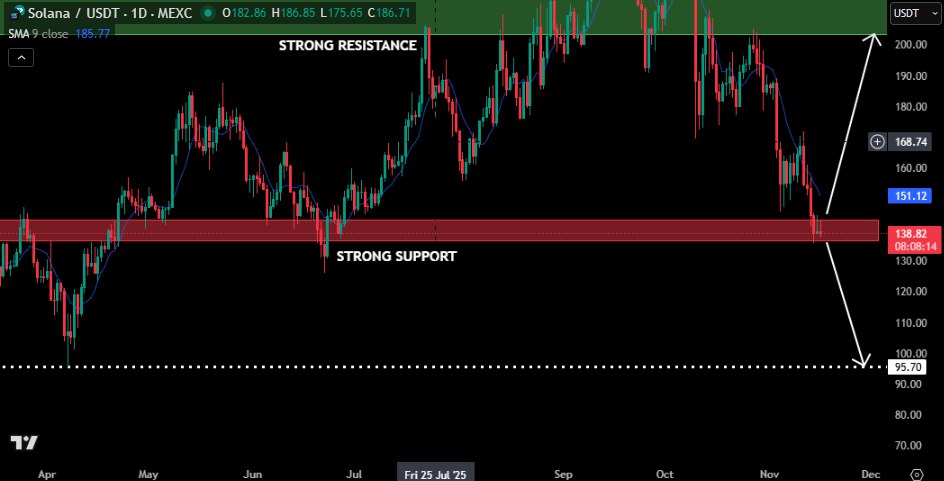
Elsewhere, analyst Henry paints a high-stakes picture for Solana, describing it as being on the edge of a “do-or-die” moment. His daily Solana chart shows the price currently testing a strong support zone below $141. 

Image

If this support fails, the next potential target is around $95.70, as marked. Conversely, if the support holds, a bounce toward the $150–$170 range is possible, with a longer-term target near the strong resistance at $200. 

Bitcoin Now Trades Just 9% Above ETF Realized Price — Here’s What It Means

0

Bitcoin trades 9% above the ETF realized price, as data shows a narrowing profitability and shifting trends from 2024 to 2025.

In a post on X, crypto analyst JA Maartunn reported that the realized price for U.S. spot Bitcoin ETFs has climbed to $86,680. This places Bitcoin’s current price at approximately 9% above the average cost basis of ETF investors.

For those unfamiliar, the realized price reflects the average purchase price of Bitcoin held by ETF investors. It serves as a key metric to gauge whether institutional holders are in profit or at a loss, helping analysts interpret market trends.

Bitcoin ETF Historical Trend Predicts What Could Come Next

Since early 2024, ETF investors have moved through several Bitcoin cycles. In March, when Bitcoin traded between $50,000 and $73,000, ETF realized prices were just below the spot price, resulting in slight profitability.

By April and May, ETF realized prices rose into the $60K+ range, and MVRV improved as early ETF buyers gained traction.

Line chart titled Bitcoin ETF Drawdown from ATH displays three lines in orange green and blue representing Realized Price USD BTC USD and BTC ETF MVRV over time from 2017 to 2024 with price scales on left and right y-axes and date on x-axis showing fluctuations and current values around 100k USD

During the mid-2024 consolidation, when Bitcoin was below $70,000, ETF realized prices continued to rise steadily. Notably, realized prices traded above the spot price in July, indicating an MVRV ratio of 0.94 to 0.97 before a minor recovery—one of the few times ETF holders were underwater.

Meanwhile, from late 2024 to early 2025, a major breakout occurred. Bitcoin surged above $100,000, reaching a peak of around $109,000. During this period, ETF realized prices reached the low-$70K range, driving MVRV above 1.4 and signaling strong profitability.

By mid-2025, despite price volatility ranging from $90,000 to just below $116,000 due to profit-taking, ETF realized prices continued to rise gradually, indicating ongoing dip buying.

Bitcoin reached a new all-time high above $126,000 in October, but the realized price did not exceed $87,000, yielding a positive MVRV of 1.44.

Currently, Bitcoin trades near $ 95,000, the ETF realized price is around $ 86,000, and MVRV is close to 1.1, suggesting that ETF holders have only a thin profit margin left—signaling stability but weakening momentum.

What this Means for Bitcoin

Notably, the ETF MVRV is a risk gauge for ETF holders. If the ETF MVRV falls below 1.0, it means that ETFs are holding Bitcoin at a loss, increasing the likelihood that they may sell to cut their losses and potentially accelerate the ongoing dip.

Conversely, if ETF managers treat dips as buying opportunities, as happened in 2024, renewed accumulation could quickly reverse the sell-off and push BTC higher.

Meanwhile, spot ETF flows suggest consolidation, as a $524 million inflow on November 11 was followed by consecutive outflows of $278 million, $866 million, and $492 million from November 12 to 14.

Research from The Kobeissi Letter attributes the recent downturn to structural pressures rather than weakening fundamentals, noting the mid-October sell-off stemmed from institutional withdrawals. The analyst expects stabilization once excess risk is cleared, hinting that market bottoms may be forming.

CryptoQuant CEO Ki Young Ju similarly notes that Bitcoin remains outside bear market territory as long as it holds above $94,635, the average cost basis for 6–12 month holders.

Shiba Inu Selling Pressure Eases as Investors Withdraw 125B SHIB From Exchanges in a Single Day

0

Despite Shiba Inu persistent price weakness, the exchange reserve metric suggests investors are aggressively pulling SHIB off exchanges.

CryptoQuant data indicate that holders are withdrawing SHIB from exchanges at a rapid pace, a trend that could help alleviate selling pressure on the top meme coin.

125B Shiba Inu Out From Exchanges

On November 15, Shiba Inu experienced a major exchange outflow. CryptoQuant data confirmed that approximately 125 billion SHIB were withdrawn from exchanges on that day.

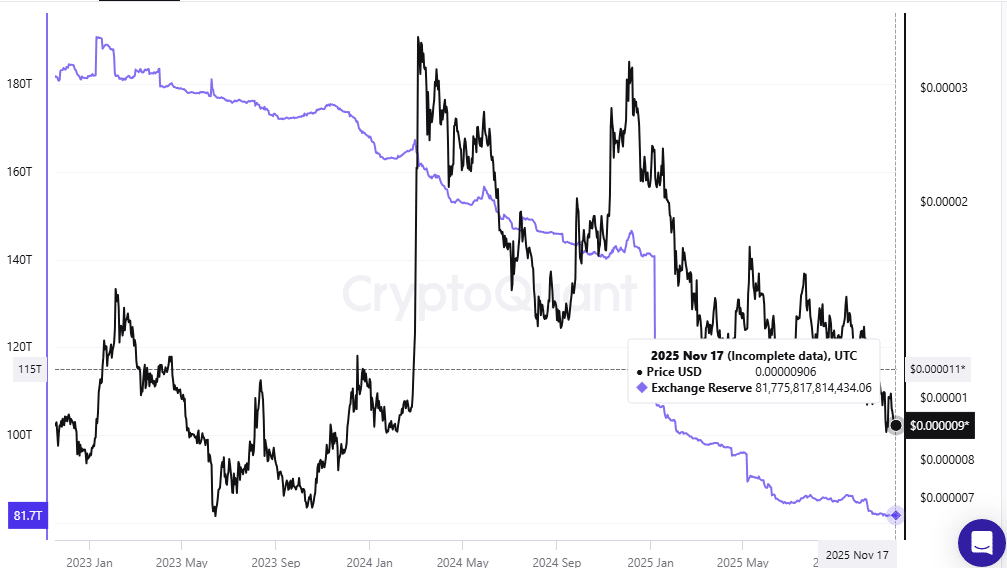
As a result, SHIB’s exchange reserves fell from 81.815 trillion on November 14 to 81.693 trillion on November 15. Although the drop continued into November 16, the reserve metric recovered slightly to 81.77 trillion at press time.

SHIB Exchange Reserves
Shiba Inu Exchange Reserves

Despite the slight rebound, the metric shows that approximately 260 billion Shiba Inu tokens have been removed from exchanges since the beginning of this month. Exchange reserves have dropped from 82.03 trillion SHIB on November 1 to 81.77 trillion as of today.

Easing Selling Pressure, But SHIB Price Struggles

A drop of this magnitude usually indicates that spot selling pressure is waning significantly. Historically, sustained outflows have preceded trend reversals, as the available supply for immediate sale diminishes.

Despite the positive exchange flow data, the price of Shiba Inu has yet to react positively. On November 15, when 125 billion SHIB tokens were withdrawn from exchanges, the token’s price fell to $0.00000895.

It continued its downturn, eventually reaching $0.0000086 on November 16. Currently, SHIB is trading at $0.00000903, marking a 10.13% decline over the past seven days and a 1.06% drop over the past 24 hours.

Nonetheless, the significant drop in Shiba Inu’s exchange reserves suggests that investors are not panic-selling.

Shibarium Activity Wanes

While Shiba Inu’s exchange reserve metric has turned bullish, activity on its Layer-2 network, Shibarium, has slowed sharply. Specifically, transaction volume has plummeted from a monthly peak of 17,270 on October 24 to just 2,430 at the time of this report—an 85.92% decline in only a few weeks.

The steep decline in Shibarium’s transaction volume mirrors the broader market downturn, as investor sentiment slips into a phase of extreme fear.

Despite the recent drop in activity, Shibarium has now processed over 1.56 billion transactions since its launch, surpassed 14.14 million blocks, and reached a total of 272.76 million addresses.

Crypto Fear Index Hits 10, a Three-Year Low, as Bitcoin Dips to $92,900

0

The global crypto market entered a deeper risk-off phase this week, with Bitcoin holding below the $100,000 threshold for a third consecutive day.

According to CryptoQuant analyst JA Maartun, the industry’s Fear & Greed Index fell to 10, signaling Extreme Fear. This marks the lowest reading since July 2022, highlighting growing anxiety among investors.

Bitcoin Extends November Slump

That unease has only intensified as Bitcoin extends its mid-November slide. The asset once again fell below $100,000 psychological mark on November 13, 2025, and today marks the third day it has remained under this critical level.

At press time, Bitcoin was trading near $95,560, down 0.51% over the past 24 hours and nearly 10% for the week.

The downturn began last month and continued into November, with Bitcoin’s price dipping to $92,900 over the weekend.

The weakness has rippled across major altcoins. Over the past week, Ethereum fell more than 11% to roughly $3,188, Solana recorded a sharper 15% drop to $141.21, and XRP declined 9.14% to $2.26.

Liquidations Mount as Longs Get Hit Hardest

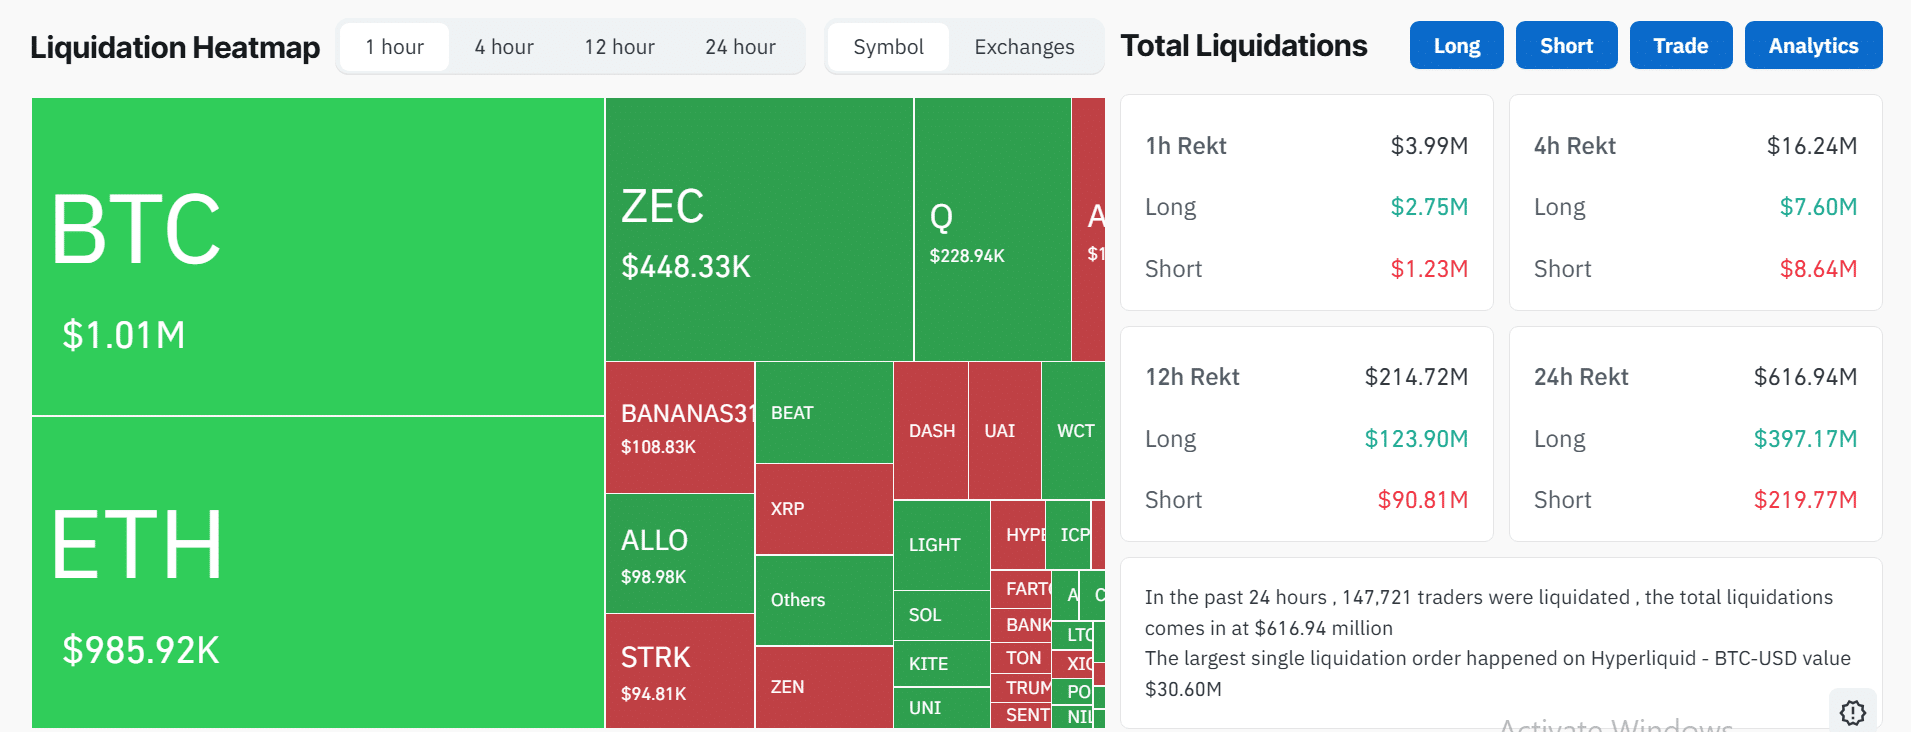
Market volatility led to heavy liquidations across derivatives platforms. Data from CoinGlass showed that traders absorbed $616.94 million in forced liquidations during the past 24 hours. Long positions accounted for $397.17 million, while shorts made up $219.77 million. 

The largest single liquidation involved a $30.60 million order on Hyperliquid tied to the BTCUSD pair.

Crypto Liquidations
Crypto Liquidations

CryptoQuant CEO Says Bear Market Not Confirmed

Despite the downturn, CryptoQuant CEO Ki Young Ju stated that the market has not entered a confirmed bear phase. He argued that inflows continue to support the network. 

Earlier this month, Ju noted on X (formerly Twitter) that Bitcoin’s realized capitalization reached $1.1 trillion, its highest level ever. He said this figure shows ongoing capital movement into the asset. 

Ju also acknowledged that early large holders have been selling. He believes the strain may ease if their sales slow and global macroeconomic sentiment improves.

Shiba Inu: These Developments Confirm SHIB Isn’t Going to Zero

0

Despite the recent market downturn sparking fears that Shiba Inu could be heading to zero, whale activity and SHIB’s underlying market structure tell a very different story.

Shiba Inu, like many other crypto assets, has been facing a sustained downturn, recently losing the psychological $0.00001 level. Although SHIB briefly climbed to around $0.00001022 last week, the token failed to maintain that upward momentum. It dropped to $0.0000086 over the weekend before recovering slightly to $0.00000898.

Shiba Inu Heading to Zero?

A recurring theme within the Shiba Inu community is that every sharp decline prompts speculation that the SHIB price is headed to zero. Critics often amplify these narratives to fuel panic and unsettle holders. With Shiba Inu retracing, the “heading to zero” claims have resurfaced across social platforms.

While things have not been looking good for Shiba Inu lately, large, liquid assets with multi-billion-dollar market caps, such as Shiba Inu, do not suddenly plummet to zero price.

Currently, several exchanges are reporting massive daily volumes of SHIB. Data from CoinMarketCap shows that Shiba Inu’s volume soared 17.43% over the past 24 hours to $138.49 million. A significant portion of this volume originated from KuCoin, Binance, Upbit, OKX, and Coinbase.

Moreover, Shiba Inu has been trading in a tight consolidation for weeks, with its price stuck between the $0.000009 and $0.000010 range. This price structure typically precedes a significant price action, either to the upside or downside.

Whales Remain Resilient As SHIB Exchange Reserves Drop

Another compelling indicator that supports the Shiba Inu thesis is the behavior of whales toward the token.

If SHIB were on the brink of collapse, data would show large holders moving tokens to exchanges to sell. That is not happening. Retail investors are also not offloading SHIB in significant volume.

CryptoQuant data indicate that exchange reserves of SHIB have steadily declined, reaching 81.77 trillion tokens as of press time, a decrease from 82.03 trillion on November 1. This suggests that holders are either moving SHIB off exchanges or holding tightly, which undermines the narrative of a mass sell-off.

SHIB Exchange Reserves
SHIB Exchange Reserve

Analysts Still Bullish on SHIB

Meanwhile, several crypto analysts remain optimistic about Shiba Inu’s long-term prospects. TradingView analyst Kledji Cuni recently projected that SHIB could rally between 100% and 512%, potentially pushing the price as high as $0.0000420.

Adding to the bullish outlook, several experts expect Shiba Inu to trade with three zeros in the coming months. Among those sharing this sentiment are Eunice Wong and Himanshu Maradiya, founder and chairman of the CIFDAQ Blockchain Ecosystem.

Team Optimistic After SHIB Joins Japan’s Green-List

Despite the recent negative market sentiment, the Shiba Inu team appears unshaken. It recently teased an upcoming integration with Bitget Wallet, sparking speculation that the partnership may involve payments or enhanced utility.

SHIB also received a significant legitimacy boost as it joined Japan’s green list, joining major assets like Bitcoin and Ethereum.

SHIB ETF on the Horizon?

In the meantime, optimism has grown around the possibility of a Shiba Inu ETF emerging in the U.S. This wave of speculation follows Grayscale’s disclosure that SHIB qualifies for an ETF under the SEC’s Generic Listing Standard (GLS) framework.

While no U.S. asset manager has filed for a SHIB ETF, community commentators believe it is only a matter of time.

Shiba Inu Faces Stagnation, Not Elimination

Ultimately, Shiba Inu is not at risk of crashing to zero. The main concern is stagnation.

Despite a 17.43% volume increase in the past 24 hours, trading remains well below recent highs. If low catalysts persist, SHIB may drift sideways, but a collapse to zero is unlikely, given the current market structure.