Home Blog Page 43

Tesla Short Sellers Were Up $9 Billion in 2026. But That Figure Is Already Stale

Tesla short sellers had accumulated approximately $9.08 billion in mark-to-market gains during 2026 following the electric-vehicle company’s sharp post-earnings selloff in July.

The figure is legitimate, but it should not be presented as a real-time estimate for August 17.

Data from financial analytics firm S3 Partners showed that bearish Tesla traders were sitting on approximately $9.08 billion in unrealized year-to-date gains after TSLA plunged 14.5% on July 23.

That single-session decline generated approximately $4.3 billion in paper profits for traders betting against Tesla. Around 3% of the company’s outstanding shares were sold short at the time, making Tesla the most heavily shorted member of the Magnificent Seven.

Tesla’s Recovery Changes the Short-Seller Calculation

The $9.08 billion figure was calculated following the July 23 decline and should not be treated as a current reading.

Tesla closed at $319.69 after the earnings-driven selloff. The stock then continued falling, reaching a closing low of $298.32 on July 29 before recovering to approximately $339.20 by August 17.

Short sellers who maintained unchanged positions through that recovery would have surrendered some of the additional gains generated during the late-July decline. However, calculating their current collective profit requires updated information covering the number of shares sold short, individual entry prices, closed positions and new trades.

It would therefore be misleading to report that Tesla short sellers are currently up exactly $9 billion without identifying July 23 as the calculation date.

Nevertheless, Tesla remains substantially lower for the year. The stock has fallen approximately 24.6% from its December 31 closing price of $449.72.

That decline suggests that short positions opened near the beginning of 2026 and held unchanged would remain profitable. It does not prove that Tesla short sellers collectively have the same profit because traders enter and exit positions at different prices.

Why Tesla Shorts Profited in 2026

Tesla’s second-quarter earnings intensified concerns about profitability and the company’s growing capital requirements.

Tesla reported adjusted earnings of $0.33 per share, well below the $0.55 average in its company-compiled analyst consensus.

Revenue reached $28.24 billion, exceeding Tesla’s compiled consensus estimate of approximately $27.58 billion. However, GAAP operating income fell 57% year over year to $398 million, leaving the company with an operating margin of only 1.4%.

Tesla generated $4.70 billion in operating cash flow, but capital expenditure more than doubled to $5.79 billion. Consequently, free cash flow turned negative by approximately $1.09 billion.

The increased spending supports Tesla’s artificial intelligence infrastructure, autonomous vehicles, Optimus robots, manufacturing capacity and other long-term projects. Investors are now evaluating how quickly those investments can produce material revenue and earnings.

Tesla’s automotive business remains its primary revenue engine and must generate sufficient cash to support those projects while competing with global electric-vehicle manufacturers and managing pressure on vehicle pricing.

Tesla’s Valuation Remains Elevated

Tesla continues to trade at more than 300 times trailing earnings despite its 2026 decline. Its forward valuation is lower but remains considerably higher than those of traditional automakers and most other large technology companies.

That premium reflects expectations that Tesla will eventually generate substantial revenue from autonomous driving, robotaxis, artificial intelligence and humanoid robots.

However, the valuation also makes the stock vulnerable when current earnings disappoint or when the expected commercialization of future products appears likely to take longer than investors anticipated.

TSLAB Tokenized Stock Tracks Tesla Lower

Tesla’s tokenized bStock, TSLAB, traded near $339.30 on Binance at the time of reporting. The token had declined approximately 1% over the preceding 24 hours, while trading volume approached $928,000.

TSLAB is designed to provide eligible users with tokenized economic exposure to Tesla shares through crypto-market infrastructure.

However, TSLAB trades through a separate Binance order book. Differences in liquidity, spreads, rolling 24-hour calculations and trading hours can therefore cause its displayed price and percentage return to temporarily differ from Nasdaq-listed TSLA.

Verdict

The reported $9.08 billion gain is supported by S3 Partners data, but it represents a mark-to-market estimate calculated after Tesla’s July 23 selloff. Not a real-time August figure.

Tesla’s continued year-to-date decline indicates that shorts established near the beginning of 2026 would remain profitable if held unchanged. However, the current collective profit or loss of all Tesla short sellers cannot be determined without updated position data from S3 Partners or another short-interest analytics provider.

For both TSLA and TSLAB traders, the central issue is whether Tesla can convert its enormous investments in AI, autonomy, robotics and manufacturing into higher margins and sustainable cash flow.
Ripple Boosts RLUSD Mints on XRP, Deploys $30M in 5 Hours

0

Ripple appears to have ramped up minting of its proprietary stablecoin RLUSD on the XRP Ledger after a period of relatively low activity. 

Ripple Ramps up RLUSD Mints on XRP

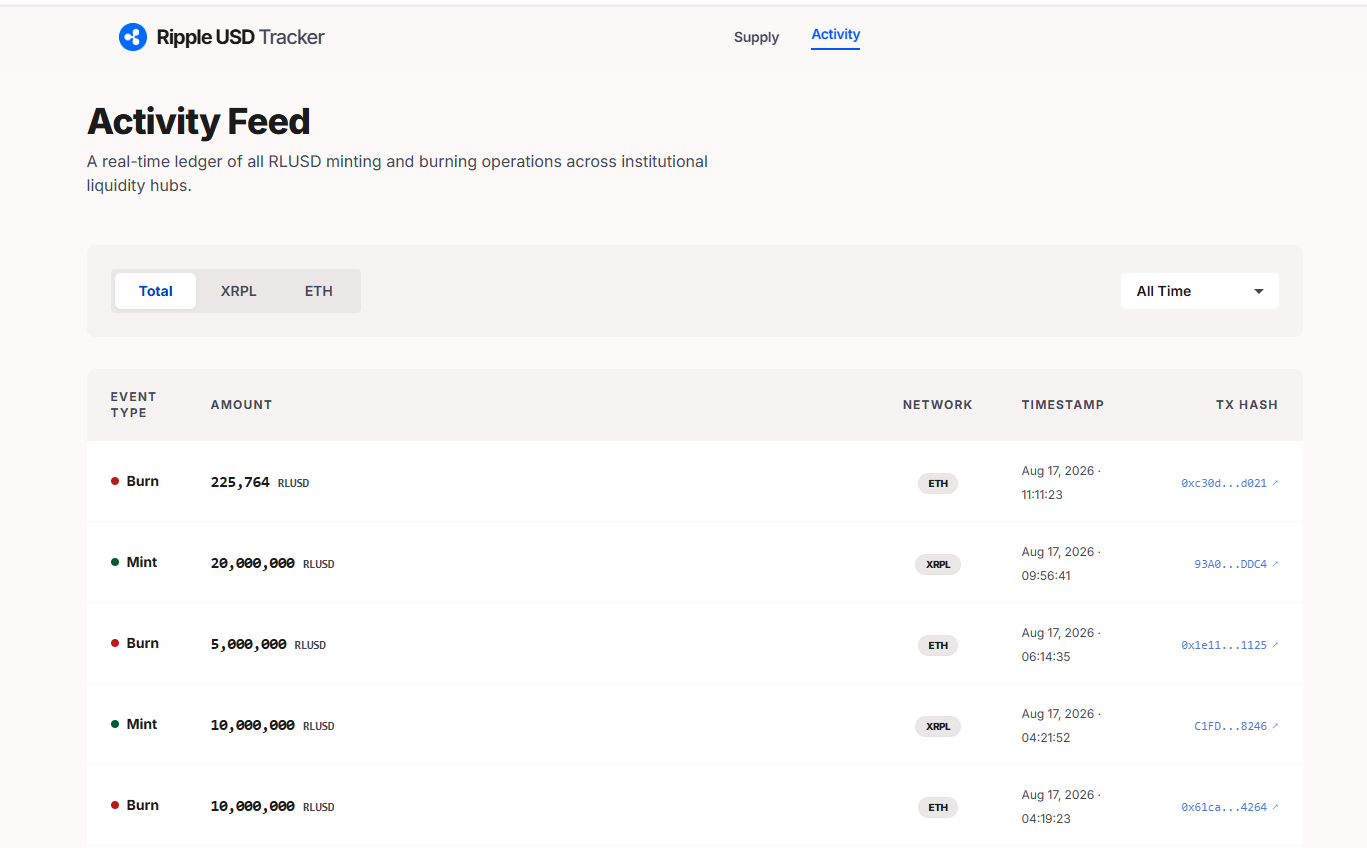
According to data from RL Tracker, a community-driven RLUSD tracker, the company minted $30 million worth of RLUSD on the XRP Ledger in two transactions within five hours on Aug. 17. 

The first transaction came at 03:21 UTC, when Ripple minted $10 million in RLUSD. A little over five hours later, at 08:56 UTC, the company followed with another $20 million mint.

Ripple Mints RLUSD on XRP Ledger

The latest activity comes three days after Ripple followed a similar pattern on the XRPL. 

On Aug. 14, the company minted $10 million in RLUSD at 20:00 UTC before adding another $20 million at 20:52 UTC, less than an hour later. Overall, these transactions mean Ripple has minted $60 million worth of RLUSD on the XRP Ledger since Aug. 14.

Ethereum Sees Recent RLUSD Burns

While Ripple has continued to deploy RLUSD to the XRP Ledger, it has not recorded any burns on the network during this period. Instead, the recent burns have taken place on Ethereum.

For instance, Ripple burned $10 million in RLUSD on Ethereum at 03:19 UTC on Aug. 17, only two minutes before it minted $10 million on the XRPL at 03:21 UTC. 

Later on, the company burned another $5 million in RLUSD on Ethereum at 05:14 UTC. Interestingly, this transaction came nearly four hours before Ripple minted $20 million on the XRPL at 08:56 UTC.

However, despite the recent rise in XRPL-focused mints, Ethereum has recorded the stronger net increase in RLUSD supply over the past 30 days. RL Tracker data puts the overall RLUSD supply at $1.731 billion at press time, showing continued growth across both networks.

On Ethereum, Ripple has minted $379 million in RLUSD over the past 30 days while burning $176 million. This leaves the network with a net increase of $203 million. 

Much of this minting came last week, with Aug. 14 standing out in particular. Ripple minted $110 million in RLUSD on Ethereum that day, while burning just $5 million.

XRP Ledger Maintains Its Supply Lead

The XRP Ledger has seen even more total minting over the same 30-day period, but burn activity within this period has overshadowed these mints. 

Specifically, Ripple minted $409 million in RLUSD on the XRPL but burned $412 million, leaving the network with net growth of –$3 million. Large burns toward the end of July and again in mid-August played a major role in producing this figure.

Despite the negative net growth, the XRPL still holds more RLUSD than Ethereum. Of the $1.731 billion total supply, $879.499 million in RLUSD sits on the XRP Ledger, compared with $851.518 million on Ethereum.

SNDK Stock Adds $101 Billion in Two Weeks as AI Memory Rally Accelerates

Sandisk (SNDK) shares extended their remarkable recovery Monday, rising approximately 10% and briefly trading above $1,800 as investors continued to reprice the company’s exposure to artificial intelligence infrastructure and constrained memory supply.

SNDK climbed approximately 61% from its August 3 intraday low of $1,121.27 to around $1,808. Using approximately 148 million shares outstanding, that price recovery represents an estimated $101.7 billion increase in market capitalization.

However, claims that Sandisk gained approximately 62% in 14 days require context. Measured from its August 3 closing price of $1,288.03 rather than the session low, SNDK’s advance is closer to 40%, equivalent to approximately $77 billion in additional market value. Nasdaq historical data

Why Is SNDK Stock Surging?

The latest rally followed Sandisk’s investor day, where management projected mid-to-high-teens annual revenue growth from fiscal 2028 through fiscal 2030.

The company also outlined long-term adjusted gross margins of approximately 80%, adjusted operating margins of about 75% and an adjusted free-cash-flow margin near 50%. Management expects growing AI infrastructure investment to support demand for NAND flash storage.

Those forecasts helped ease concerns that Sandisk’s recent earnings growth and elevated margins could rapidly reverse during the next memory-market downturn.

The investor-day projections reinforced an already powerful earnings story. Sandisk recently reported fiscal fourth-quarter revenue of $8.97 billion, up 372% year over year and 51% sequentially. Its GAAP gross margin reached 84.6%, compared with 26.2% in the same quarter one year earlier.

Datacenter revenue more than doubled from the previous quarter to approximately $2.98 billion. Sandisk also projected fiscal first-quarter 2027 revenue of between $10.3 billion and $10.8 billion.

Its board authorized an additional $14 billion in share repurchases, bringing the company’s remaining repurchase capacity to approximately $15.5 billion. Sandisk earnings release

Apple-China Report Adds to Memory-Sector Optimism

Monday’s advance also formed part of a broader memory-stock rally, with Micron and Western Digital gaining alongside Sandisk.

Barron’s reported that US Commerce Secretary Howard Lutnick warned Apple against sourcing memory chips from China. The report strengthened sentiment toward memory suppliers outside China by reducing some concerns about future competition from Chinese manufacturers.

Nevertheless, Sandisk’s investor-day targets, accelerating datacenter revenue and elevated NAND pricing remain the primary fundamental drivers behind its latest recovery.

Has SNDK Passed Every Wall Street Target?

No. SNDK has surpassed several of Wall Street’s more conservative price targets, but claims that it has moved beyond almost every analyst forecast are inaccurate.

The average analyst target was approximately $2,210 following Sandisk’s investor day, according to market data cited by Barron’s. JPMorgan resumed coverage with an Overweight rating and a $2,250 target.

More bullish forecasts remain considerably higher. Bernstein has a $3,000 target, while other estimates have reached approximately $3,250.

Sandisk therefore remains below the average target and several of Wall Street’s most optimistic forecasts despite its rapid rebound. Investors should also remember that analyst targets can change quickly following earnings, investor events and major stock-price movements.

SNDKB Tokenized Stock Follows the Rally

Sandisk bStock (SNDKB) traded near $1,799 on Binance at the time of reporting, gaining approximately 8.4% over 24 hours.

Trading volume reached approximately $39.5 million as the tokenized stock followed the underlying Nasdaq-listed shares higher.

Because SNDKB trades through a separate Binance order book and can remain active outside regular US market hours, its price and rolling 24-hour return may temporarily differ from SNDK. Liquidity, spreads and changing expectations before Nasdaq opens can all contribute to short-term price differences.

Outlook for SNDK Stock

Sandisk’s earnings growth, NAND pricing power, expanding datacenter business and long-term customer agreements support a fundamental revaluation of the company.

However, a 61% rebound from an intraday low in only two weeks indicates that considerable optimism is already reflected in SNDK’s valuation. Sandisk also remains exposed to the historically cyclical nature of memory pricing, changing AI infrastructure spending and the possibility of increased future supply.

The rally has stronger foundations than momentum alone, but both SNDK and its tokenized counterpart could remain highly volatile following such a rapid increase.

IREN Stock Climbs as BlackRock Stake Nearly Triples to $609 Million. But There’s a Catch

IREN stock advanced approximately 2.5% to $45.15 during Monday trading amid renewed attention to BlackRock’s substantially larger position in the AI infrastructure company and IREN’s latest progress on its Microsoft contract.

IREN bStock (IRENB), the Binance tokenized stock tracking IREN shares, traded near $45.52 and gained approximately 1% over the preceding 24 hours at the time of reporting.

However, BlackRock’s increased position was not a new purchase made on Monday. The disclosure covers shares held at the end of the second quarter and does not reveal individual transaction dates or purchase prices.

BlackRock’s Reported IREN Position Nearly Tripled

BlackRock’s latest Form 13F filing shows that its affiliated investment managers reported holding 13,315,152 IREN shares as of June 30, 2026.

That compares with 4,457,120 shares disclosed in BlackRock’s previous quarterly filing, which covered holdings as of March 31.

BlackRock’s reported share count consequently increased by 8,858,032 shares, or approximately 198.74%, during the second quarter. Its total IREN position was valued at approximately $608.9 million at the end of June.

The additional shares had a quarter-end market value of approximately $405 million. That figure should not be interpreted as the amount BlackRock spent because Form 13F filings disclose the value of holdings on the final day of the quarter—not transaction prices.

The filing was submitted on August 7 and covers positions held as of June 30. It therefore does not provide evidence that BlackRock purchased IREN shares on Monday or immediately before the stock’s latest rise.

Microsoft Milestone Strengthens IREN’s AI Expansion

The more recent development supporting IREN’s investment case is its progress on a major AI cloud contract with Microsoft.

On August 13, IREN announced that its Horizon 1 data center had been delivered to and accepted by Microsoft. The deployment also achieved NVIDIA Exemplar Cloud status following testing of its GB300 NVL72 systems.

Horizon 1 is the first of four 50-megawatt, direct-to-chip liquid-cooled AI cloud deployments being developed for Microsoft at IREN’s Childress campus in Texas.

The four facilities support a five-year cloud services contract valued at approximately $9.7 billion. IREN expects to deliver Horizons 2 through 4 later in 2026, bringing the Microsoft deployments to a combined 200 megawatts of critical IT capacity.

Delivering the first facility reduces some of the execution risk surrounding the agreement. However, the remaining deployments must still be completed, commissioned and accepted before they can fully contribute to revenue.

IREN Targets More Than $4 Billion in AI Cloud ARR

IREN is expanding from its Bitcoin-mining origins into a large-scale AI cloud and data-center infrastructure provider.

The company is targeting 480 megawatts of gross AI cloud capacity by the end of 2026, followed by 1.2 gigawatts in 2027.

IREN also recently increased its year-end 2026 AI cloud annualized run-rate revenue target to more than $4 billion. Approximately 85% of that target is supported by signed contracts following $2.8 billion in new customer agreements.

Investors should note that annualized run-rate revenue is an operating metric—not a GAAP revenue forecast. The target depends on assumptions involving GPU deployment, commissioning, utilization, customer acceptance and pricing.

What BlackRock’s Position Means for IREN Stock

BlackRock’s larger reported position demonstrates that its affiliated funds had substantially greater exposure to IREN at the end of the second quarter. However, it should not automatically be interpreted as an active endorsement of the company’s valuation or business strategy.

BlackRock’s consolidated 13F covers positions managed through numerous affiliated investment managers, including passive and index-tracking funds. The filing does not explain which strategies drove the increase or why the shares were added.

The more important long-term signal for IREN stock is the company’s ability to convert planned data-center capacity into operating infrastructure and recognized cloud revenue. Microsoft’s acceptance of Horizon 1 represents measurable progress, but the remaining deployments, financing requirements and customer concentration continue to present risks.

For now, the combination of increased institutional exposure and progress on IREN’s AI contracts supports the bullish narrative. Nevertheless, BlackRock’s filing confirms a position held on June 30—not a fresh purchase made during Monday’s rally.

XRP to “Take Over” Ethereum, Bitcoin and Dominate Amid Wave 4 Completion

0

XRP price is approaching a major turning point against Bitcoin and Ethereum, according to analyst Dark Defender.

He believes the XRP-ETH pair is completing a Wave 4 correction before entering a powerful Wave 5 advance.

In a post on X, Dark Defender shared a two-week XRP/ETH chart and said XRP is currently “on the taxiway,” suggesting the token is preparing for its next major move.

Meanwhile, he noted that ETH’s price may appreciate a bit more in the coming days. But afterward, XRP “will take over Bitcoin and Ethereum and dominate the field,” in his words.

XRP-ETH Pair at Key Correction Zone

The analyst’s chart shows that the XRP-ETH pair is in Wave 4 of an Elliott Wave pattern, meaning it is going through a correction before a possible move higher.

The chart identifies the 30% Fibonacci level around 0.0004141 ETH and the 38.2% level near 0.0005487 ETH as important areas. The pair was recently trading around 0.000532 ETH, placing it close to the 38.2% retracement zone.

XRP price chart by Dark Defender

Dark Defender’s projected Wave 5 points significantly higher, with the chart displaying a 361.8% Fibonacci target around 0.002238 ETH. If the setup plays out, XRP could substantially outperform Ethereum during the next major rotation in the crypto market.

ChartNerd Offers a More Cautious Outlook

However, fellow XRP analyst ChartNerd offered a significantly more cautious interpretation of the XRP-ETH setup.

ChartNerd said there are “no absolutes,” but argued that XRP could continue losing ground against Bitcoin and Ethereum through the end of the year.

He said capital typically rotates into safer major assets first when a bear market ends. Bitcoin could therefore attract liquidity before Ethereum and, eventually, XRP.

Under this scenario, XRP could continue declining primarily against Bitcoin. As the price of Bitcoin dips, this could create further weakness for Ethereum, XRP, and other altcoins.

XRP Price Still Trails Ethereum in 2026

According to CoinMarketCap figures at press time, XRP was trading around $0.9959. It was down 3.35% over the past week, 8.30% over the past month, and roughly 46% year-to-date. XRP has dipped below $1 three times since last week, marking the first instances of this happening since 2024.

Ethereum, meanwhile, was trading around $1,891, down 1.36% over the past week but still up 2.52% over the past month and 36.38% year-to-date.

Regardless of the ongoing performance, many analysts believe XRP is in the final phase of its bear market, although a further drop to lows of $0.70 remains possible. However, they believe the opportunity is more heavily skewed to the upside than the downside, especially as XRP has fallen more than 73% from its $3.66 peak.

XRP Sits at a Knife’s Edge as Leverage Spikes Into a Near-Empty Spot Market

0

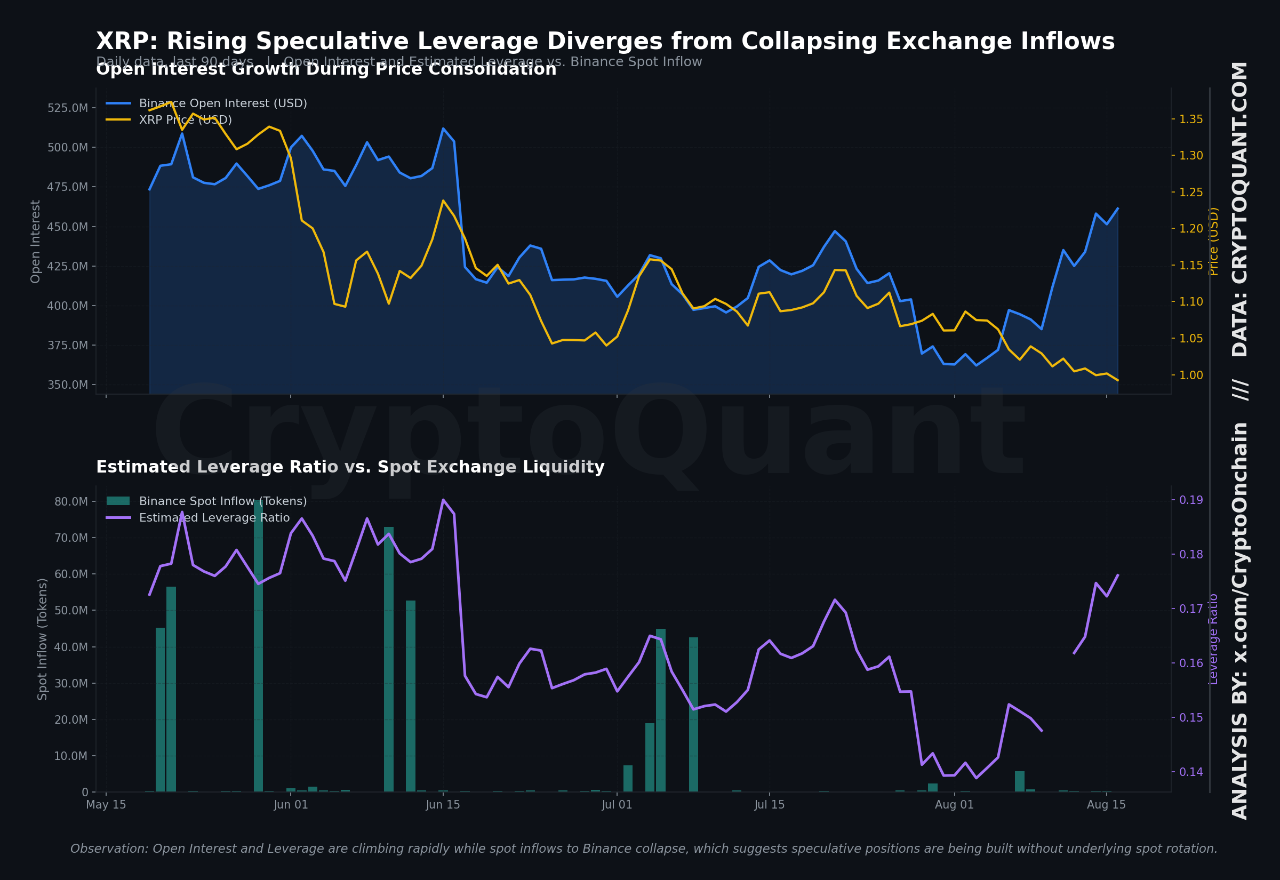
XRP now sits in a delicate position as leverage in the derivatives market continues to increase while exchange flows collapse more than 90%.

XRP closed last week at $0.99, which brought the token to the lower end of its six-month trading range.

Amid the weakness, data reveals a divergence between the derivatives market, which has continued to record rising leverage, and the spot market, where activity has almost come to a standstill.

This situation could make XRP more sensitive to sudden price moves. When the market witnesses less activity in the spot market to support price discovery, relatively small orders could have a larger effect on the price action.

XRP Spot Activity Drops on Binance

One sign of the decline in spot activity comes from Binance. Recent data shows that XRP inflows and outflows on the exchange have fallen 95% to 98% below their 90-day baselines. This suggests that far less capital is now moving through one of the market’s main trading venues.

Deposit addresses have also dropped by 96% over the same period, showing that fewer addresses are sending XRP to the exchange. In addition, trading volume has weakened, falling 17% week-over-week.

With this decline, the spot market has less influence over price discovery and provides less support for the derivatives market. 

As a result, XRP can become more exposed to sudden moves because relatively small orders may move the price more than usual. The lack of strong bids below the current price also leaves the market more vulnerable if selling picks up.

XRP Leverage Rises as Short Positions Build

While spot activity has faded, traders have continued to increase their derivatives exposure. For context, XRP open interest rose from 366 million on Aug. 4 to 461 million on Aug. 16. The figure represents a 10% increase from the 30-day baseline.

The leverage ratio also increased from 0.141 to 0.176 during the same period. This shows that traders have taken on more leveraged exposure even as XRP’s price has weakened.

Rising XRP Leverage Meets Declining Exchange Flows | Source: CryptoQuant

Meanwhile, funding remained slightly negative, ranging from -0.003 to -0.006 as open interest increased and XRP declined. Negative funding suggests that short positions have remained more dominant than long positions.

However, not every part of XRP’s market picture looks weak. Specifically, daily transactions remained close to 2 million on Aug. 16, which puts network activity 43% above its quarterly baseline.

It remains to be seen if this network activity can eventually translate into demand for XRP. For now, the two sides of the market remain separate. Network use seems healthy, while short-term price action continues to depend heavily on liquidity and leveraged trading.

$1 Becomes the Key Level

Notably, XRP entered Aug. 17 with the $1 level at the center of the market’s attention. The level has become both a psychological and technical point of interest, just above the $0.993 close recorded on Aug. 16.

At the same time, institutional demand has weakened. XRP ETFs recorded only $2.25 million in inflows throughout last week, reducing the support that institutional buying had recently provided.

A sustained move above $1 would put $1.02 in focus as the next immediate hurdle. XRP recently faced rejection around that level. A break above it could then bring $1.05 into view.

However, losing $1 would leave XRP with less support and could increase the risk of a move toward $0.80-$0.95. The weak spot market makes that risk more significant because there are fewer active bids to absorb additional selling.

BREAKING: Nike Stock Breaks Below $40, Hits Lowest Level Since 2014

Nike shares broke below $40 on Monday, reaching their lowest level since 2014 as investors continued to question the pace and financial cost of the sportswear company’s turnaround.

Nike (NYSE: NKE) fell as much as 3.2% to an intraday low near $39.41. The stock was trading around $39.49 at approximately 11:04 a.m. ET, down 3.1% from Friday’s $40.73 closing price and among the weakest performers in the Dow Jones Industrial Average.

The shares have declined approximately 38% in 2026, more than 5% in August and nearly 78% from their November 2021 record of $179.10.

Historical data indicate that Nike last traded around these levels in late 2014. Monday’s intraday move therefore represents its lowest price in almost 12 years, regardless of whether the shares recover above $40 before the closing bell. A new 12-year closing low, however, will depend on the final price.

Why Is Nike Stock Falling Today?

No new earnings release or major company announcement appeared to trigger Monday’s decline. The move extends an existing selloff tied to weak international demand, Nike’s China restructuring and concerns that its turnaround will take longer than investors previously expected.

The broader market also traded lower, with the Dow falling approximately 0.3% amid rising oil prices and renewed geopolitical tensions. Nike’s considerably larger decline suggests that company-specific concerns remained an additional source of pressure.

One important overhang is JPMorgan’s August 4 downgrade. The bank lowered Nike from Neutral to Underweight and reduced its price target from $47 to $40.

JPMorgan estimated that Nike’s plan to restrict partner-operated online sales in China could create an annual revenue headwind exceeding $1 billion. The bank also expects US store closures to affect North American comparisons into fiscal 2028 and described that year as more likely to be a period of stabilization than renewed growth.

Because the downgrade was issued nearly two weeks before Monday’s decline, it should be treated as part of the continuing bearish backdrop rather than a fresh catalyst. JPMorgan downgrade details

Nike’s Latest Results Show a Mixed Turnaround

Nike’s fiscal fourth-quarter results showed progress in some parts of the business but continued weakness elsewhere.

Revenue declined 1% on a reported basis to $11 billion and fell 4% on a currency-neutral basis. Nike Direct revenue dropped 7%, including a 12% decline in Nike Brand Digital and a 7% decrease at company-owned stores.

Greater China and Europe, the Middle East and Africa remained weak, partially offsetting growth in North America.

Wholesale revenue provided a brighter spot, increasing 4% on a reported basis to $6.6 billion. That improvement suggests Nike’s renewed focus on third-party retail relationships is producing some benefits.

Reported gross margin increased 890 basis points to 49.2%. However, Nike attributed approximately 900 basis points of that improvement to the expected recovery of tariffs imposed under the International Emergency Economic Powers Act. The reported margin increase therefore did not represent a comparable improvement in underlying operations. Nike’s fiscal 2026 results

NKEon Tracks Nike’s Decline

NKEon, Ondo Finance’s tokenized Nike product, was trading near $40.26 and was down approximately 3.2% over 24 hours at the time of review.

Although that price was higher than Nike’s $39.49 NYSE quote, the difference did not represent a bullish premium or delayed reaction. Ondo indicated that each NKEon token represented approximately 1.0191 Nike shares because the product incorporates reinvested dividends.

At an underlying Nike price of $39.49, that ratio implies a value of approximately $40.24 per token—almost identical to NKEon’s displayed price.

CoinMarketCap continued to show NKEon near $41.55 with approximately $360,000 in reported volume. That quote appeared delayed compared with Ondo’s primary market data and should not be used to conclude that NKEon had failed to reflect the equity selloff.

Nike’s break below $40 underscores continuing investor skepticism about its turnaround. However, a low absolute share price does not automatically mean the stock is undervalued. A sustainable recovery will require stronger evidence of improving demand in China, continued wholesale growth and healthier margins excluding one-time benefits.

Snap Stock Slides 4% Amid Renewed Scrutiny of Social Media’s Youth Risks

Snap Inc. shares fell approximately 4% during Monday trading, surrendering part of the rally that followed the company’s stronger-than-expected second-quarter results.

Snap (NYSE: SNAP) traded near $5.19 at approximately 10:50 a.m. ET, compared with Friday’s closing price of $5.41. The shares remained below their August 4 post-earnings close of $5.79. Nasdaq

No new company-specific operational disclosure appeared before Monday’s decline. Renewed attention on youth-addiction litigation may have contributed to negative sentiment around social-media companies, but public information does not establish it as the primary cause of Snap’s selloff.

Appeals Court Allows Broader Litigation to Continue

The Ninth U.S. Circuit Court of Appeals dismissed an attempt by Meta and TikTok parent ByteDance to appeal rulings that allowed more than 3,000 federal lawsuits against major social-media companies to proceed.

The underlying cases include claims against Meta, Alphabet, ByteDance and Snap. Plaintiffs allege that the companies intentionally incorporated addictive design features that harmed younger users.

The appeals court did not determine that Snap or the other companies were liable. It concluded that the appeal was premature, allowing the litigation to continue in the lower court. The judges said Section 230 can provide a defense against liability but does not necessarily create immunity from participating in a lawsuit.

The ruling was reported on August 10, when Snap shares actually rose slightly from $5.33 to $5.35. It should therefore be treated as continuing legal-risk background rather than a newly confirmed catalyst for Monday’s decline.

Meta Trial Creates a Wider Industry Overhang

Investor attention has also shifted to a major trial involving Meta and allegations that Facebook and Instagram were designed to encourage compulsive use among children.

That specific trial concerns Meta not Snap. Nevertheless, its outcome could influence settlement discussions, product-design standards and legal strategies across the broader social-media industry.

Snap remains named in other federal and state cases, meaning litigation expenses, settlements or required product changes are legitimate long-term risks. However, the financial impact remains uncertain, and no court has established Snap’s liability in the federal litigation discussed above.

Q2 Results Showed Significant Improvement

The legal uncertainty comes despite a considerable improvement in Snap’s second-quarter financial performance.

Revenue increased 19% year over year to $1.60 billion, while daily active users reached 493 million and monthly active users rose to 971 million.

Adjusted EBITDA increased from $41 million to approximately $250 million, while free cash flow rose from $24 million to $121 million. Snap still recorded a GAAP net loss of $164 million, although that narrowed from $263 million one year earlier.

The company forecast third-quarter revenue of between $1.70 billion and $1.74 billion, along with adjusted EBITDA of $300 million to $350 million. Snap’s official Q2 results

These results indicate that Snap’s operating performance improved substantially, although the company remains exposed to advertising competition, infrastructure spending, uneven regional engagement and legal uncertainty.

SNAPon Tracks the Underlying Stock Lower

SNAPon, Ondo’s tokenized Snap product, moved lower alongside the NYSE-listed shares.

Ondo displayed SNAPon near $5.18 at the time of review, down approximately 4.6% over 24 hours. That price closely matched the underlying stock.

CoinMarketCap continued to display SNAPon near $5.37 with no available trading volume, indicating that its information had not updated as quickly as Ondo’s primary market data. The absence of reported volume on an aggregator should not be interpreted as proof that no SNAPon transactions occurred.

Snap’s Monday decline therefore reflects a loss of post-earnings momentum amid a weak broader market and renewed scrutiny of social-media legal risks. The litigation remains a genuine overhang, but there is not enough evidence to identify it as the sole or primary cause of the stock’s decline.

REalloys Stock Drops 12% After Earnings Rally as Investors Reassess Losses and Dilution

REalloys shares fell about 12% shortly after Monday’s opening bell, reversing most of the rally that followed the rare-earth company’s second-quarter results.

REalloys (NASDAQ: ALOY) traded near $12.97 after opening around $14.65. The stock had closed Friday at $14.72, up 13.7% from Thursday’s $12.95 closing price, according to Nasdaq historical data.

A review of the company’s public disclosures found no new negative announcement before Monday’s decline. The precise reason for the selloff therefore cannot be confirmed. Profit-taking, the stock’s recent volatility and a reassessment of REalloys’ losses and financing history are possible explanations.

Most of the Quarterly Loss Was Noncash

REalloys generated $804,000 in second-quarter revenue, up from $440,000 in the same period last year. Operating expenses reached $37.61 million, producing an operating loss of $36.80 million and a net loss of $36.82 million.

However, $32.13 million of the quarter’s general and administrative expenses consisted of noncash stock-based compensation associated primarily with equity awards granted during the company’s transition to a Nasdaq-listed business.

Excluding that compensation, REalloys reported adjusted general and administrative expenses of approximately $3.9 million. The company used $8.17 million of cash in operating activities during the quarter and ended June with $122.36 million in cash, according to its second-quarter filing.

At a share price of $12.97, REalloys’ market capitalization was approximately $892 million based on the 68.78 million common shares outstanding at June 30. That valuation remains largely dependent on future rare-earth production because the company currently generates limited commercial revenue.

Private Placement Increased the Share Count

REalloys sold 7.02 million common shares at $14.25 each in June, raising approximately $100 million in gross proceeds and $95.4 million after expenses.

The offering increased the common-share count by approximately 11.4% relative to the roughly 61.8 million shares outstanding immediately before the transaction. At $12.97, ALOY was trading about 9% below the placement price.

The transaction diluted existing shareholders, but it also substantially strengthened the company’s balance sheet. Management said its existing cash is sufficient to fund approximately $58.3 million committed to upgrades at the Saskatchewan Research Council’s rare-earth facility and REalloys’ planned metallization project through commissioning.

The placement’s complete effect should therefore be described as both dilutive and capital-raising—not solely as a source of selling pressure. REalloys financing announcement

Army Project Remains Conditional

REalloys’ proposed project at the Tooele Army Depot in Utah is another central part of its long-term strategy.

The US Army conditionally selected the company for exclusive negotiations over a long-term Enhanced Use Lease. Under the proposed arrangement, REalloys would design, finance, build and operate heavy rare-earth processing facilities at the depot.

The selection is not a completed lease, construction contract or guaranteed source of revenue. A final agreement remains subject to negotiations, environmental reviews and regulatory approvals.

The company said negotiations were scheduled to conclude by mid-September 2026, with initial operating capability targeted no later than 2028. REalloys Army project announcement

ALOYon Tracks the Underlying Shares Lower

REalloys’ Ondo-tokenized stock, ALOYon, also moved lower alongside the Nasdaq-listed shares. Its displayed price and rolling 24-hour return can differ from ALOY’s regular-session percentage change because the measurements use different time periods.

Any liquidity assessment should be made carefully. Ondo identifies the volume displayed under “Underlying Asset Statistics” as trading volume on traditional exchanges such as Nasdaq, rather than token-specific volume. ALOYon liquidity can also vary by blockchain or trading venue. Ondo Finance

For now, no newly disclosed corporate setback explains Monday’s reversal. The pullback followed a sharp post-earnings rally and occurred as investors weighed REalloys’ limited current revenue, continuing losses and dilution against its stronger cash position and planned rare-earth processing projects.

SpaceX $75 Bear Target Opens a $725 Wall Street Gap as SPCXB Trades Near $148

SpaceX has become one of Wall Street’s most sharply divided stocks, with analyst price targets ranging from $75 to $800 despite the company having traded publicly for only about two months.

Phillip Securities initiated coverage of SpaceX with a Sell rating and a $75 target on July 31, according to public analyst-rating records.

The target implies approximately 49% downside from SpaceX’s price of $148.20 shortly after Monday’s opening bell. It is also about 44% below the company’s $135 initial public offering price.

At the opposite end of the range, Morgan Stanley has a $300 target, while Raymond James maintains a Street-high target of $800. The difference between the lowest and highest forecasts is $725 per share, with the bullish estimate exceeding Phillip’s target by more than ten times.

The unusually wide range reflects radically different assumptions about the long-term value of Starlink, Starship and SpaceX’s expanding artificial-intelligence business.

Revenue Growth Comes With Massive AI Spending

SpaceX generated $7.81 billion in second-quarter revenue, an increase of 92% from $4.07 billion a year earlier and above the approximately $6.83 billion expected by analysts.

However, capital expenditures reached $18.37 billion, about 2.35 times quarterly revenue. Of that amount, $15.83 billion, or approximately 86%, was directed toward the AI segment, according to SpaceX’s official earnings release.

The company’s Connectivity division, which includes Starlink, generated $4.29 billion in revenue and $1.66 billion in operating income. By comparison, the Space segment reported a $542 million operating loss, while the AI division lost $1.26 billion.

Those figures illustrate the central conflict in SpaceX’s valuation. Starlink is producing substantial operating profit, but much of the company’s available capital is being directed toward an AI division that remains unprofitable.

One AI Customer Generated Nearly 20% of Revenue

SpaceX also faces customer-concentration risk.

One customer connected to the AI segment accounted for 19.5% of consolidated second-quarter revenue. The same customer generated less than 10% of revenue during the comparable period a year earlier, according to the company’s quarterly SEC filing.

This means a single AI customer produced nearly one-fifth of SpaceX’s total quarterly sales. A reduction or delay in that customer’s spending could materially affect revenue while SpaceX remains committed to billions of dollars in data-center investment.

The concentration does not invalidate the company’s AI growth, but it makes the durability and diversification of that growth particularly important.

SpaceX Rises Ahead of Its Next Share Unlock

SpaceX shares nevertheless advanced approximately 5.9% to $148.20 shortly after Monday’s market open, extending their recovery from an early-August low near $105.

The company is approaching another test of investor demand. Approximately 319 million additional shares are expected to become eligible for trading on August 20, according to Barron’s.

Becoming eligible for trading does not mean all those shares will be sold. However, the increased supply could create volatility if early investors or employees decide to reduce their holdings.

SpaceX’s tokenized bStock, SPCXB, traded near $148.47 at the time of reporting. Because SPCXB trades around the clock through a separate Binance order book, its price and rolling 24-hour return can temporarily differ from the Nasdaq-listed shares.

Why the SpaceX Price Targets Differ So Sharply

The $725 gap between Wall Street’s lowest and highest targets is ultimately a disagreement over how much investors should pay today for businesses that may take years to reach their expected scale.

Phillip’s $75 target represents skepticism that SpaceX’s future growth will justify its enormous capital requirements. Morgan Stanley’s $300 target assigns considerably more value to the company’s integrated space, connectivity and AI operations. Raymond James’ $800 forecast reflects an even more aggressive view of SpaceX as a foundational infrastructure company.

For investors, the question is no longer whether SpaceX can generate rapid revenue growth. The real debate is whether Starlink’s profits and future AI returns can justify the company’s massive spending before customer concentration and additional share unlocks place pressure on the stock.