Home Blog Page 437

Why Bitcoin Investors See the Return of McDonald’s McRib as a Signal for a Market Rebound

0

The McRib is back on McDonald’s menu, and Bitcoin proponents believe it could lead to a BTC rebound, citing historical context. 

Notably, Bitcoin Archive, a popular Bitcoin-focused account on X, called the public’s attention to the timing. The account noted that every time McDonald’s brings back the McRib, Bitcoin’s price tends to surge soon after. 

The McRib is Back on McDonald’s Menu

For the uninitiated, the McRib is a limited-time sandwich made with a restructured boneless pork patty with a rib-like shape, covered in tangy BBQ sauce. Because McDonald’s only offers it occasionally, it has become a nostalgic favorite.

Guillaume Huin, McDonald’s Senior Marketing Director, confirmed on X that the McRib officially returns to most U.S. restaurants on Nov. 11. 

He described it as McDonald’s “most-mentioned limited-time product” online, noting that it attracts more attention than some of the chain’s permanent menu items, especially on X. 

Huin added that, independent of McDonald’s, the McRib has taken on a life of its own within trading and crypto circles. Many traders believe both Bitcoin and the S&P 500 tend to perform well when the sandwich makes its return, something they observed in 2017, 2020, and 2021.

Historical Data Shows Bitcoin Link to the McRib

Historical data reveals why investors have called attention to the timing. For context, the McRib reappeared in the U.S. on Nov. 2, 2017, Dec. 2, 2020, Nov. 1, 2021, and Dec. 3, 2024. 

In 2017, Bitcoin traded at $6,745 when the sandwich returned and climbed to $19,666 by December. For 2020, the McRib came back when Bitcoin traded at $18,773, and the price later hit $64,895 by April 2022, a 245% rise. 

Meanwhile, in 2021, it returned with Bitcoin at $61,000, and just nine days later, Bitcoin hit $69,000, a 13% increase and a new all-time high at the time.

The pattern appeared again in December 2024, when Bitcoin surged to $95,858 following the November 2024 U.S. elections. By October 2025, the coin reached an all-time high of $126,272, marking a 31% jump since that McRib cycle.

Now, Bitcoin trades around $104,345 after touching $107,000 earlier today, as it continues to battle the bears below $110,000. With the McRib’s return, some investors believe the stage could be set for another rebound.

Short-Term Caution

However, some analysts have advised short-term caution. For instance, Michaël van de Poppe, a market strategist, said Bitcoin’s latest pullback looks healthy after a resistance test. 

He believes the next move depends on whether Bitcoin can hold support around $103,000 or $100,000. If it fails, he expects a deeper correction toward $90,000 to $93,000 before the next rally begins.
Grayscale Says Cardano Is Flexible, Scalable, and Now Solid

0

Grayscale Investments has heaped praise on Cardano, emphasizing its growing strength following its debut among the cryptocurrencies featured in the firm’s GDLC ETF.

The Grayscale CoinDesk Crypto 5 ETF (GDLC) commenced trading on the New York Stock Exchange in September. This fund provides U.S. investors with exposure to the performance of five major cryptocurrencies, including Bitcoin, Ethereum, XRP, Solana, and Cardano.

Although shares of the ETF began trading in September, Grayscale recently reiterated that it has “brought GDLC to the real world,” extending the fund beyond the digital asset realm and making it accessible within traditional financial markets.

Fundamentals of GDLC Assets

Grayscale spotlighted the unique fundamentals of the five cryptocurrencies featured in the fund. The firm described Bitcoin as existing “in the physical world,” portrayed Ethereum as “building the future, today,” characterized Solana as “crypto’s financial bazaar, brought to life,” and highlighted XRP for its “real-world utility, made tangible.” Notably, Grayscale referred to Cardano as “flexible, scalable, now solid.”

Cardano’s Attributes

Despite not shedding light on the fundamentals, Cardano is known for its flexibility and support for a wide range of use cases, including decentralized finance and real-world asset (RWA) tokenization initiatives.

Thanks to its proof-of-stake (PoS) consensus mechanism, Cardano’s scalability is not in question. With the PoS algorithm, Cardano processes transactions faster and more efficiently compared to traditional Proof-of-Work systems, like Bitcoin.

For context, Cardano recently reached a significant milestone, recording one million transactions per second (TPS) during testing of its Hydra scaling solution. While it remains uncertain whether Hydra can replicate this performance once deployed on the mainnet, many believe the solution will substantially boost Cardano’s scalability.

Following ADA’s inclusion in the GDLC ETF, Grayscale affirmed that Cardano is now solid, implying that the project is currently more stable and reliable.

Meanwhile, the GDLC currently has a net asset value of $50.70 and a total AUM of $625.51 million. Cardano represents 0.77% of the fund’s overall weighting in the hours leading up to press time. 

Elliott Wave Expert Says There’s an Extremely High Chance XRP Will Hit $30 This Cycle

0

Korean market technician, XForceGlobal, has asserted that XRP still has a very high probability of reaching $30 before the current cycle ends. 

This projection adds another bold forecast to a growing list of predictions expecting a major XRP breakout in the coming months.

XRP Cycle Target Remains $15 to $30

In a tweet, XForceGlobal, who calls himself the first Korean Certified Elliott Wave Analyst, said he still believes XRP is on track to hit $15–$30 this cycle. His confidence is based on a combination of technical analyses, including Elliott Wave structures, and bullish developments surrounding XRP.

With XRP trading in the low $2 range, his target implies a 6x to 12x gain. This ambitious outlook comes as the year draws to a close, with XRP continuing to trade around the same price levels it has maintained for most of 2025.

Many believe XRP may have already exhausted its bullish phase, and the targets XForceGlobal is projecting may be too ambitious for the current timeframe.

Community Reactions

For instance, trader Nico argued that a move to $15–$30 would require a scale of expansion not seen in past cycles. He noted that previous XRP cycle tops produced only 3x–5x gains from similar setups and timeframes.

To Nico, a rally up to $30 is closer to a “moonshot scenario” than a typical cycle target from the current phase.

Meanwhile, trader Justin Oleary questioned the timing rather than the possibility. He asked whether the next major impulse would arrive “in 8 months, years, or decades.”

The comment highlights the frustration across the XRP community amid ongoing stagnant prices. This frustration is also highlighted by analysts like EGRAG, who said traders often confuse pre-breakout compression with weakness.

XRP Could “Melt Faces” in 4–6 Weeks

Meanwhile, XForceGlobal’s bullish call aligns with a cluster of recent optimistic projections from other market analysts.

For instance, EGRAG identified repeating historical setups similar to 2017 and 2021, arguing that XRP is entering a tight compression phase that typically precedes explosive moves. His Fibonacci targets range from $6 to $10 and $37. He believes XRP price breakouts occur quickly, typically within 4 to 6 weeks, suggesting XRP will “melt faces.”

XRP Could Follow Zcash’s 1,775% Surge

Separately, macroeconomist Mikybull recently argued that XRP could mimic Zcash’s extraordinary 18x rally, placing conservative short-term XRP targets at $8–$10.

Adding to the bullish outlook, analyst Matt Hughes revealed that XRP has built its first-ever multi-quarter base above the 3-month Ichimoku Cloud’s key trend lines.

No previous cycle — not 2017, not 2021 — produced this formation. Hughes called it one of the strongest long-term structures XRP has ever displayed. His earlier Fibonacci checkpoints include $4.70–$9.30 and $12.30.

After Hitting Support, Cardano Struggles to Break $0.5867 Fibonacci Resistance

Cardano is showing positive momentum in the past hour as DeFi TVL surges, despite technical indicators suggesting a potential pullback to $0.50.

Notably, Cardano’s price stands at $0.5798, experiencing a slight 0.7% rise in the last one hour. However, the price of ADA is $0.5784, reflecting a 3.3% decline over the last 24 hours.

The price has fluctuated between $0.57 and $0.60 in this time frame, showing moderate volatility. On the longer timeframe, Cardano is up 7.7% in the past seven days.

Cardano Price Analysis

Amid the decline in the past 24 hours, Cardano looks poised for a decline, particularly based on technical indicators. On the daily chart, the price already bounced off a critical support level at $0.4907, marked by the 0% Fibonacci retracement level, and hit around November 4.

Cardano
Cardano

After hitting this support, the price has then tested resistance at the 23.6% Fibonacci level at $0.5867, and is struggling to break above it. 

Elsewhere, the Stochastic RSI at the bottom of the chart indicates the momentum of ADA’s price. Currently, the Stochastic RSI is showing an overbought condition with values around 91.17 for the %K line and 83.92 for the %D line.

When the Stochastic RSI pumps above 80, it shows that the asset is overbought and may be due for a price correction. In this case, ADA’s overbought condition suggests that the price could face further downward pressure or consolidate before making a decisive move.

If the price continues to struggle at the 23.6% resistance, it could signal further bearish momentum, with the market potentially moving lower towards the 0% level at $0.49068. Alternatively, a breakout above the 23.6% Fibonacci level might lead to a shift in sentiment. The bulls could attempt to push the price higher, testing the next resistance zones around 38.2% or 50% Fibonacci levels. This could see ADA’s price surge to $0.6461 or $0.6941, respectively.

Cardano Derivatives Data 

The liquidation data for Cardano (ADA) reveals significant short-term volatility, with long positions bearing the brunt of recent liquidations. Over the past 1-hour, 4-hour, 12-hour, and 24-hour periods, the majority of liquidations have come from long positions.

For example, in the last 24 hours, $959.13K worth of long positions were liquidated, compared to $560.15K in short positions. This suggests that the price has likely moved against long traders, triggering forced exits. Although short liquidations have also occurred, they have been relatively smaller.

Cardano DeFi TVL Surges

Despite the bearish outlook in the price action, Cardano’s DeFi total value locked has experienced a surge, according to a recent report by The Crypto Basic. In Q3 2025, Cardano saw significant growth, with its DeFi TVL surging by 28.7% to $423.5 million, highest since 2022. 

Further, ADA’s market capitalization pumped by 42.5% to over $29 billion, while the network’s treasury grew by 24.7% to $1.3 billion. Additionally, Cardano saw a 561.7% rise in NFT trading volume and a 21.5% increase in stablecoin market capitalization. The network also saw growth in app transactions, daily active addresses, and DEX volume. 

Ultimately, despite short-term price pressures and overbought conditions, Cardano’s growth in DeFi, market cap, and network adoption suggests a solid foundation for long-term success. Its ability to maintain momentum and innovate can likely determine its price trajectory in the upcoming trading periods.

Can Solana Break $171 Despite Stiff Resistance?

Solana is attempting to recover again, and Fibonacci levels show the possibility of a leg up, approaching the $171 level.

As of November 11, Solana (SOL) is trading at $164, a clear pullback after peaking just above $170 around November 10. In the past week, the price has seen a net gain of 4% despite choppy volatility, amid market correlations with Bitcoin’s dips. With the bearish bias still in place, will Solana defy the resistance or drop further?  

Can Solana Break Past $171?

Looking at the daily chart, Solana is in a consolidation phase and could be setting up for either a potential reversal or continuation of the downtrend. The 0.236 Fibonacci level, set above $189 on the daily chart, represents the initial resistance, indicating that Solana has struggled to break above this level. 

The next important level to watch is the 0.618 Fibonacci level at $163.59. At the time of this writing, the price is hovering just above this point. If Solana finds support at this level, it may reverse higher and retest key resistance levels.

Solana
Solana

The Relative Strength Index (RSI) on the chart is currently at 40.28, signaling that Solana is in the oversold region, just below the neutral level of 50. This suggests weakening momentum. As the price approaches the critical support zones, the RSI will be crucial in determining whether Solana can stage a recovery.

If the price holds the $163.98 support, it may begin to bounce and challenge the $171.56 resistance. However, if the price breaks below this support, it could fall further to the $152.26 region.

Market Analysts Share Thoughts

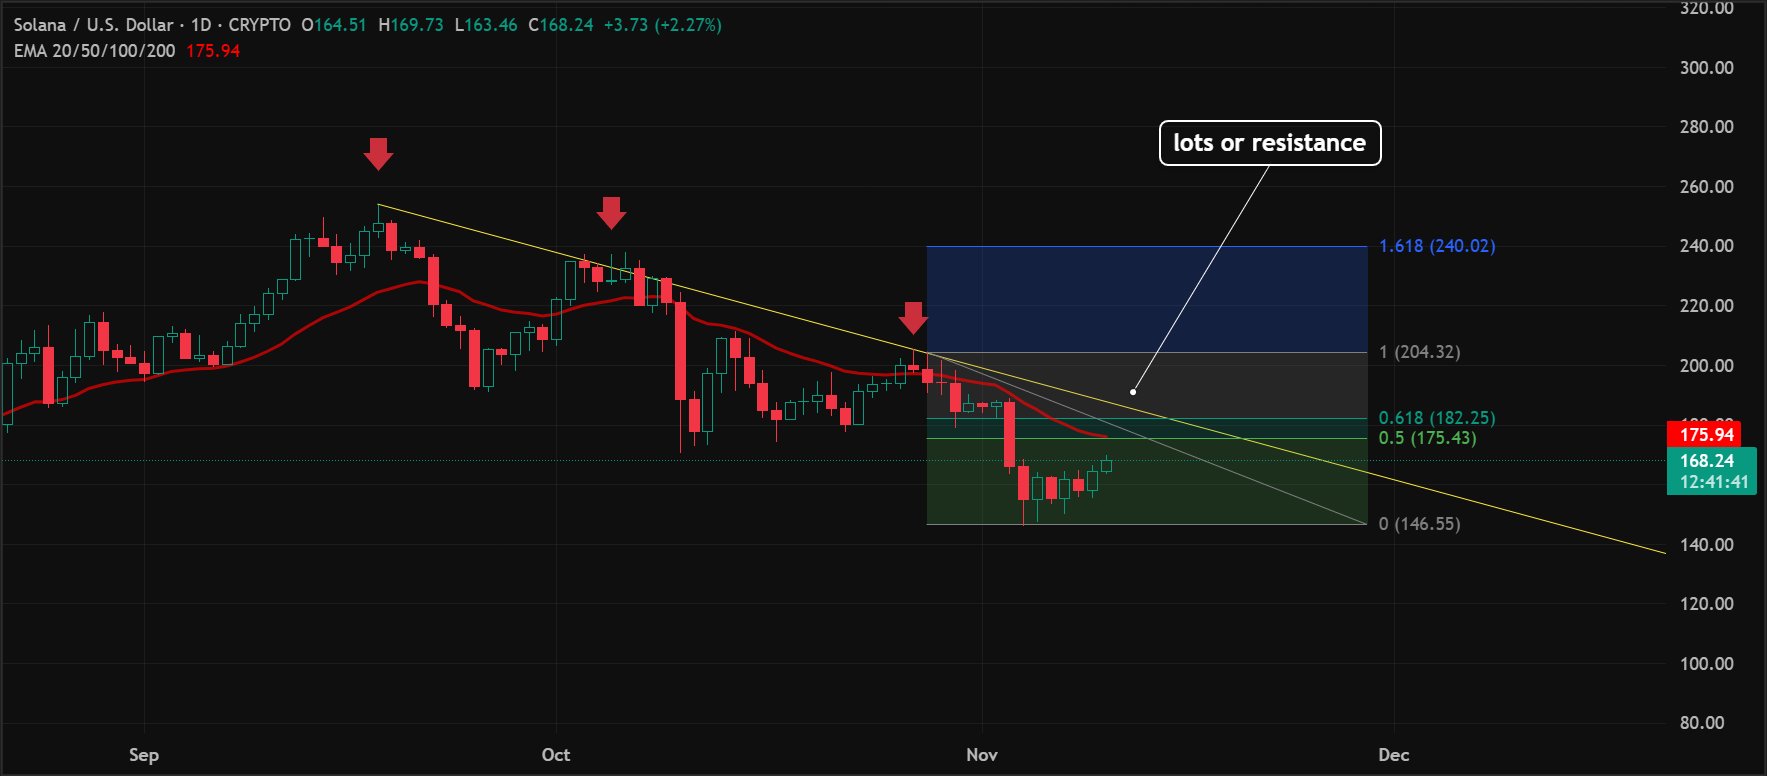
Elsewhere, Lark Davis, a well-known crypto analyst, recently shared his thoughts on Solana’s current price action, emphasizing the mounting resistance the asset faces. Davis specifically mentions how SOL is facing a wall of resistance. 

In his post, shared on X, he points out that the convergence of the daily 20 EMA and a downward trendline at key Fibonacci levels, specifically the 0.5 and 0.618 levels, reinforces this resistance zone. 

Davis further explains that this area will be crucial in determining Solana’s next move, stating, “This area decides the next leg.” 

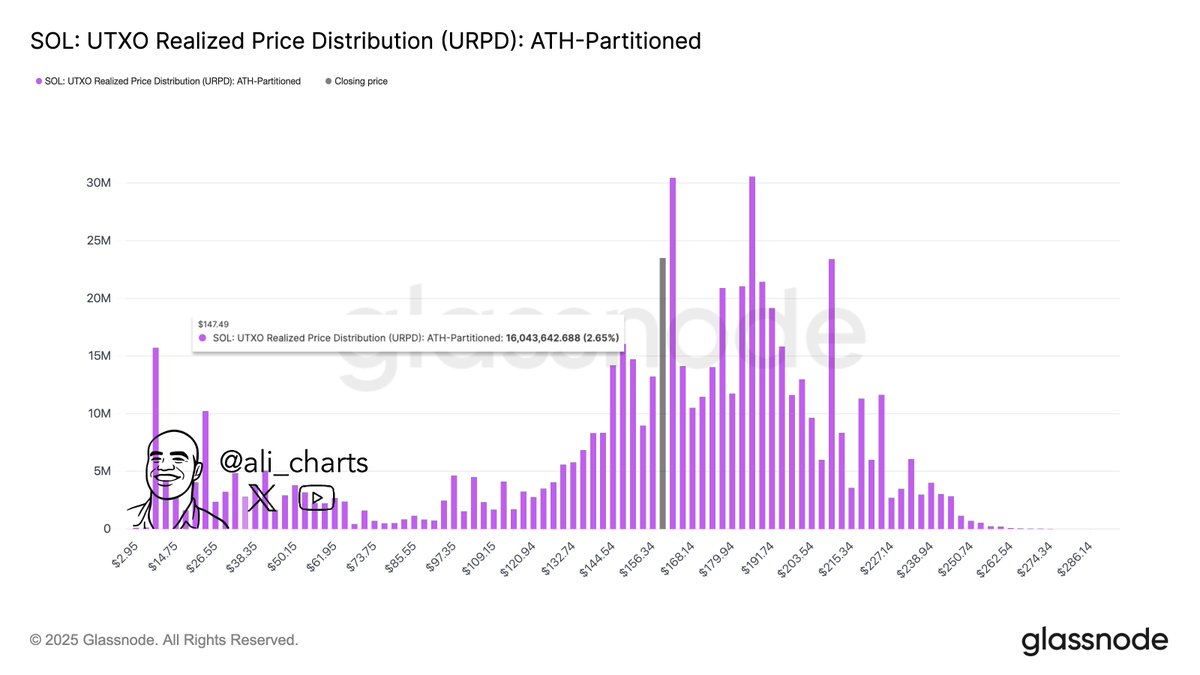
Ali Martinez, another prominent analyst, believes the key support level for Solana is at $147.49. His analysis is based on the UTXO Realized Price Distribution (URPD). 

It shows that the highest concentration of realized prices for Solana is near this level. Martinez’s view is that if Solana’s price were to drop to this region, it could find strong support.

Dave W Says XRP Could See Huge Gains, But $1,000 Price Calls Are “Absurd”

0

Dave Weisberger, former chairman of CoinRoutes, has shared his insights on the ongoing debate between Bitcoin (BTC) and XRP.

Notably, he explained the strengths and weaknesses of both assets and addressed what he believes are common misconceptions, especially regarding XRP’s price potential.

Weisberger acknowledged that XRP could grow in the future but highlighted key differences between it and Bitcoin. Specifically, he said Bitcoin holds a unique place in the digital economy and could still increase in value by up to 10 times, while XRP’s usefulness may not be enough to push its price to extremely high levels.

Bitcoin’s Role as “Sound Money”

Weisberger first reiterated Bitcoin’s core value proposition as sound money. He described it as a digital version of gold, especially relevant after the end of the gold standard in 1971. According to him, Bitcoin provides greater security and transparency than gold because it’s decentralized.

“Bitcoin is provably scarce,” Weisberger said, emphasizing its fixed and transparent supply. Also, its global network of nodes keeps it secure, reliable, and consistently operational, more so than any other blockchain.

He also pointed to Bitcoin’s growing strength, noting the rise in exahashes as proof of the network’s expansion. Despite short-term price fluctuations, Weisberger believes Bitcoin still has huge upside potential. If its network keeps growing, he believes Bitcoin could eventually reach a point where its market cap surpasses gold’s.

The XRP Valuation Dilemma

Meanwhile, for XRP, Weisberger acknowledges its utility in the financial world, particularly with Ripple’s strategic focus on prime brokerage. He suggests that XRP could see substantial growth from its current levels.

However, he cautions against unrealistic price predictions, particularly the notion that XRP could ever approach Bitcoin’s price point.

“There are literally 5,000 times more XRP tokens than Bitcoin,” Weisberger pointed out. “If you’re talking about XRP approaching Bitcoin, then $21 is what you’re expecting, not $1,000. People calling for a $1,000 XRP are clearly innumerate or just don’t understand math.”

For context, a $21 price gives XRP a $1.2 trillion valuation, while a $1,000 price implies a $60 trillion valuation. To Weisberger, a $60 trillion outlook is unrealistic for a coin whose future value lies more in its utility within Ripple’s ecosystem.

“Ripple Will Switch Networks if XRP Spikes Too Much”

He argues that Ripple’s business model involves leveraging XRP on its balance sheet for prime brokerage and hinges on the token’s ability to remain stable and operational, rather than experiencing sudden spikes in value.

“If the price of XRP goes up too much, they’ll be forced to switch networks,” Weisberger said. “They won’t subsidize it for long, even though it would make their balance sheet look more impressive in the short term.”

XRP Is a Profitable Investment

Ultimately, Weisberger remains bullish on Bitcoin, expecting major gains if it continues its current growth path. Meanwhile, he views XRP as a profitable investment but with serious caveats.

He believes there’s a real use case for XRP within Ripple’s business model, but said its price is not driven by the same factors that fuel Bitcoin’s growth.

Industry Reaction

Responding to Weisberger’s analysis, Jake Claver, CEO of Digital Ascension Group, said he agreed with nearly all of Weisberger’s points except for the math behind XRP reaching a four- or five-digit price. Notably, Claver is among those who believe XRP could reach $10,000 price.

Meanwhile, in response to him, Weisberger insists that the math doesn’t add up because a four-digit XRP price would imply a total valuation exceeding the entire market capitalization of the global financial system, which he called unrealistic for an asset supporting a commoditized network.

Here’s What Could Drive XRP Toward $15–$20 Before the Market Structure Bill Passes

0

An XRP community pundit has identified factors that could boost XRP’s price before legal clarity arrives in the U.S.

Notably, the XRP community is preparing for what could be an important month as several issuers seek to launch spot XRP exchange-traded funds (ETFs). Firms such as Canary Capital, Franklin Templeton, and Bitwise have all updated their S-1 filings, aiming to go live this November.

The build-up has led to speculation around how the XRP price could react. Amid the anticipation, market commentator the5blairs recently asked XRP holders to stay alert this month, claiming that prices could spike once the ETFs roll out. 

He pointed out that while a fast rally is possible, XRP might trade sideways until lawmakers in Washington finalize the long-awaited Market Structure Bill. For context, the legislation will finally define how the U.S. regulates digital assets.

Crypto Awaits the Market Structure Bill

Notably, the Market Structure Bill aims to set clear boundaries between the Securities and Exchange Commission (SEC) and the Commodity Futures Trading Commission (CFTC).

The bill draws from several important proposals, including the House-passed CLARITY Act and the Senate’s ongoing Responsible Financial Innovation Act (RFIA). Together, they plan to clarify which digital assets fall under securities or commodities law.

There has been some observable progress over the past few weeks. In October, top crypto executives met with senators to address stalled negotiations. Senate Banking Chair Tim Scott has pushed to move the bill forward before Thanksgiving, while Democrats called for more bipartisan input. 

Meanwhile, the Senate Agriculture Committee has introduced a new draft that states the CFTC’s role in crypto oversight. Importantly, the move has brought lawmakers closer to merging the House and Senate versions.

At the moment, the CLARITY Act has already cleared the House and now awaits Senate approval. Senators are working to merge different drafts of the RFIA and DeFi-related bills, though differences among lawmakers could delay final passage. 

XRP ETF Inflows Could Push XRP to $15-$20

While market commentators believe the bill could contribute to a market uptrend, the5blairs argues that XRP ETFs may already push XRP price forward before Congress passes the legislation.

Notably, back in August, Canary Capital CEO Steven McClurg predicted that these ETFs could attract about $5 billion in inflows during their first month, outpacing Ethereum ETFs. However, last month, he raised that target to $10 billion, saying his earlier projection had been too conservative.

Building on this, the5blairs said that if XRP ETFs attract between $5 billion and $10 billion in new capital, XRP could climb quickly toward the $10 to $20 range. He expects a brief pause near $10 as traders take profits before prices settle around $15 to $20, where they could stay until the U.S. finalizes crypto regulations.

Possible Impact of the Reverse Carry Trade

Meanwhile, he also admitted he’s still unsure how the upcoming Reverse Carry Trade (RCT) unwind could impact XRP, noting that Jake Claver could address that better. Notably, Claver, who is CEO of Digital Ascension Group, has persistently discussed this phenomenon, arguing that XRP could benefit.

In September, he predicted that a rise in oil prices would push Japan to raise interest rates, triggering a large-scale unwinding of the RCT. He believes XRP could serve as a hedge in that kind of market reset.

Speaking further, the5blairs added that if major global institutions, including the Bank for International Settlements (BIS), International Monetary Fund (IMF), Depository Trust & Clearing Corporation (DTCC), global FX networks, the FedNow system, and central banks,  adopt XRP at scale, the XRP price could reach long-term valuations in the high four- to low five-digit range.

Analyst Identifies Key Levels Shiba Inu Must Hold for Major Rebound

0

Shiba Inu (SHIB) stages a short-term rebound amid its multi-month consolidation phase, fueling hopes of a major rally.

Following Bitcoin’s latest rally above $107,000 on Tuesday, SHIB and several altcoins recovered nicely to regain mild momentum.

As several SHIB holders anticipate a full-blown bull run, market commentator James Waynn has identified some key factors and support levels the meme token must hold for further upside.

Shiba Inu Key Support Levels

Shiba Inu price has been on a decline since hitting $0.00003 in December 2024, fueled by the broader bearish state of the crypto market. Specifically, the meme token has declined by nearly 29% over the past 90 days, recording a modest 52% year-to-date decrease.

However, in a Tuesday X post, Waynn called attention to SHIB’s latest price recovery. The token rebounded above the $0.00001 level after having dipped to $0.000008432 on November 4.

Specifically, SHIB rallied to a high at $0.00001032 on November 7 before retracing to $0.000009864 at the time of writing. This translates to a 9.73% gain in SHIB price in the past 7 days.

According to Waynn, buyers must hold the $0.000008 – $0.00009 support level for any further upside in SHIB’s price. Conversely, losing this crucial level could push the SHIB price to fall below $0.000007, a level last seen in October.

Notably, Waynn shared an even higher projection for SHIB in a separate update. As earlier reported, he predicted that Shiba Inu could hit $0.10 and make new millionaires. However, this is a multi-decade price outlook according to analyses from prediction platforms like Telegaon.

Shibarium Development and Ecosystem Growth

Beyond technical indicators, the widely followed analyst highlighted a few factors that could contribute to a positive SHIB price action in Q4 2025. According to him, positive Shibarium development and ecosystem growth could propel SHIB’s price higher.

Recall that the Shibarium bridge was exploited in August, resulting in hackers draining over $3 million from the project’s ecosystem. This development had an adverse impact on the price of Shiba Inu ecosystem tokens, including SHIB, Bone Shibaswap (BONE), and BAD.

Despite reopening the Shibarium bridge in October, hack victims still face a delay in repayment. Notably, K9 Finance had previously offered 20 ETH to the hacker in exchange for returning the stolen KNINE tokens. However, the exploiter declined the offer.

Top Singer Sparks Debate With New Poll Pitting XRP Against Cardano

0

Popular singer and Web3 marketer Coki Ramirez has sparked a community debate after posting a crypto poll, pitting XRP against Cardano. 

Ramirez, who boasts over 1 million X followers, has been comparing major cryptocurrencies in her posts to gauge fan preferences. The trend began on October 14, 2025, when Coki first asked her followers to highlight which token crypto they prefer between Bitcoin and Ethereum. 

The popular singer subsequently compared Ethereum with Solana, BNB with Solana, and XRP with BNB. In her latest post, she asked her followers to choose between XRP and Cardano. 

The poll has since garnered nearly 1,000 likes and over 60 comments, as fans debate which token they prefer. Notably, some users disclosed that they prefer both as investment opportunities. 

ADA and XRP Compared 

Notably, both Cardano and XRP offer distinct features for Web3 users. While XRP is recognized for its utility in cross-border payments and liquidity, Cardano has earned a reputation for smart contracts and decentralized applications. 

Currently, XRP outperforms Cardano in the global cryptocurrency ranking. While XRP sits as the fourth-largest token with a market cap of $146.86 billion, Cardano ranks in tenth place with $20.67 billion valuation. 

From Enemies to Partners  

Between 2022 and 2023, the communities for XRP and Cardano clashed over the theory that Ethereum insiders influenced the U.S. SEC to target Ripple and XRP. Cardano founder Charles Hoskinson repeatedly dismissed these claims as baseless conspiracy theories. 

In response, some members of the XRP community accused Hoskinson of hypocrisy and even fraud for allegedly covering up corruption related to Ethereum. This dispute led to a longstanding disagreement between XRP and Cardano community members. 

Interestingly, Hoskinson settled the clash last year following Donald Trump’s reelection, aiming to foster unity within the broader crypto community. His peace offerings included allowing XRP supporters to participate in the Midnight airdrop, integrating XRP support into Cardano’s light wallet, Lace, and exploring ways to introduce DeFi opportunities for XRP holders. 

Moreover, Hoskinson said he has discussed with Ripple executives about the possibility of launching the company’s stablecoin, RLUSD, on Cardano. While the integration is yet to happen, Hoskinson remains confident that RLUSD will launch on Cardano. 

Shiba Inu Price Faces Key Resistance Levels, but Analyst Predicts 94% Surge After Breakout

0

The Shiba Inu price remains under pressure as it tests descending trendlines, but a potential breakout up to 94% could signal a bullish shift.

According to a TradingView chart shared by crypto analyst MMBT Trader, Shiba Inu has been facing repeated rejections at two descending trendlines, with prices struggling to break through these key levels.

However, MMBT Trader noted a potential for an upside breakout, which could lead to a shift toward a bullish trend if key resistance is breached.

Shiba inu current market structure
Shiba Inu’s current market structure

Notably, Shiba Inu trades at 0.000009946, representing a 1% decline over the past day and month. Despite an 11% surge in the last week, the memecoin has been on a downward slope, recording a 61% decline in the past year. 

Shiba Inu Faces Resistance at Two Trendlines

As observed on the SHIBUSDT chart, the price has been undergoing a significant correction, consistently hitting resistance at two descending trendlines. Shiba Inu first broke below the second trendline in late January when it collapsed below $0.00002043. Since then, it has persistently attempted to break back above the trendline.

However, each time the price approached these trendlines, a sell-off occurred due to the rejections. On May 12, Shiba Inu approached the trendline, but faced rejection at $0.00001767. In July and September, it also faced resistance at 0.00001579 and 0.00001414, respectively.

Notably, MMBT Trader noted that the immediate resistance is the first, which now sits at $0.00001270 and has repeatedly rejected upward price movements. The second, higher trendline, at $0.00001933, remains a significant obstacle that the price has yet to test in recent times. 

Potential for Upside Breakout

Despite the ongoing downtrend, MMBT Trader’s analysis suggests that SHIBUSDT could be on the verge of an upside breakout. The first step in this scenario would be a decisive break above the first trendline. For Shiba Inu to reach this resistance level, currently at $0.00001270, it will require a 27.69% increase from the current price level.

According to the analyst, once SHIBUSDT reaches the second trendline, a consolidation period may follow. This period would allow the market to digest the breakout and solidify the price action.

Following this consolidation, a breakout above the second trendline at $0.00001933 could trigger a significantly stronger bullish trend, potentially leading to a sustained upward movement. Notably, it would take a 94.3% surge from the current level to reach this second trendline. 

Analysts Predict Shiba Inu’s Move

Notably, a prominent Shiba Inu trader, Shib Knight, highlighted a bullish outlook, showing the token’s gradual accumulation and the formation of a symmetrical triangle pattern. This technical formation suggests that SHIB is nearing a breakout from its current low range, which could propel it to higher prices.

Image

Meanwhile, predicting the next move for the token, Javon Marks earlier suggested that SHIB has likely broken out of a crucial accumulation phase, with a potential 200% move. This could push the price back towards resistance levels around $0.000032. Also, Marks earlier forecasted this level in July. 

Additionally, MMBT Trader, while predicting the token’s move in September, noted a massive gain, with three profit-taking targets identified. These include 164.8%, 236%, and 460% rallies from the $0.00001 and $0.000006 support levels.