Home Blog Page 436

Chainlink Eyes Next Critical Resistance at $16.38 But This Analyst Targets $100

Chainlink (LINK) eyes key resistance at $16.38, with analysts predicting a potential breakout despite short-term decline.

The Chainlink price seems to have found some support at $15.24, after declining from $16.36, the high attained yesterday. During this writing, LINK is trading at around $15.42, down 4.4% in the past 24 hours.

Although the crypto has seen positive movement in the 7-day timeframe, the 14-day and monthly timeframes are in the red zone. Specifically, LINK has gained 3.7% in the last seven days but lost 1.7% in the past two weeks. With these fluctuations, will Chainlink defy the bears and surge upwards?

Chainlink Price Analysis

Looking at the technical charts, the 1-day chart shows Fibonacci retracement levels drawn from the most recent significant swing high to swing low. The key retracement levels indicate important support and resistance zones. Notably, the 0.236 Fibonacci retracement at $14.974 has acted as immediate support, with $15.753 at the 0.382 Fibonacci level providing minor resistance. 

Chainlink 1D Chart
Chainlink 1D Chart

Notably, the 0.50 Fibonacci level at $16.384 is a critical pivot point, and if the price manages to break above this, it may indicate a potential upward move. The 0.618 and 0.786 Fibonacci levels at $17.014 and $17.910 represent further resistance. A break above these levels could open the door to a reversal toward previous highs.

Meanwhile, the Relative Strength Index currently sits at 41.00, indicating a slight bearish sentiment, as the index is below the neutral level of 50. While the RSI is not in oversold territory yet, it suggests that the recent price action has been driven by selling pressure. The RSI also shows a slight upward divergence from mid-October to mid-November, which could prove weakening bearish momentum.

What Analysts Think

Importantly, the overall sentiment among analysts remains mixed. For instance, analyst Ali Martinez suggests that the price range between $13 and $26 is a “no-trade zone” for Chainlink (LINK). This shows that no significant trades should be made within this range. 

Image

According to Martinez, the next major price movement for Chainlink will occur once the price breaks out of this range, either upward or downward.

Elsewhere, Investor Jordan is bullish on Chainlink (LINK), expressing strong confidence in its future potential. He highlights how he has previously stated his belief that LINK is a “monster in the making,” and maintains this view. 

He mentions that it wouldn’t surprise him to see Chainlink trading above $100 before the end of the year. Notably, this would represent an over 500% increase from the current price.
Expert Says Telling XRP Won’t Hit $100 This Year Feels Like Telling Kids Santa Isn’t Real

0

Prominent XRP commentator Zach Rector stirred discussion in the community after sharing his take on XRP price trajectory for this year.

In a Tuesday post on X, Rector argued that telling XRP holders the price cannot reach $100 this year is similar to telling a child that Santa isn’t real.

According to Rector, XRP remains well-positioned for solid appreciation before year-end —even if triple-digit dreams may seem out of reach for now amid the market lull.

He emphasized that XRP’s performance this cycle has already outpaced many altcoins, several of which continue to lag. This view is supported by the fact that XRP boasts a year-to-date gain of 290%. At the same time, many other cryptocurrencies remain in the red.

Meanwhile, at press time, XRP is trading around $2.40, reflecting a substantial 26.52% loss over the last 90 days. This short-term performance has been frustrating for holders, but commentators like Rector often point to the yearly performance to argue for a more favorable outlook.

While many traders remain optimistic that the next leg of the bull run could push XRP price to new highs, the triple-digit prediction has raised significant eyebrows.

Community Reactions

Many commentators on the post argued that while triple-digit expectations may be unrealistic in the short term, XRP still has room to appreciate significantly. One user suggested that a move to the $8–$10 range by year-end, and possibly up to $14 over the cycle, would be a reasonable outlook.

Others responded with humor. Chris Coope asked whether Rector was really saying “Santa isn’t real,” since a 4,000% surge to $100 in the next six weeks is highly unlikely.

Similarly, X user Crypto Dog dismissed the $100 year-end prediction, emphasizing that XRP’s true strength lies in its utility rather than hype. He suggested that the groundwork being laid now could pave the way for much higher valuations in the coming years.

Meanwhile, X user MG argued that no one truly knows XRP’s ceiling, pointing to potential influences like major bank partnerships that could dramatically affect its value.

XRP community reactions

“$100 XRP May Happen in 2026”

Interestingly, X user “ED” forecasted that while $100 this year may be unlikely, the target could still be achievable by 2026 as XRP becomes more entrenched in banking systems. He added that traditional crypto “cycles” may no longer apply to XRP’s unique position in financial infrastructure.

From a regulatory perspective, Calogero noted that the pace of regulatory developments should temper optimism. He explained that even with the passage of new market infrastructure laws, implementation would take several months, delaying the full impact on XRP’s adoption and price.

Ultimately, while most agree that $100 this year is improbable, the overall sentiment remains positive. Widely cited projections from Telegaon and Changelly suggest it could take XRP a decade to reach $100.

Top Whale Invests $8.14 Million in ASTER, Gains $1.1 Million Within Days

0

Crypto whale identified by the wallet tag ‘ThisWillMakeYouLoveAgain’ has made a bold move into ASTER, the native token of the CZ-backed DEX Aster.

According to the blockchain tracking platform Lookonchain, the investor acquired 8.41 million ASTER tokens over the course of a week.

In doing so, he spent around $8.14 million at an average price of $0.97. The whale’s position is already showing an unrealized gain of $1.1 million.

Whale’s Past Success

Notably, the whale’s most recent significant transaction occurred on November 4, when he deposited 4.21 million USDT into Aster DEX. He then used the funds to acquire 4.6 million ASTER at $0.915 per token, as reported by Lookonchain.

It is worth mentioning that this investor previously earned over $36.21 million in profit from trading the PEPE memecoin. That achievement solidified his reputation for spotting lucrative opportunities early.

CZ Involvement Triggers Market Buzz

The buying spree came shortly after Binance’s Changpeng Zhao, CZ, publicly disclosed that he had purchased $2 million worth of ASTER. His announcement on X immediately fueled excitement, driving the token price up by more than 30% to a peak of $1.20.

However, the rally was short-lived. The token soon corrected, falling to $0.8388 before recovering as broader market sentiment stabilized.

As of this writing, ASTER is trading at $1.14, reflecting a 3.33% increase in the past 24 hours and an 11% gain over the past week. The token’s market capitalization now stands at $2.31 billion, making it the 44th largest cryptocurrency in the world.

The sharp market reaction to CZ’s ASTER announcement prompted him to clarify that he would no longer share details of his personal trades. The move, he said, aims to prevent any unintended influence on market sentiment or investor behavior.

The former Binance CEO’s support for Aster DEX has nonetheless played a crucial role in boosting its visibility since launch, helping it gain traction among traders seeking on-chain perpetual trading platforms.

ASTER Rapid Rise Since Launch

Since its launch on September 17, 2025, Aster DEX has emerged as one of the most talked-about decentralized trading projects in the digital asset ecosystem.

The token debuted at a token generation event (TGE) price of just $0.02 and quickly gained momentum following CZ’s endorsement. Within a week, ASTER reached an all-time high of $2.42 on September 24, 2025, a staggering 10,000% surge from its initial price.

BitGo, Which Activated the Evernorth Wallet, Now Creating Thousands of XRP Wallets a Day

0

Over the past several days, the BitGo Initialization Wallet, which activated the Evernorth address, has exhibited unusual on-chain activity. 

Data shows that this wallet continuously created and activated multiple new addresses, each funded with exactly 1.2225 XRP. Notably, this amount served as the reserve requirement, leaving each new address with a balance of zero.

BitGo Creating Thousands of XRP Wallets a Day

Investigations revealed that this behavior occurred relentlessly for days, with the BitGo-linked wallet creating between eight and twelve new wallets every minute, nonstop, for several days. 

This activity resulted in the creation of thousands of new XRP Ledger (XRPL) wallets daily. The process continued until Nov. 11, when the wallet depleted its available XRP balance. The final successful transaction in this sequence was recorded at 14:03 UTC on Nov. 11.

Although the script responsible for the pattern kept running, the wallet no longer had enough XRP to activate new addresses. As a result, each new attempt to create a wallet began returning failed transactions. Nonetheless, the script continued to send these activation requests until 14:29 UTC on Nov. 11, even though none of them succeeded.

Vet, a validator on the XRPL’s default Unique Node List (dUNL), first called the community’s attention to the anomaly on Nov. 7. In a public disclosure, Vet noted that BitGo had been activating thousands of XRP accounts in bulk over several days. The validator also observed unusual spikes in certain transaction types on the network.

A Spike in Major XRPL Metrics

Specifically, this series of actions noticeably impacted key XRP Ledger metrics, according to data from XRPScan. For instance, the number of AccountSet transactions, which typically averages around 300 per day, surged dramatically to 14,859 on Nov. 2.

XRPL Account Set XRP Scan
XRPL Account Set | XRP Scan

It later fell to 3,466 two days afterward before climbing again to 40,333 on Nov. 6, marking the highest daily count since July 2014. After this peak, the metric briefly dropped but rose once more to 26,105 on Nov. 11.

Similarly, the number of newly created and activated accounts, which usually averages 4,300 per day, rose sharply to 11,242 on Nov. 2. The number then dipped back to average levels before spiking again to 13,300 on Nov. 11, the largest daily increase since January of this year.

New XRPL Accounts Created XRP Scan
New XRPL Accounts Created | XRP Scan

What Exactly Happened?

In a follow-up post, Vet shared that the situation appeared to come from a faulty BitGo script. According to the validator, BitGo’s system had entered an endless loop that continued to attempt wallet activations even after the main wallet’s XRP balance was drained. This issue led to a flood of failed transactions on the XRPL after 14:03 on Nov. 11.

BitGo acknowledged the report, noting that its team had already begun investigating the cause. Nonetheless, as of press time, BitGo has not responded to requests from The Crypto Basic for further comment regarding the incident.

Meanwhile, the XRPScan team explained that BitGo has a history of pre-funding new accounts in bulk as part of its operational process. However, it noted that the firm typically manages accounts for institutional clients rather than retail users.

XRPScan also pointed to a past occurrence in November 2019, when the XRP reserve fee was 20 XRP instead of the current 1 XRP. 

At that time, network participants observed that BitGo had been activating multiple accounts funded with 25 XRP each. XRPScan clarified at the time that the activity represented a standard BitGo procedure for pre-seeding accounts to assign them to customers from a pool of newly created addresses.

Expert Says Dogecoin is Ready for Historic 2,725% Rally, Shares Targets

0

Historical patterns suggest that Dogecoin (DOGE) may be positioning for a major rally, with a popular expert setting price targets as high as $5.

This bullish projection adds another ambitious forecast to a growing list of Dogecoin predictions, which expect a major breakout for the largest memecoin by market capitalization.

Analyst Predicts Dogecoin To Hit $2 and $5

Crypto Patel recently shared his bullish expectations for DOGE on X, suggesting that the memecoin could be gearing up for a parabolic price action to unprecedented targets.

Basing his projections on a fractal confluence and high-timeframe breakout structure, he expects the DOGE price to hit $2 and $5 this cycle. These targets represent an increase of about 1,030% and 2,725% from its price of $0.177 at the time of the update.

The chart shared in the Tuesday post shows that DOGE has been trading in a descending triangle since hitting its all-time high of $0.75 in 2021. Following the Trump-led crypto market boom late last year, DOGE staged a breakout from the triangle in December 2024 and rallied above $0.48.

In recent months, it retested the trendline of the triangle amid dipping prices. Following the successful breakout and retest play, Crypto Patel expects the dog-themed token to stage another exponential rally.

Image

DOGE Repeated Price Action

The breakout pattern identified by the widely-followed crypto analyst played out in 2017 and 2021. Specifically, DOGE jumped from around $0.00022 in 2017 to peak at $0.019 upon breaking out and retesting the descending triangle’s upper trendline. This translated to a price increase of over 9,812%.

In a similar pattern formation in 2021, the leading memecoin staged a 32,425% rally as its price rose from around $0.0025 to $0.75. With DOGE successfully breaking out and retesting the upper trendline of a similar descending triangle, Crypto Patel expects history to repeat itself.

Trader Tadrigrade has also shared a close price expectation for DOGE, having seen similarities between the current price action and Dogecoin’s first bull run.

First Ever XRP Spot ETF Gets Approval, Here is Timeline to Launch

0

The long-awaited spot XRP ETFs are set to begin trading in the United States after the issuer completed the final regulatory step required for its exchange listing. 

Canary Capital has filed a Form 8-A for its spot XRP ETF, which will become effective once approved by Nasdaq. The latest filing comes weeks after the asset manager amended its S-1 application by removing the “delay” clause, which typically prevents the fund from launching without approval from the SEC’s Division of Corporation Finance. 

Launch Timeline for Canary Capital XRP ETF 

Yesterday, Canary filed a Form 8-A application for its spot XRP ETF, marking a crucial step toward bringing the fund to market. According to crypto journalist Eleanor Terrett, this filing marks the final step before the ETF becomes effective. It paves the way for its shares to be listed on Nasdaq. 

Terrett noted that Canary’s spot XRP ETF will become effective today at 5:30 p.m. (ET) once Nasdaq certifies and approves the Form 8-A application. After that approval, the XRP spot ETF will begin trading when U.S. markets open on Thursday, November 14, 2025. 

Is Canary XRP ETF the First of Its Kind? 

Terrett’s remarks sparked widespread excitement among XRP enthusiasts eager for the launch of what she described as the first spot XRP ETF. However, popular ETP provider REX Shares quickly clarified that the upcoming Canary product is not the first of its kind in the United States. 

It is worth mentioning that REX Shares already launched an XRP ETF (XRPR) in September — a fund many analysts recognized as the first spot XRP ETF to go live in the country. However, Terrett clarified that the REX-Osprey XRP ETF was launched under the Investment Company Act of 1940. 

She explained that the REX-Osprey fund provides only partial spot exposure to XRP and uses a less efficient tax structure. While XRPR does hold XRP, its prospectus indicates investments in a mix of crypto-related ETFs, U.S. Treasuries, and money market funds, making it different in composition from the Canary fund.

In contrast, Terrett emphasized that the upcoming Canary fund is the first pure-play XRP ETF structured under the 1933 Securities Act. The pro-crypto journalist confirmed that the Canary XRP ETF will provide 100% exposure to XRP, with no other assets included. 

Here’s Where XRP Needs to Close Against BTC and ETH to Fuel Its Next Rally

0

Amid the latest rebound, an analyst has identified levels XRP must conquer against Bitcoin and Ethereum to eye higher targets.

Notably, after XRP staged an impressive recovery on Nov. 10, market analyst CryptoInsightUK discussed its performance against Ethereum (ETH) and Bitcoin (BTC), highlighting the major levels XRP must reclaim to gain stronger momentum.

In his latest analysis, he noted that XRP closed the previous day 6.7% higher, ending at $2.47. He noted that the move was encouraging but pointed out that XRP still failed to close above $2.52, which has acted as a key resistance level since the last downturn. 

The market watcher added that breaking this price point would confirm strength and open the path toward $2.64, which stands as the next major target.

XRP Performance Against Ethereum

For the XRP/ETH pair, CryptoInsightUK highlighted a critical resistance around 0.0007102 ETH, a level that has capped XRP’s growth for months. 

On Nov. 10, XRP came close to clearing this hurdle but closed at 0.0007075 ETH, just below the previous local high at 0.0007087 ETH. He said the strong daily candle was a good sign, yet closing below resistance limited XRP’s upward potential.

XRP Against Ethereum CryptoInsightUK
XRP Against Ethereum | CryptoInsightUK

According to him, XRP needs to close above 0.00071 ETH on the daily chart to confirm a bullish breakout. On the 3-day chart, which was set to close later that day, XRP could show strength with a smaller move or a close above 0.0007057 ETH. 

The analyst stressed that XRP would have to outperform ETH by roughly 2.27% to reach that point. Notably, he called attention to the fact that XRP already outperformed ETH by 7% on Nov. 10, making a milder 2.27% increase possible, even if it may not happen immediately.

XRP Performance Against Bitcoin

After analyzing the ETH pair, he called attention to XRP’s performance against Bitcoin. He also described the setup as a mix of positives and negatives. 

CryptoInsightUK noted that XRP managed to close above all daily candle closes between Oct. 10, when the market crash occurred, and Nov. 11, reclaiming about a month’s worth of lost ground. Despite this, XRP ran into the lower edge of a tough resistance zone between 0.00002436 BTC and 0.00002528 BTC.

XRP Against Bitcoin CryptoInsightUK
XRP Against Bitcoin | CryptoInsightUK

For context, this range once served as a major support zone between February and April 2025 before XRP lost it in April, flipping it into resistance. XRP tested and rejected the area in May, regained it as support during the July 2025 rally, and then fell below it again after the October crash. XRP is now trying to reclaim this zone and turn it back into support.

CryptoInsightUK noted that while XRP closed above a group of consolidation candles, it still finished below that resistance area on the 3-day chart. 

He emphasized that a close above the 0.000024 BTC to 0.00002531 BTC range would show a real shift in direction. The higher the timeframe showing that close, the more confidence he would have in a confirmed trend change.

XRP to $5 by Year-End?

Meanwhile, in the long-term Levi Rietvald, another market commentator, maintained a bullish view. Specifically, he called attention to a cup-and-handle pattern on XRP’s 3-day chart. 

For context, the cup formed as XRP fell from $3.4 in January to $1.6 in April, before rebounding to $3.66 in July. The rejection that followed created a descending channel, forming the handle. XRP still trades within the handle, and Rietvald believes a breakout could lead to $5 by year-end.

Popular Analysts Say XRP is Testing the Faith of Bulls, Eyes $10 to $37 Targets

0

Amid the prevailing sideways price action of XRP, some crypto analysts believe the coin could rally as high as $10 to $37 this cycle.

In a Tuesday X post, popular market analyst EGRAG shared his bullish sentiments on XRP. Citing a historical pattern that played out in 2017 and 2021, he argued that XRP is just testing the faith of bulls.

Specifically, in an accompanying chart he shared, the crypto asset has been trading in a descending triangle over the past few months, with its price currently at the base of the triangle. While some traders see weakness on the high time frame, he envisages a massive upward momentum.

XRP Setting for 306% to 1,404% Surge

In particular, EGRAG predicts an increase of about 306% to 1,404% from XRP’s current price of $2.46. In other words, the analyst expects the crypto asset to reach $10 to $37 this cycle.

He went on to add that XRP typically stages a dramatic comeback within a 4 to 6 week window, and history supports this with evidence. “XRP will melt faces,” EGRAG said.

XRP price prediction

Interestingly, another widely followed analyst, ChartNerdTA, re-echoed the same view, reposting Egrag’s analysis. “XRP is busy testing bulls’ faith,” he wrote.

XRP Historical Price Action

Notably, Egrag based his recent XRP projections on a so-called “white/green/blue” candle style that played out in 2017 and 2021.

In 2017, XRP jumped from $0.097 to reach its all-time high of $3.84 in 2018 within three months. In a similar chart setup in 2021, XRP rose from below $0.45 to surpass $1.90 in two monthly candlesticks. With the XRP price currently at the base of this historical chart setup, EGRAG expects a similar play out.

Sharing a close bullish view, an XRP community pundit recently identified factors that could boost XRP’s price toward $15–$20 before the market structure bill passes in the U.S.

Likewise, former CoinRoutes chairman Dave Weisberger also believes XRP could see huge gains this cycle, calling the $1,000 circulating target absurd.

At press time, the popular crypto asset is hovering above $2.46, down 4.4% in the past 24 hours.

Bitcoin Liquidity Pattern That Has Preceded Every Major Rally Is Back, Analyst Says

0

A CryptoQuant analyst, Moreno, says Bitcoin has entered a liquidity setup that has historically appeared ahead of major price surges.

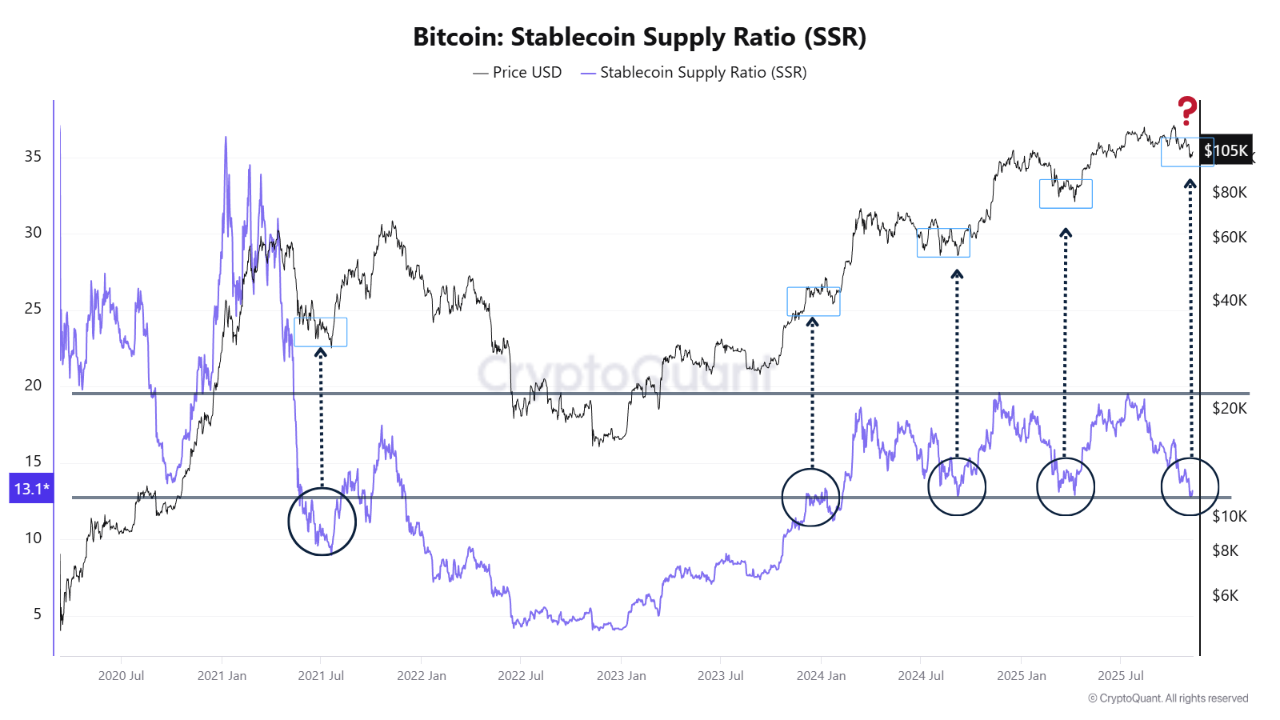
According to him, the current levels of stablecoin reserves relative to Bitcoin’s market cap mirror the exact conditions that preceded multiple rebounds since 2020.

Stablecoin Supply Ratio Drops into Historical Buy Zone

Moreno points to the Stablecoin Supply Ratio (SSR) as the first major signal. For context, the metric compares Bitcoin’s market cap to the total market cap of all stablecoins, helping determine how much “dry powder,” or idle capital, is sitting on the sidelines.

With the SSR falling back to the 13 range, Bitcoin has re-entered a zone that previously marked key bottoms, such as in mid-2021 and several points throughout 2024.

Each time BTC reached this zone, the market was quiet, liquidity built up, and a strong upside move followed shortly after.

Stablecoin Supply Ratio (SSR) | CryptoQuant

Binance Reserves Tell the Same Story

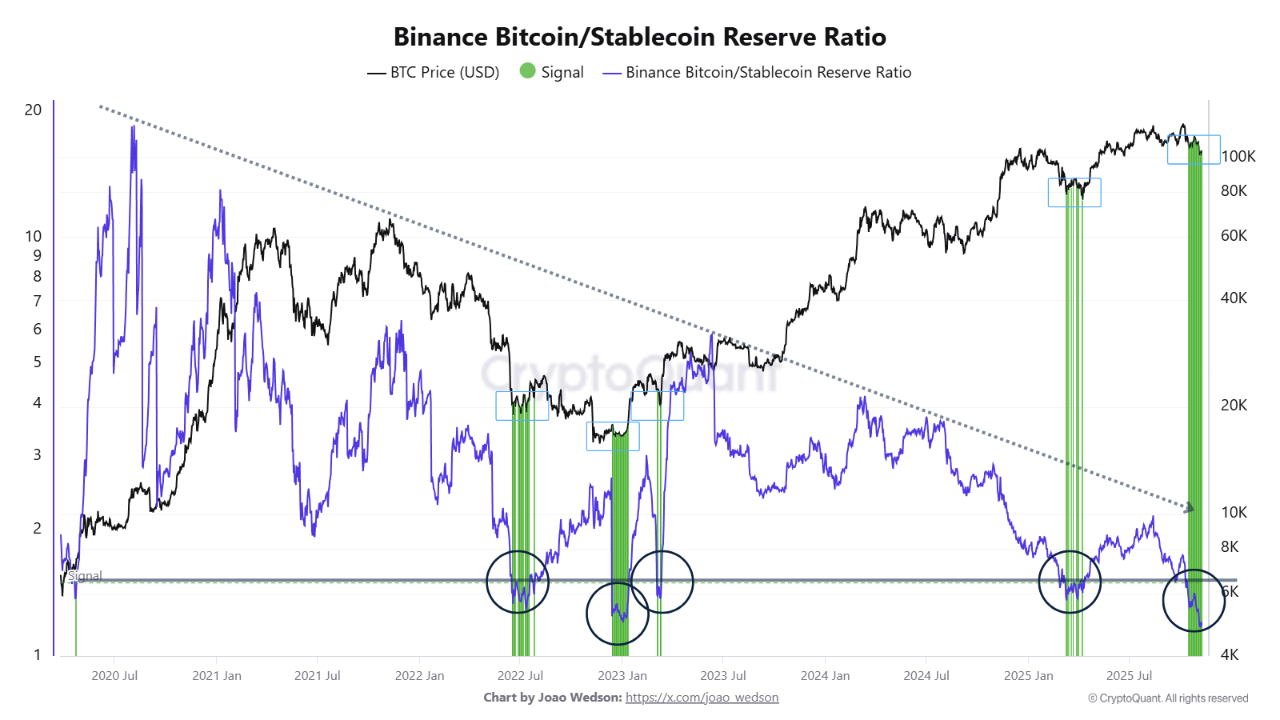
The second piece of the puzzle comes from the Binance Bitcoin-to-Stablecoin Reserve Ratio, which paints a similar picture.

Moreno notes that stablecoin reserves on the Binance exchange are rising, while Bitcoin reserves continue to shrink. This combination has historically surfaced right before market recoveries, suggesting a growing pool of capital waiting to buy.

Moreover, it suggests that weak hands are leaving the market while strong hands are accumulating quietly during low-volatility phases.

Moreno notes that this pattern has appeared only a handful of times since 2020, and each instance aligned with the start of a major upward shift in Bitcoin’s trajectory.

Binance Bitcoin Stablecoin Reserve Ratio

Bitcoin Opportunity: Limited Downside, Expanding Upside

According to the analyst, phases like the current one often offer an attractive risk-to-reward setup. With liquidity building and volatility suppressed, the downside tends to be limited, while the upside increases as stablecoins rotate back into BTC.

Notably, this analysis comes at a time when the market remains largely cautious about Bitcoin’s next move.

Against popular expectations, Bitcoin ended October in the red, and the bearish trend has continued into November. Meanwhile, the last three months of the year have historically been a bullish period for BTC.

The ongoing shift in trend has left many uncertain about whether Bitcoin could still clinch some of those highly touted price targets, such as $150K or even $200K.

Amid this cautious market environment, Moreno believes the risk–reward ratio for buyers today remains promising. At press time, Bitcoin is trading at $104,500, down 0.5% over the past day.

When the Structure Breaks

However, Moreno also warns that this liquidity zone acts as the final line of structural support. If these levels break decisively, it could mark the end of the current cycle’s structure and open the door to a deeper market reset before the next expansion phase.

Ultimately, Moreno emphasizes that this setup matters — it always has — and the real question now is what direction Bitcoin will take from here.

NEAR Price Prediction: Top Analyst Eyes $10 Target After Extended Accumulation Phase

0

Crypto analyst Michael van de Poppe suggests that the prolonged accumulation phase NEAR has faced could lead to a breakout once it clears key resistance.

NEAR Protocol (NEAR) still faces challenges at a critical resistance zone after a year-long accumulation phase. Crypto analyst Michael van de Poppe cited this pattern in a post on X, noting that the market structure has been the standard despite another rejection at the resistance level.

NEAR Struggles at Key Resistance After Extended Consolidation

Data from Van De Poppe’s weekly chart shows notable volatility over the past three years. Notably, early 2023 trading remained relatively flat, ranging from $1 to $2, with low volume and an RSI under 50. An 886% rally began in Q4 2023, pushing the price above $9 by March 2024, accompanied by high volume and overbought RSI levels.

After this peak, NEAR declined through mid-2024 into early 2025, forming lower highs and lower lows. By early 2025, the price had stabilized around $2–$3, the RSI had returned to 40–50, and volume had dropped. 

Image

Currently, NEAR’s RSI is just below 60, indicating modest momentum. A successful breakout above the resistance level could target $5.30, a level that van de Poppe had earlier highlighted. Additionally, NEAR’s support level is forming around $1.60 to $2.00.

However, Van de Poppe advised traders to take advantage of price dips while remaining patient for a confirmed breakout, which he believes could propel NEAR toward the $10 mark, representing a 275% surge. Interestingly, he earlier identified a possible 113% surge to $5 as the first target. 

For context, NEAR trades at $2.67, representing a 6.9% decline over the past day, which reduces its weekly gain to 41%. At this price, NEAR changes hands 87.05% below its all-time high of $20.44, reached in January 2022.

Breakout Could Target $10 if Resistance Clears.

Van de Poppe’s projection of a possible move to $10 aligns with historical price patterns visible on the weekly chart. A breakout above $3.6 could open a path toward previous highs in the $5–$6 range, and eventually to $10 if momentum continues. However, if NEAR fails to overcome resistance, it could remain range-bound or retest lower support levels near $2.0.

Earlier, analyst CryptoBullet highlighted that NEAR has made a strong comeback, fully recovering from the sharp crash it experienced on October 10, when its price plunged below $1.80. The recent surge in the weekly price pushed NEAR back to $2.80 before retesting the current level. 

A line chart of NEAR perpetual contract price in USD from July to December, marked with an October 10 crash zone in pink and a recovery upward trend to around 8400, with TradingView watermark

With this rebound, NEAR’s pattern now shows a solid bullish structure, suggesting the altcoin could be gearing up for a potential rally toward the $4.50 region in the coming weeks, similar to van de Poppe’s first target.

Similarly, trader Anya’s chart shows NEAR consolidating between $1.60 and $3.00 in an accumulation zone. A breakout above the descending resistance could push NEAR toward $9.60, reinforcing van de Poppe’s view that the altcoin is poised to reach $10.