Home Blog Page 6

XRP Needs to Break $1.45 and $1.51 to Surge 19.7% to $1.70

0

XRP Tests $1.41 Fibonacci Level as $1.45–$1.51 Resistance Zone Comes Into Focus.

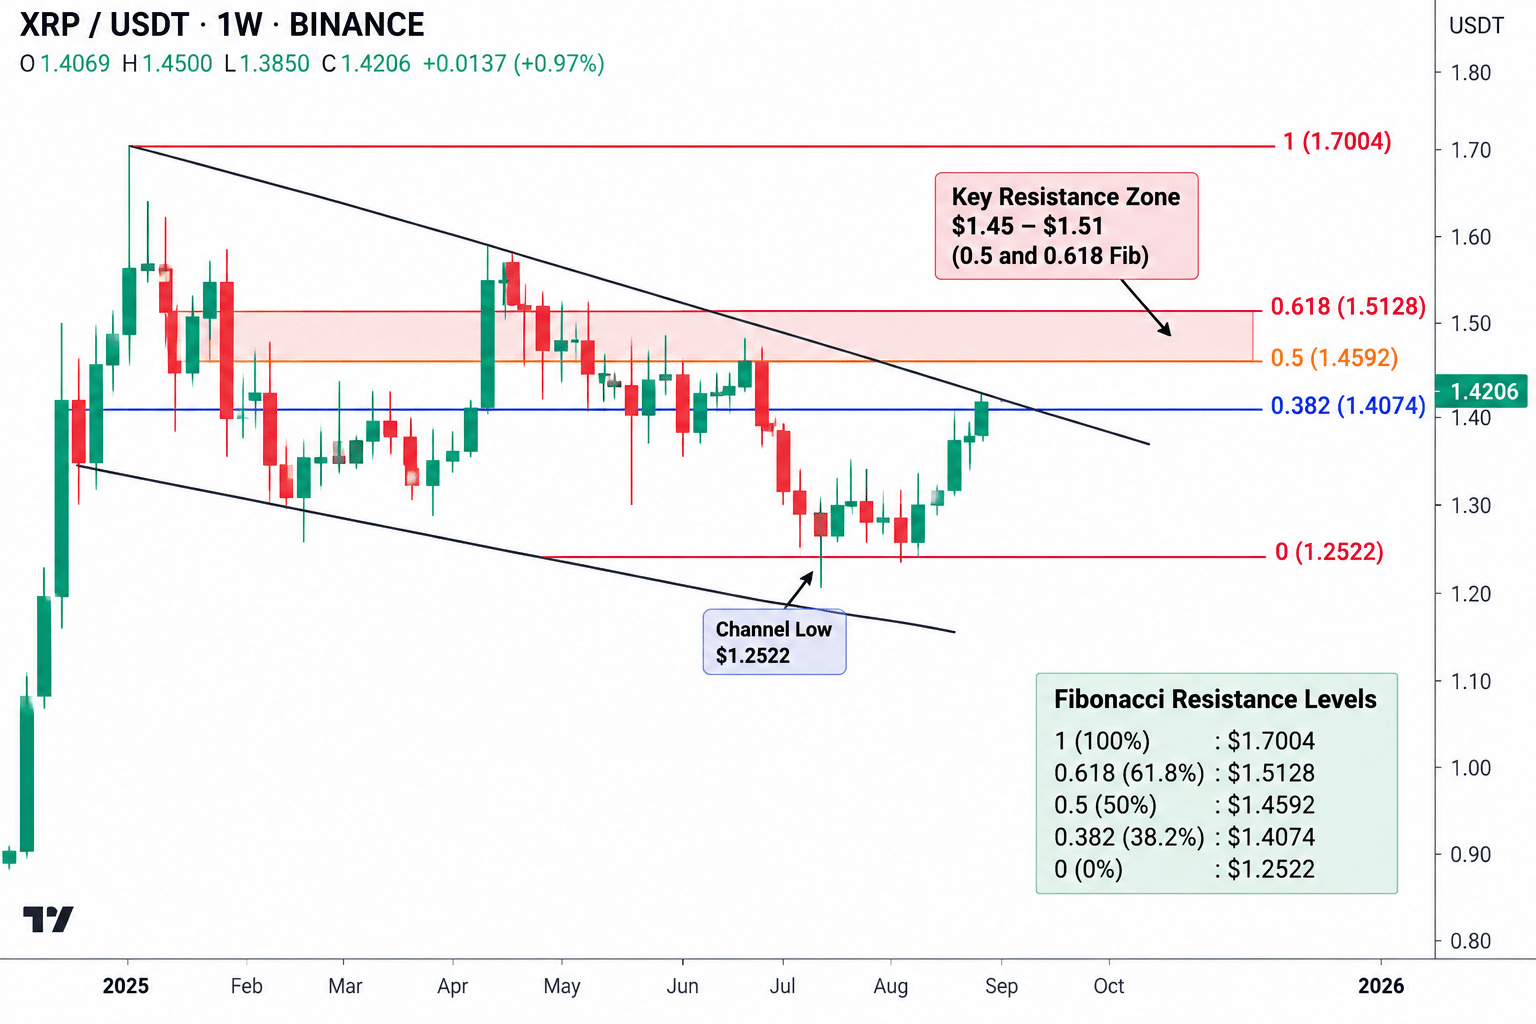
XRP is trading around $1.42 on the chart after advancing from the lower boundary of a descending parallel channel. Price has reached the 0.382 Fibonacci retracement at $1.4074, placing it directly around a key resistance area shown on the chart.
XRP resistance levels as xrp tardes around 1.41
XRP resistance levels as XRP trades around $1.42

The Fibonacci structure is measured between $1.2522 and $1.7004. Above the 0.382 level, the next two retracement levels are $1.4592 at the 0.5 Fib and $1.5128 at the 0.618 Fib.

XRP Faces Resistance Between $1.45 and $1.51

The chart therefore places XRP’s next resistance pocket between approximately $1.459 and $1.513. The 50-week EMA is also reported near $1.51, putting it close to the 0.618 Fibonacci level.

XRP has spent roughly five weeks consolidating after rebounding from the lower portion of the descending channel. The latest move lifted price from around $1.29–$1.30 to $1.42, bringing it back to the channel’s descending upper boundary.

The broader Fibonacci range identifies $1.7004 as the upper reference level. From the chart price of $1.4206, XRP would need to rise approximately 2.7% to reach $1.4592, 6.5% to reach $1.5128, and 19.7% to revisit $1.7004.

On the downside, $1.4074 is the first displayed Fibonacci level below the current price, while $1.2522 marks the base of the measured Fibonacci range.

The chart therefore defines the immediate technical structure through four principal levels: $1.4074, $1.4592, $1.5128, and $1.7004.

To Reach $1.70

To reach $1.70, the chart shows two major resistance levels in between: $1.4592 (0.5 Fib) and $1.5128 (0.618 Fib). The $1.51 area is particularly significant because the 0.618 Fib coincides with the 50-week EMA cited in the setup.

A sustained move above $1.5128 would place XRP above the highlighted $1.45–$1.51 resistance pocket. From there, the next major level displayed by the Fibonacci structure is $1.7004, approximately 19.7% above $1.4206.
Crypto Michael Explains Why He’s Still Long on XRP Since Last Month

0

Crypto Michael Keeps XRP Long Open After July Accumulation Call.

Crypto trader Crypto Michael, who has about 126,000 followers on X, says he is still holding an XRP leveraged long position opened last month. The latest position screenshot shows an XRPUSDT perpetual contract using 20x leverage, with an entry price of $0.9918 and a mark price of $1.4036.

The screenshot, timestamped September 19, 2026, displays a return of +830.51% on the leveraged position. The percentage shown represents the leveraged position return rather than XRP’s underlying spot-price increase.

XRP Has Risen More Than 40% From the Entry Price

Using the figures displayed in the position screenshot, XRP increased from the $0.9918 entry to $1.4036, a difference of $0.4118 per XRP.

Image

That represents an underlying price increase of approximately 41.5%. With 20x leverage, changes in XRP’s price produce substantially larger percentage changes in the position’s displayed return.

Michael said in his latest post that he remains in the XRP long and expects the move to accelerate, telling followers that they “don’t want to be sidelined.”

Those statements represent his forecast, rather than an established future XRP price.

July XRP Chart Showed Falling-Wedge Structure

The position follows an earlier XRP call published on July 1, 2026, when Michael wrote: “I’ve been accumulating XRP here. You’re about to see why.”


His July weekly chart showed XRP around $1.06, trading near the bottom of a large falling-wedge structure that had developed after XRP’s decline from above $3. The chart also highlighted a major historical price zone around $1.90–$2.10.

Contemporary reporting on his July analysis recorded $1.90–$2.10 as his next target zone. XRP was trading around $1.15 at the time of that subsequent report.

XRP Position Remains Open Above $1.40

The two screenshots document the sequence from the July accumulation statement to the September leveraged position: XRP near $1.06 on the July chart, a $0.9918 long entry, and a September mark price of $1.4036.

That puts XRP roughly 41.5% above the stated entry price, while the displayed 20x leveraged position shows +830.51%. The position screenshot indicates the trade remained open as of September 19, 2026.

XRP Is Set for a $2 Move as Bullish Chart Pattern Forms

0

XRP is targeting $2 if it completes a bullish chart pattern, according to crypto analyst Ali Martinez.

Martinez says XRP is forming an inverse head-and-shoulders pattern on the daily chart. The key level to watch is around $1.55, known as the neckline.

A break above $1.55 confirms the pattern and sets up a 35% rise toward $2. Martinez also sees room for XRP to move higher.

At the time of the cited CoinMarketCap data, XRP was trading around $1.31, up 1.75% for the day. It was still down 0.35% over the past week but had gained about 30% over the past month.

$1.55 Is the Key XRP Level

Martinez’s chart shows XRP forming an inverse head-and-shoulders pattern, with the right shoulder still developing. The key level is $1.55, which has acted as a major resistance level before. XRP needs to break above $1.55 for the pattern to be confirmed.

Martinez expects XRP to first move toward $1.55, followed by moves to $1.70, $1.90, and eventually around $2.10. From the cited price of $1.31, reaching $2 represents about a 53% increase. Martinez’s 35% gain is calculated from the $1.55 breakout level to around $2.09.

ChartNerd Watches $1.33 Support

Meanwhile, another analyst, ChartNerd, is also watching XRP’s current price area. ChartNerd says XRP bounced after touching its 20-week moving average and returned to the middle of its price channel and the previous $1.33–$1.36 support zone.

This area is important because it becomes resistance if XRP fails to move back above it.

If XRP fails to reclaim $1.33–$1.36, the next challenge is the downward resistance line. For now, XRP is at an important level, trading just below the previous $1.33–$1.36 range.

XRP Chart by ChartNerd

Martinez Previously Watched $1.38

Five days earlier, Martinez pointed to another bullish setup while XRP was trading around $1.31–$1.35. He said XRP would continue moving within a triangle pattern as long as the $1.31–$1.35 support zone held.

He identified $1.38 as the key breakout level. A strong move above $1.38 would push XRP toward $1.60. His latest analysis now focuses on the higher $1.55 level, showing XRP has several levels to break before moving toward $2.

The main levels to watch are:

  • $1.31–$1.35: Immediate support zone
  • $1.38: Near-term breakout level
  • $1.55: Key neckline for the larger pattern

According to Martinez’s analysis, breaking above $1.55 opens the way toward $2.

BlackRock’s IBIT Rises 5.8% as Trading Volume Surpasses Gold ETF GLD

0

BlackRock’s IBIT gained nearly 6% with $1.56 billion in trading value, ranking fifth and exceeding GLD’s $907.64 million turnover by about 72%.

BlackRock’s iShares Bitcoin Trust ETF (IBIT) recorded $1.56 billion in trading value during the session shown, placing it fifth among the ETFs in the market snapshot. IBIT traded around $45.81–$45.86, representing a daily increase of approximately 5.8%–5.9%.


The session placed the Bitcoin ETF ahead of one of the largest gold investment products, SPDR Gold Shares (GLD), in both percentage price movement and trading value.

IBIT Records 72% More Trading Value Than GLD

GLD traded at approximately $398.96, up 0.15%, with trading value of $907.64 million. That placed the gold ETF ninth in the displayed ranking.

IBIT’s $1.56 billion turnover was approximately $652 million higher than GLD’s, meaning IBIT recorded about 72% more trading value during the measured session.

The percentage-price moves also differed substantially. IBIT gained approximately 5.9%, compared with GLD’s 0.15% increase—a difference of roughly 5.75 percentage points.

Metric IBIT GLD
Price $45.86 $398.96
Daily change +5.91% +0.15%
Trading value $1.56B $907.64M
Volume ranking shown #5 #9

IBIT Enters the Session’s Top Five

Only four products in the displayed list generated more trading value than IBIT: SPY at $10.06 billion, QQQ at $6.75 billion, SOXL at $2.17 billion, and IWM at $1.99 billion.

The session data therefore shows IBIT trading four positions above GLD, with approximately 1.72 times GLD’s trading value.

Yesytersay JPMorgan Said that Bitcoin Could Gain More Than Gold if ETF Hedging Eases.

XRP Inverse Head-and-Shoulders Setup Puts $1.55 and $2 in Focus

0

XRP Forms Inverse Head-and-Shoulders Structure With $1.55 Neckline and $2 Target.

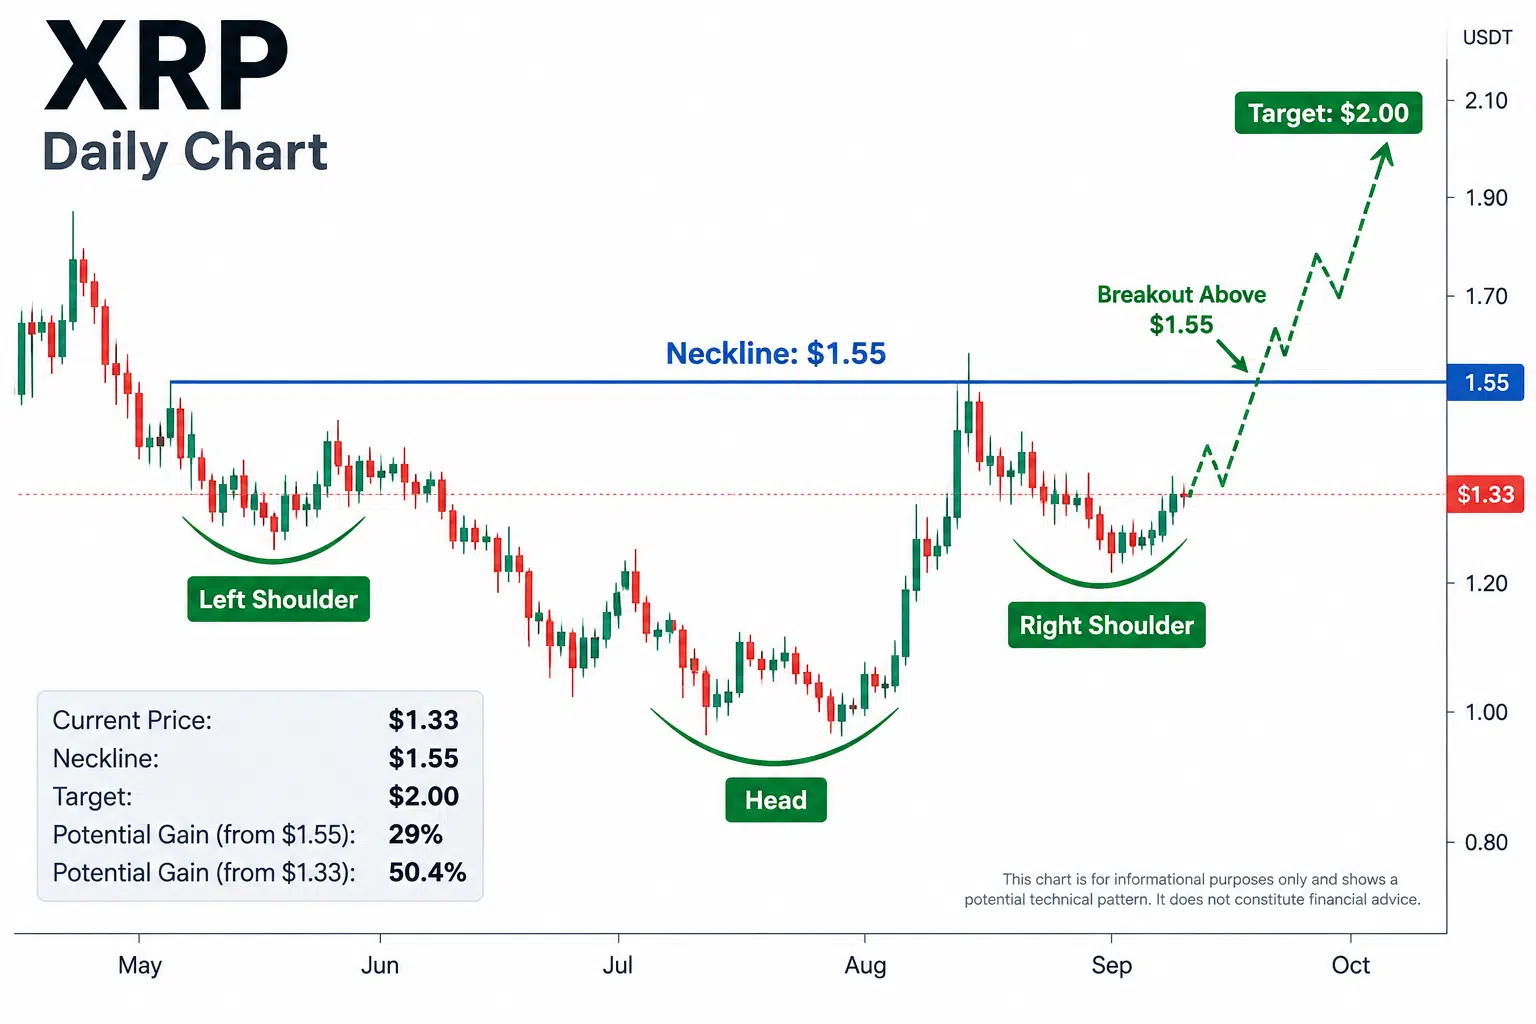
XRP’s daily chart is displaying an inverse head-and-shoulders structure, with the latest price marked at approximately $1.33. The chart identifies a left shoulder, a lower central trough forming the head, and the current price area as the developing right shoulder.

XRP Trades Near $1.33 as Right Shoulder Develops

The chart shows XRP declining from the $1.40–$1.50 region in May toward approximately $1.00 in August. Price then recorded a sharp advance from around $1.00 to above $1.50 before retracing.

XRP head and shoulder pattern

The latest consolidation is centered around $1.30–$1.35, with the chart marking $1.33 as the current reference level. This area forms the right side of the displayed inverse head-and-shoulders structure.

$1.55 Marks the Neckline

The horizontal neckline is positioned at approximately $1.55. XRP reached this region during its late-August/early-September advance before moving back toward $1.33.

From $1.33, a return to $1.55 represents an increase of approximately 16.5%.

A daily breakout above $1.55 would place price above the neckline shown on the chart and complete the displayed inverse head-and-shoulders configuration.

Chart Maps a Move Toward $2

The chart’s projected path extends above $1.55 and toward the $1.90–$2.10 region.

A move from the $1.55 neckline to $2.00 equals approximately 29%. From the current $1.33 reference price, reaching $2 would represent an increase of approximately 50.4%.

The principal levels displayed are therefore $1.33 at the current price area, $1.55 at the neckline, $1.90 as an upper reference level, and $2.10 at the top of the chart’s projected range.

The $2–$2.10 levels are projections shown on the chart, not completed XRP price movements.

XRP Seeing Vanishing Leverage: Why a $2 Billion Sell-Off Might Actually Be Good News

0

The XRP perpetual and spot CVDs have recently recorded massive declines amid selling pressure, but there may be a silver lining.

XRP is showing an unusual level of calm as traders continue to cut their leveraged positions and spot-market selling remains high. The asset currently trades at $1.32, up 3.14% on the day, while holding key support. The broader crypto market also gained ground after Wednesday’s quarter-point Federal Reserve rate hike and Thursday’s SEC approval of a blockchain-based stock trading pilot.

Bitcoin (BTC) moved back above $78,000, while Ethereum (ETH) held above $2,500. XRP, meanwhile, stayed between $1.28 and $1.33, a range it has held for much of the past week after falling roughly 4% from a recent high around $1.42. 

The price movement looks calm at press time, but data from the futures and spot markets shows that traders have made much larger moves beneath the surface.

XRP Leverage Drops Three Times Faster Than Price

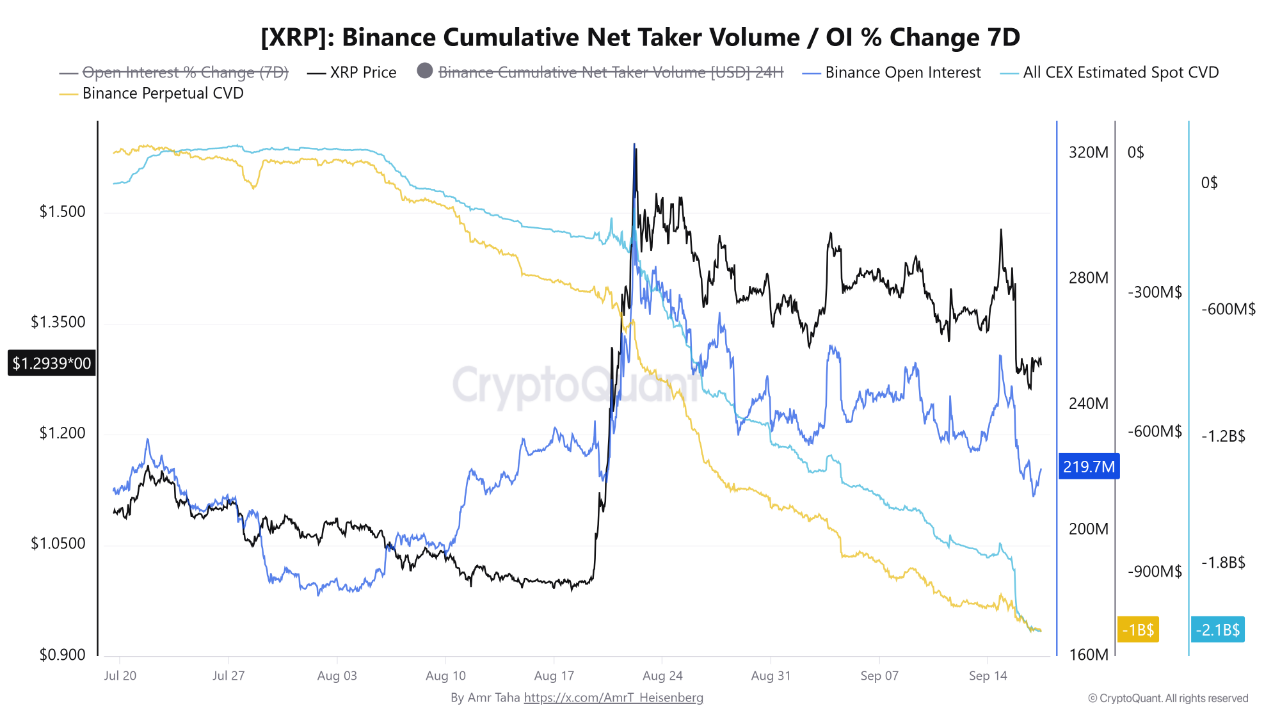
Binance data shows that traders are reducing leverage. Notably, XRP open interest on the exchange fell from about $323 million on Aug. 22 to roughly $219 million by Sept. 17. That amounts to a 32% drop in less than four weeks.

XRP’s price declined by only about 11% over the same period, indicating that Open Interest fell almost three times faster than the price. 

XRP Derivatives Data | Source: CryptoQuant

This suggests that traders have closed leveraged positions at a much faster rate than XRP has fallen, rather than the decline coming mainly from traders opening new short positions.

Data from the broader derivatives market shows the same trend. XRP’s total derivatives open interest dropped from roughly $1.13 billion in mid-August to about $871 million by Sept. 17, representing a decline of more than $250 million in less than a month.

Spot Selling Pushes XRP CVD to New Lows

The selling pressure has also spread into the spot market. Binance’s Perpetual CVD, which measures the difference between aggressive buying and selling in the futures market, fell from around -$361 million to -$1 billion over the same period, giving the indicator its weakest reading from July through September.

Spot markets recorded a larger change. Estimated Spot CVD across major centralized exchanges dropped from about -$111 million to -$2.1 billion, also reaching its lowest point during the July-to-September period. This represents a nearly $2 billion change toward stronger spot selling.

The move was more than three times larger than the roughly $639 million decline in perpetual CVD. This shows that selling has not come only from traders using leverage. Spot-market participants have also sold large amounts of XRP, either taking profits or reducing their losses.

Less Leverage Could Give XRP Room to Recover

Falling open interest and deeply negative CVD give XRP a mixed market trend. Traders have reduced their positions, but aggressive sellers still control much of the market flow. 

Notably, the smaller derivatives market could limit the amount of leverage available to drive another sharp decline. Also, a lower open-interest base means fewer highly leveraged long positions remain vulnerable to forced liquidations if XRP falls again. 

If short positions take up a larger share of the remaining open interest, funding rates could move toward neutral or even negative levels. This could create conditions for a short squeeze if buying demand returns.

XRP’s recent price action also shows some stability. The token has stayed above its 20-week EMA around $1.29 despite the large drop in leverage. A daily move above $1.40 could put the $1.60-$1.70 range in focus. However, a close below $1.29 could push attention back to the psychologically important $1.00 level. 

XRP Whale Inflows to Binance Hit Six-Month High

0

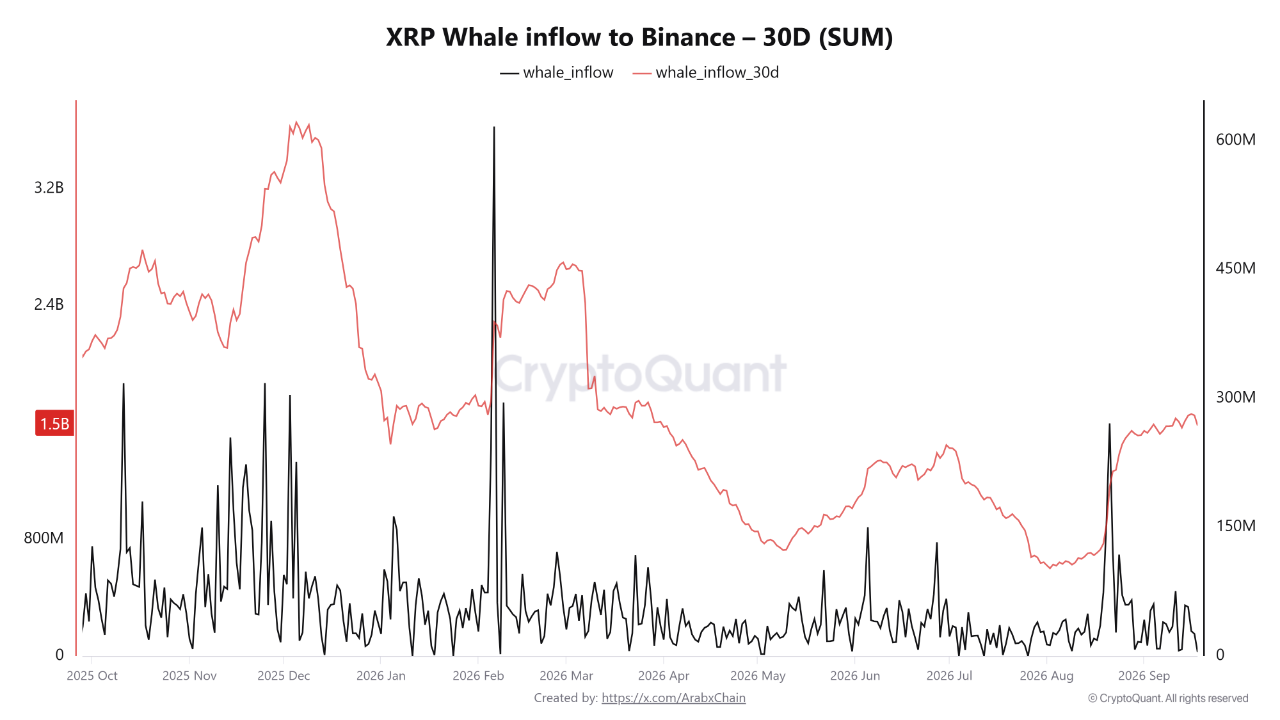
Large XRP holders have been sending much more XRP to Binance, with whale transfers reaching their highest level in six months, according to CryptoQuant contributor Arab Chain.

About 1.6 billion XRP was moved from whale wallets to Binance over the past 30 days. This is the highest amount recorded since March.

Whale transfers had been falling for several months, reaching very low levels in May, June, and July. Meanwhile, they started increasing again in August.

XRP Whale Transfers Increase

According to Arab Chain, XRP transfers to Binance have increased quickly in recent weeks. This means large XRP holders are moving much more XRP to the exchange than they did in previous months.

More XRP into exchanges means the tokens can be traded more easily, which could increase the amount of XRP available in the market in the short term.

But higher exchange inflows do not necessarily mean whales are planning to sell. Large holders may move XRP to exchanges for different reasons, such as trading, managing liquidity, or changing their portfolios. They can also move XRP between wallets and exchanges without selling it immediately.

XRP whale inflows to Binance | CryptoQuant

Whale Inflows Do Not Mean Selling

Arab Chain said whale transfers are more useful when compared with other market data. Metrics like net exchange flows, trading volume, XRP’s price, and exchange reserves can help show whether whales are actually selling.

If whale deposits stay high while exchange inflows and trading volume also increase, it could mean large holders are preparing to sell more XRP. But if whale deposits rise without more selling pressure, the transfers could simply be for trading or moving funds around.

XRP Whales Accumulating

Meanwhile, on-chain data from Santiment showed increased activity among large XRP holders ahead of its recent rally. The analytics platform reported that 85 new wallets holding at least 1 million XRP appeared just two days before XRP surged 72% between August 17 and August 21.

The increase suggests that large holders were accumulating XRP before the price move. Wallets holding 1 million XRP or more control significant amounts of the token, and changes in their numbers shift market supply.

XRP Whale Chart by Santiment

Santiment also highlighted activity on the XRP Ledger (XRPL), including Ripple’s support for an RLUSD credit fund serving fintech and payment companies. Investments in projects such as ZILO and Licuido are also contributing to tokenization, asset transfers and other financial services on the network.

However, not all indicators are positive. Crypto analyst Casi noted that XRP has fallen below the 0.5 Fibonacci level, weakening a previous outlook for a move toward $1.78. The analyst identified $1.65 as a key level to reclaim, while $1.10 remains important support. A deeper decline could bring $0.87 into focus.

XRP Bears Hit a Wall after BoS, But Bearish Structure Remains Until This Level Clears

0

XRP bears are currently facing resistance on the back of the recent rebound, but chart data suggests the downtrend may not be over.

XRP started the week under strong selling pressure after the U.S. Senate failed to advance the CLARITY Act, a bill that could have provided more regulatory clarity for digital assets.

The setback removed an important bullish factor for XRP and sent the token down to the $1.29-$1.30 range as sellers moved in. Since the SEC case, XRP has had links to U.S. regulatory developments, which made the Senate setback particularly important for the token.

XRP Records Bearish BoS

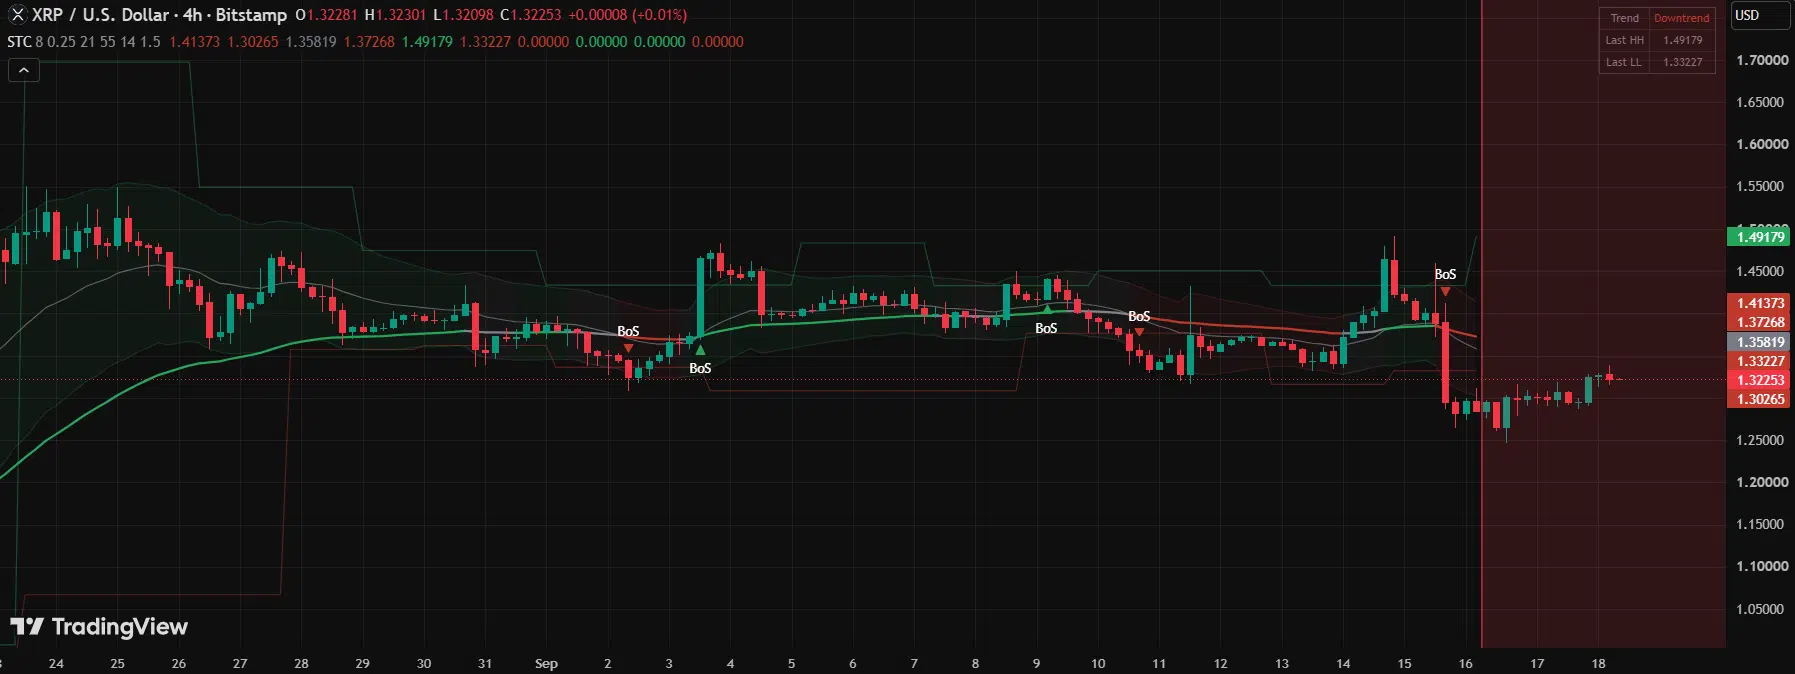
On the 4-hour chart, XRP recorded a bearish Break of Structure (BoS) after falling below the $1.3325 swing low and closing at $1.2951. 

The move took XRP below the broken support and the lower volatility band at $1.3023. At the same time, the EMA21 stood at $1.3585, while the EMA55 remained at $1.3726. Both moving averages stayed above the price, which created a strong resistance area.

The previous major swing high at $1.4961 had also remained untouched for eight bars, and this added to the signs of weak buying pressure. 

XRP had already moved beyond its 1.5x ATR (Average True Range) envelope, showing that the decline had moved quickly and covered a large range in a short period. Such a sharp move can leave room for a temporary recovery before the next major price move.

The structure suggests XRP could see a possible recovery toward the $1.3325-$1.3585 area. In this scenario, the former support at $1.3325 could turn into resistance, while the EMA21 at $1.3585 could limit the recovery. 

A rejection from that area would strengthen the case for another decline toward $1.2450, followed by the psychological $1.20 level and potentially $1.10 if selling pressure increased.

XRP Bearish BoS
XRP Bearish BoS

The key level that could invalidate the bearish setup remains the EMA55 at $1.3726. A 4-hour close above that level would weaken the bearish case and remove the basis for the lower targets. 

Notably, the selling pressure also appeared in longer-term momentum, as XRP’s two-week RSI fell to around 33.5, the lowest reading shown across 13 years of XRP trading history.

Where XRP Stands Today

Interestingly, buyers have since returned, leading to a mild XRP recovery. The token now trades around $1.33, up 2.4% over the past 24 hours, with trading volume above $2.48 billion. The broader recovery across the cryptocurrency market has also helped support XRP.

Bitcoin and Ethereum have also joined the recovery, trading above $78,000 and $2,500, at press time. This broader improvement has given XRP some support after the decline earlier in the week.

The daily chart now shows a more balanced market. XRP at $1.33 sits between the daily EMA20 at $1.34 and the EMA50 at $1.29, while the price remains almost exactly at the EMA200 of $1.33. The daily RSI at 49.56 sits near the middle of its range.

The Key Question Now

Shorter timeframes now show stronger buying pressure. The 1-hour RSI stands at 65.02, while the 15-minute RSI is at 66.85. Both readings suggest that buyers have gained some strength in the short term.

The main area to watch remains $1.32-$1.34, which matches the zone identified in the earlier bearish setup. A break above this range could open the way toward $1.37 and then $1.46. Still, XRP needs to move through the wider resistance structure before the recent recovery can fully challenge the bearish setup.

Despite the ongoing rebound push, the original bearish structure remains relevant. XRP now trades closer to the $1.3726 EMA55 level that would invalidate the bearish setup.

A 4-hour close above $1.3726 would invalidate the structure and bring the $1.4961 swing high back into focus. On the other hand, a rejection from the current $1.33-$1.37 area would keep the downside levels at $1.2450, $1.20, and $1.10 relevant.

Can the XRP Ledger Lending Protocol Be Drained? Common Prefix Is Using Math to Find Out

0

Common Prefix is formally verifying the XRP Ledger Lending Protocol to mathematically prove that it cannot be drained, become insolvent, or break its rules.

The work focuses on the Lending Protocol introduced through XLS-66. Common Prefix explained its approach in a six-part series, including why it chose Lean 4 for the verification process.

Moving Beyond Conventional Testing for XRP Ledger

Common Prefix said formal verification goes beyond normal software testing by using mathematics to prove that a system works correctly in all possible situations.

For the XRP Ledger lending protocol, the goal is to prove that it cannot be drained, become insolvent, or break its defined rules.

Unlike standard testing, which checks selected scenarios, formal verification aims to prove that these properties always hold within the system.

XRP Ledger validator Vet, also known as Hussein Zangana, said formal verification is already used in high-risk systems such as military technology, air traffic software, flight controls, and nuclear power plants.

He explained that the approach uses mathematics to show a system remains valid across all possible inputs, not just the situations developers have tested.

Why Common Prefix Chose Lean 4

Common Prefix considered several tools, including Dafny, Lean 4, TLA+, and P. The team decided that TLA+ and P were not a good fit for the specific questions it needed to answer about the lending protocol.

One reason it chose Lean 4 was that it does not rely on an SMT solver. Common Prefix found that Dafny’s solver could sometimes time out when handling the complex arithmetic needed for the verification.

Lean requires more work by hand, but this also makes errors easier for developers to find and fix.

The team also said Lean is more flexible. While Dafny uses preconditions and postconditions to describe how a system should behave, Lean uses theorems, giving Common Prefix more flexibility for its verification work.

Cross-Checking the Real Implementation

Another reason Common Prefix chose Lean is that it works well with the C programming language. Lean can compile to C and connect with C-based software. This allows the team to compare its mathematical model with the actual lending protocol.

Instead of assuming the model and real system work the same way, the team can test the Lean model against the real implementation. Common Prefix said this is an important part of its verification process.

Lean’s Ecosystem

Common Prefix also chose Lean because it has active development, good tools, and a growing community. The team said Lean’s large community means many technical problems have likely already been solved by other developers.

Vet said using formal verification for the XRP Ledger Lending Protocol (XLS-66) is important because it helps prevent serious failures.

The Lending Protocol supports lending on the XRP Ledger, so verification helps ensure it follows its financial and operational rules under different conditions.

This is different from regular testing or a traditional audit. Instead, Common Prefix is using mathematical proofs to show that the protocol’s key properties hold under the conditions defined in its model.

AMD Stock Climbs Above $553 as Recovery From AI Selloff Continues

0

Advanced Micro Devices shares were up 1.5% at $553.35 around 6:40 a.m. ET Friday after jumping 6.4% Thursday, extending a three-session rebound from Monday’s AI-led semiconductor selloff. Ondo’s AMDon token was meanwhile trading near $554 on MEXC.

The recovery has not been isolated to AMD. The Philadelphia Semiconductor Index rose 3.1% Thursday, while Intel gained 7.7%, Arm 8.6% and Micron 5.5%, showing that much of the rebound has been sector-wide. Friday’s backdrop remained supportive, with Nasdaq 100 futures up 0.56% early in the session as falling oil prices eased inflation concerns.

Demand Commentary Strengthens AMD’s Recovery

AMD also has company-specific support behind the broader semiconductor rebound. Piper Sandler reiterated an “Overweight” rating and $600 price target this week after AMD’s third-quarter pre-quiet-period call, with analyst David O’Connor saying CPU and GPU ramps remained on plan and demand continued to exceed available supply. The firm said available supply was sufficient to support AMD’s existing guidance and potentially more. Piper’s post-call assessment focused on Helios, Venice CPUs, and supply conditions.

That commentary arrived immediately after a sharp change in sentiment toward AI hardware. AMD closed at $493.41 on Monday as calls by leading AI executives for slower model development triggered a global chip selloff. The stock then rose in each of the next three regular sessions, closing Tuesday at $504.20, Wednesday at $512.50 and Thursday at $545.09. Friday’s $553.35 premarket quote leaves AMD about 12.1% above Monday’s close.

There was no new AMD investor-relations press release Friday; the company’s latest IR release remains its Aug. 31 Cisco/HUMAIN update. However, reports published early Friday said AMD had notified customers of roughly 10% price increases in the fourth quarter for AI accelerators, consumer GPUs and motherboard chipsets, with higher TSMC costs cited as the driver. AMD had not publicly confirmed the report. Friday’s backdrop therefore includes both the broader semiconductor rebound and fresh, but unconfirmed, AMD-specific pricing news, alongside Piper Sandler’s demand commentary.

The Bigger Test Is Turning Demand Into Results 

The rebound also changes the picture from AMD’s last earnings reset. AMD reported record second-quarter revenue of $11.54 billion, up 50% year over year, with Data Center revenue more than doubling to $6.7 billion. Management said EPYC demand was accelerating, Instinct deployments were scaling, and Helios was beginning to ramp.

AMD nevertheless fell 7.0% in the next regular session, from an Aug. 4 close of $518.58 to $482.05, as investors demanded a larger AI payoff despite better-than-expected guidance. Reuters reported at the time that elevated expectations and supply constraints were central concerns. 

AMD’s $553.35 premarket price is about 6.7% above its Aug. 4 regular-session close before the earnings release, effectively recovering that post-report reset. The operating tension has not disappeared: AMD’s official third-quarter outlook calls for roughly $13 billion of revenue, up about 13% sequentially, so execution on the supply and product ramps highlighted by Piper remains important.

AMD currently has no future investor event formally scheduled on its IR calendar. The confirmed operating roadmap remains the Helios ramp: AMD said in July that Helios rack-scale systems were already in production for large AI deployments, keeping execution against that ramp and the $13 billion Q3 revenue outlook at the center of the next fundamental update.

AMDon Tracks the Rebound in a Separate Market

According to CoinGecko, Ondo’s AMDon token was trading around $553.69 on MEXC early Friday, with roughly $315,000 in 24-hour volume on the pair. Other active markets were also quoting AMDon around $553 to $554.

The token trades in a different market from Nasdaq-listed AMD, so its price action covers a separate trading window. Ondo says its tokenized stocks provide economic exposure to the underlying securities, including the economic effect of reinvested dividends, but the tokens are not themselves shares of the listed companies and do not give holders the right to receive the underlying stock.

Investor Takeaway 

AMD has reversed Monday’s AI-driven selloff as both semiconductor sentiment and company-specific demand commentary improved. The central question is now whether AMD can convert demand that analysts say exceeds supply into the revenue and product ramps embedded in its Q3 outlook, while AMDon is reflecting the same equity story through a separate tokenized-market trading window.