Home Blog Page 54

Cardano Whales Accumulate 240 Million ADA as Price Recovery Gains Momentum

0

Large Cardano holders have significantly expanded their positions over the past five days, reinforcing confidence in ADA’s recent market recovery.

According to data from Santiment, whales accumulated more than 240 million ADA during the period, pushing their combined holdings to around 14.5 billion ADA. The aggressive buying coincided with a 22% surge in Cardano’s price, indicating that major investors capitalized on the rally to strengthen their positions. Image

ADA Retains Most of Its Recent Gains

Whale accumulation is often regarded as a bullish indicator because it reflects growing confidence among large investors, who typically increase their exposure when they anticipate further upside.

In the meantime, Cardano has delivered a strong performance in recent days, rallying from around $0.16 to nearly $0.19 within a short period. Although the cryptocurrency has pulled back from its recent peak, it continues to hold on to most of those gains.

At press time, ADA trades at $0.1801 after slipping below the $0.19 mark. Even so, the token remains up 13.6% over the past seven days and has gained an additional 1.84% over the last 24 hours.

Meanwhile, trading activity has accelerated alongside the price rally. Cardano’s 24-hour trading volume has climbed 43.03% to $614.05 million, highlighting increased investor participation. ADA also ranks as the 14th-largest cryptocurrency by market cap, with a valuation of roughly $6.75 billion.

Technical Indicators Signal Short-Term Risk

Despite the bullish on-chain accumulation, short-term technical indicators suggest that ADA could face additional downside pressure.

Market analyst GainMuse noted that ADA recently confirmed a bearish wedge breakdown on the 30-minute chart after declining to around $0.1802. The analyst stated that the price has already reached its initial downside target near $0.1791, while rising trading volume during the breakdown indicates that sellers currently maintain control.

According to the analysis, ADA must reclaim the $0.1808 level to invalidate the bearish pattern and restore short-term bullish momentum. Otherwise, continued selling pressure could drive the price toward the next downside target around $0.1747.

The analysis also identifies immediate support near $0.1719, with a stronger support zone around $0.1663 if the decline intensifies. Until ADA climbs back above the broken wedge pattern, bears are expected to retain the short-term advantage despite the continued whale accumulation. 

image

Hoskinson Calls for Cardano Comeback, Urges Community to Get ADA “Back to Winning Again”

0

Cardano founder Charles Hoskinson has called on ADA holders to unite behind efforts to restore the cryptocurrency’s competitive edge and return it to a winning position.

Speaking during his latest livestream, which primarily focused on Blockfrost before expanding to broader Cardano ecosystem issues, Hoskinson compared the network’s current state with where it stood in 2024. 

Hoskinson Vows to Get ADA to Winning Again 

He argued that Cardano is significantly stronger from a technological standpoint today than it was two years ago. However, he acknowledged that the project’s market position, brand strength, and industry reputation have deteriorated over the same period.

Despite the challenges, Hoskinson emphasized that he will continue to drive Cardano forward regardless of whether he receives unanimous support from the community.

He said he knows the direction he wants to take the ecosystem and invited supporters to join him in restoring ADA’s momentum. According to him, the goal is to get ADA back on track and back to winning again, adding that success benefits the entire ecosystem and remains his top priority.

ADA Struggles as Market Pressure Intensifies

Hoskinson’s remarks come as ADA continues to face significant market headwinds. The coin has declined 49.21% since the start of the year, causing it to fall to 14th place in the global crypto rankings. 

The prolonged downturn has fueled frustration within the Cardano community, contributing to governance disputes and the departure of several projects from the ecosystem. Nonetheless, Hoskinson has previously outlined an ambitious plan to return Cardano to the top 10 cryptocurrencies by market cap before the end of the year.

Meanwhile, the token’s sharp decline and ongoing ecosystem challenges have prompted critics to intensify claims that Cardano has become a failed experiment.

Hoskinson Rejects Claims That Cardano Has Failed

Responding to those criticisms during a recent podcast, Hoskinson argued that many observers overlook Cardano’s consistent development progress and long-term roadmap.

He maintained that although some critics portray the ecosystem as struggling, Cardano continues to meet its development milestones and remains on track to achieve its broader vision.

While ADA’s price has struggled, Cardano has continued to deliver major technical upgrades. Earlier this month, the network activated the van Rossem hard fork, upgrading Cardano to Protocol Version 11. The upgrade also laid the foundation for Ouroboros Leios, Cardano’s next major scalability enhancement, which is expected to launch on the mainnet later this year.

In addition, the development team launched the first phase of the RealFi testnet. The initiative aims to connect on-chain liquidity with real-world lending, microfinance, and credit markets, particularly in developing economies, further advancing Cardano’s long-term adoption strategy. 

Over 3.2 Billion Shiba Inu Destroyed in July as SHIB Burn Rate Surges 1,395% 

0

Shiba Inu’s token burn campaign gained remarkable momentum throughout July, with community burn tracker Shibburn reporting that more than 3 billion SHIB left circulation during the month.

According to Shibburn data, the ecosystem permanently removed 3,248,854,065 Shiba Inu tokens over the past 30 days. At the time of the report, the burned tokens were worth $16,575. Notably, Shibburn revealed that the monthly total represented a 1,395% increase in burn rate compared with the previous 30-day period. 

Image

Shiba Inu Peak Burn Periods

Shibburn’s monthly burn chart showed that the largest concentration of burn transactions occurred on July 8 and again between July 25 and July 28, suggesting that community participation intensified during several key periods.

The sharp increase in burns demonstrated sustained engagement from SHIB supporters as the ecosystem pushed to remove more tokens from circulation. Notably, the spike in burn activity, particularly during the final week of July, coincided with one of Shiba Inu’s strongest price rallies in recent months.

As burn activity accelerated, SHIB climbed nearly 40%, briefly reaching around $0.0000060 before sellers emerged and pushed the token back below $0.000005.

Although the rally lost momentum toward the end of the month, Shiba Inu still closed July with an impressive 12.2% monthly gain, making it one of the token’s strongest monthly performances since November 2024. 

The positive momentum carried into August. On the first day of the month, Shiba Inu gained another 3.24%, extending July’s bullish performance and signaling continued market optimism.

Shiba Inu Monthly Returnss
Shiba Inu Monthly Returns

Shiba Inu Marks Its Sixth Anniversary

The latest price increase also coincided with a major milestone for the ecosystem: Shiba Inu’s sixth anniversary.

Launched on August 1, 2020, as a meme-inspired cryptocurrency, Shiba Inu has since evolved into a broader blockchain ecosystem. Today, it includes a decentralized exchange, an NFT initiative, a Layer-2 blockchain through Shibarium, and several ecosystem tokens designed to expand its utility.

Despite these developments, the project continues to face criticism. Skeptics point to SHIB’s 94.51% decline from its all-time high, the absence of several prominent ecosystem leaders on social media, and delays or incomplete delivery of some announced initiatives. Nonetheless, reaching its sixth year remains a significant milestone for a project that has transformed far beyond its original token-focused beginnings. 

The Reason XRP Price Isn’t Moving Yet, According to SBI Executive

An executive at Japanese financial giant SBI Holdings said XRP weak price performance may be because of the market waiting for greater regulatory clarity in the United States.

Speaking during SBI Holdings’ Q1 FY2027 earnings presentation, Director Yasuo Nishikawa, who represented Chairman and CEO Yoshitaka Kitao, said the company’s crypto business has remained sluggish as investors wait to see what happens with the U.S. CLARITY Act.

Nishikawa said XRP has been affected. According to him, the token’s price has stayed subdued as investors monitor the progress of the digital asset legislation.

“XRP price is sluggish, remaining subdued, as if waiting to assess the status of the CLARITY Act,” Nishikawa said during the presentation.

His comments suggest SBI believes U.S. regulatory developments could play a major role in XRP’s next price move.

SBI Still Backs Ripple Despite Weak XRP Price

Despite XRP’s muted performance, Nishikawa emphasized the value of SBI’s investment in Ripple.

He said SBI’s stake in the blockchain company is currently worth about 6.6 trillion yen. The valuation highlights the firm’s continued confidence in Ripple even as the crypto market remains slow.

Nishikawa also said SBI’s wider crypto asset business posted weaker earnings because of sluggish market conditions. However, its global crypto market-making business remained profitable.

He added that SBI is continuing to expand its crypto offerings, including stablecoin services and lending products, ahead of an expected recovery in digital asset activity.

SBI Continues Crypto Expansion

Nishikawa said Japan already has a well-established regulatory framework for digital assets. That allows SBI to keep investing in new crypto initiatives while waiting for trading activity to recover.

Among its recent initiatives is the launch of new stablecoin-related services through SBI VC Trade. The company is also planning to acquire Bitbank.

The acquisition is expected to increase SBI’s customer base to around 3 million accounts. Assets under custody would also rise to about 870 billion yen, making the platform one of Japan’s largest crypto exchanges.

XRP Remains Under Pressure

Indeed, XRP has yet to reflect the optimism expressed by SBI. At the time of writing, XRP traded at $1.06. The token was down 1.34% over the past 24 hours, 2.29% over the past week, and 42.31% year to date.

The declines suggest investors are still waiting for stronger catalysts before increasing their exposure to the asset.

Nishikawa’s comments align with the popular view that greater regulatory certainty in the U.S. could be a key catalyst for XRP’s next major price move.

Update on the CLARITY Act

Notably, the CLARITY Act remains under Senate consideration as lawmakers face an Aug. 7 recess deadline. Crypto advocacy group Stand With Crypto says supporters have contacted lawmakers more than 1 million times urging passage.

Meanwhile, the bill continues to face debate over regulatory oversight, state enforcement powers, anti-money laundering rules, and ethics provisions. With limited time remaining, its prospects depend on whether senators can secure enough bipartisan support to advance the legislation.

Shiba Inu Suddenly Wakes Up as SHIB Network Activity Explodes 10x in Two Days

Shiba Inu (SHIB) recorded a dramatic increase in on-chain activity over the past few days, with more transactions, higher trading volume, and larger exchange movements.

The surge points to a large-scale reshuffling of token supply rather than typical retail trading activity. Meanwhile, the spike comes as technical analysts remain cautious about SHIB’s short-term price outlook.

Shiba Inu Network Comes Back to Life After Weeks of Low Activity

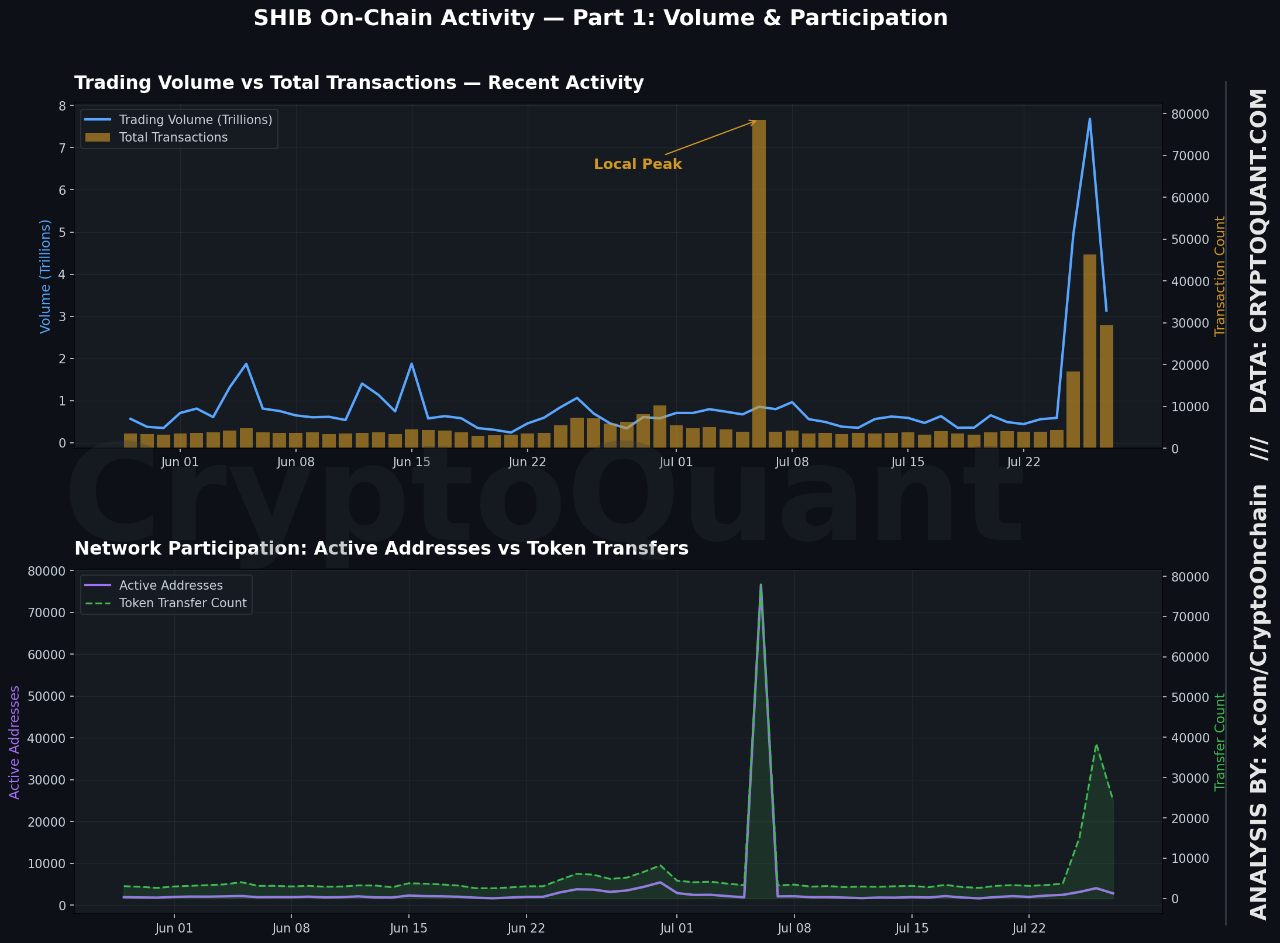
According to CryptoQuant on-chain data, Shiba Inu’s network activity remained relatively quiet for months before accelerating sharply between July 25 and July 26.

Network transactions jumped from around 3,600 on July 24 to more than 38,400 by July 26, representing a more than tenfold increase in activity.

During the same period, total trading volume rose by more than 384% compared with its seven-day average. Daily trading activity expanded from hundreds of billions of SHIB tokens to trillions.

The simultaneous rise across multiple network metrics suggests a major shift in market participation.

Exchange Flows Signal Major Supply Redistribution

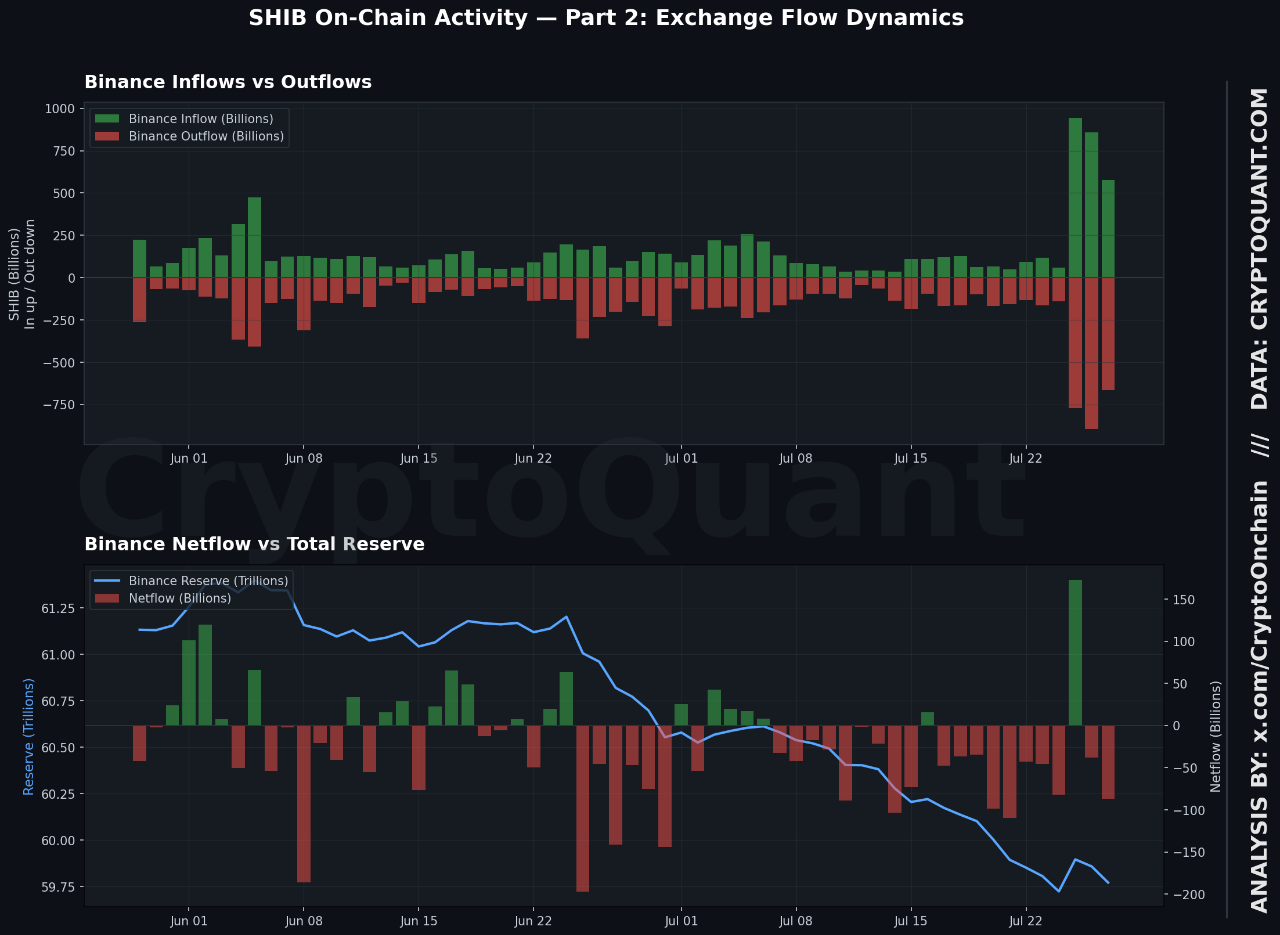
Meanwhile, one of the biggest developments came from Shiba Inu exchange flows. Exchange inflows surged 323% to roughly 943 billion tokens on July 25. Normally, such a move could signal rising selling pressure.

However, exchange outflows increased at nearly the same pace. Binance processed approximately 896 billion SHIB in withdrawals by July 26.

The near balance between inflows and outflows suggests a rapid redistribution of supply across wallets rather than a simple wave of selling.

Large Holders Could Be Repositioning SHIB Holdings

Transaction volume was not the only metric that increased. Active addresses also climbed 44%, showing increased participation across the network during the two-day surge.

The combination of higher transfer activity, increased wallet participation, and balanced exchange flows aligns with the behavior of institutional players, market makers, or large holders adjusting their positions. It appears less consistent with a typical retail buying or selling event.

The higher transfer volumes, more active wallets, and balanced exchange movements suggest that large holders, market makers, or institutions may have been moving funds around rather than regular traders buying or selling.

Where these tokens move next could help determine SHIB’s future price direction. Historically, similar increases in network activity following quiet periods have often preceded significant price movements.

Technical Analyst Remains Bearish on SHIB

Despite the rise in on-chain activity, TradingView analyst Sabri maintains a bearish outlook for SHIB on the four-hour chart.

The analysis shows that SHIB was rejected from the $0.0000057621 resistance zone, which continues to act as a major supply area.

The token has also fallen below the key $0.0000048764 level, and sellers are likely to remain in control as long as SHIB trades below this threshold.

The analyst identifies the next major demand zone near $0.0000025509. A move to that level would represent a potential decline of roughly 45% if current support fails.

Under this scenario, SHIB’s bearish structure would remain intact until the price closes back above $0.0000048764. A four-hour close above $0.0000057621 would invalidate the bearish setup and shift momentum back toward buyers.

At press time, Shiba Inu is trading at $0.000004640, up 11.5% over the past week.

Flare Now Following the Same Pattern XRP Saw Before the 66,000% Surge

0

Amid the ongoing downtrend, the Flare (FLR) token appears to be following the same pattern XRP witnessed before its 2017 rally.

Flare (FLR) remains under pressure as the broader crypto market continues its prolonged decline. Despite this weakness, its long-term chart has started to resemble the pattern XRP formed before its historic rally during the 2017 bull market.

This pattern involves a series of lower highs that XRP recorded before its massive breakout. While matching chart patterns do not guarantee the same outcome, the similarities raise questions about whether FLR could eventually stage a comparable move if market conditions improve.

XRP Built a Series of Lower Highs Before Its Historic Rally

For context, XRP produced one of the biggest rallies in crypto history during the 2017 bull cycle. Specifically, the token climbed from $0.005 in March 2017 to $3.31 in January 2018, delivering a remarkable 66,100% gain in less than a year.

However, before the rally, XRP spent several years forming lower highs. The asset first climbed to $0.0435 in December 2013, marking the peak of its first major bull run. 

XRP Pattern Before 2017 Run

It later dropped during the following bear market before recovering in November 2014. However, this rebound only carried XRP to $0.0280 by December 2014, leaving it below the $0.0435 high reached a year earlier.

After peaking at $0.0280, XRP pulled back again. When it recovered in December 2015, it reached only $0.0091, creating another lower high compared to the December 2014 peak. 

From there, XRP entered a steady decline that pushed the price down to $0.005 in March 2017, where it found its bottom. This low marked the beginning of the token’s historic rally to $3.31, which rewarded investors who held through the long downturn.

Flare Has Traced a Similar Path

Flare now appears to be following a similar pattern. Notably, the token climbed to about $0.048 in February 2024 before meeting resistance and pulling back during a broader market correction.

As the crypto market recovered in November 2024, FLR also moved higher. However, the recovery reached only $0.036 by December 2025, creating a lower high compared to the $0.048 peak recorded in February 2024.

Flare Following the Same Pattern

After reaching $0.036, FLR entered another correction that lasted until April 2025. The token then started another recovery but managed to rise only to $0.0287 in September 2025, forming yet another lower high.

Since reaching $0.0287, FLR has remained in a broader market downturn that has continued to push its price lower. The token now trades around $0.006, which brings it close to the $0.005 level where XRP bottomed before its explosive rally in 2017.

Similar Patterns Do Not Guarantee Similar Results

However, it is important to note that the similarities between the two charts do not guarantee that FLR will repeat XRP’s historic performance. 

The current market environment also differs from the one XRP experienced in 2017. The altcoin market has become much more crowded, with thousands of additional tokens competing for investor capital. Because of that, attracting enough money to fuel a 66,000% rally may be much more difficult for Flare.

However, FLR would not need to match XRP’s full performance to deliver significant returns. If the token achieved just one-quarter of XRP’s historic rally, it would still gain about 16,500% from its current price of $0.006. Such a move would push FLR to a new all-time high of nearly $1.

XRP Records Highest Average Transaction Size Among Top 10 Crypto, Beating Bitcoin and Ethereum

XRP has recorded the highest average transaction size among the top 10 cryptocurrencies by market capitalization.

According to data from the TradingView crypto screener, XRP recorded an average transaction size of $86.68K, the highest among major digital assets. 

Bitcoin, by comparison, posted an average transaction size of roughly $14.2K, while Ethereum stood at around $3.28K. Major stablecoins like USDT and USDC also recorded lower averages than XRP.

Commentators in the XRP community argue that the new figures are a sign of institutional activity on the network.

XRP Sees Larger Transfers Than Bitcoin and Ethereum

The data suggests that while XRP processed fewer transactions than some larger blockchain networks, the average value moved per transaction was significantly higher.

An average transaction size of $86,000 puts XRP well ahead of Bitcoin and Ethereum. This indicates that a large portion of activity on the XRP Ledger currently involves high-value transfers rather than smaller retail transactions.

XRP Outpacing Bitcoin and Ethereum in average transaction | TradingView

Some market participants believe the higher average transaction size could point to increasing institutional involvement. Larger entities often move bigger amounts of capital in individual transactions.

However, average transaction size alone does not confirm institutional participation. Large transfers can also come from exchange wallet movements or crypto whales rather than direct institutional investment.

Additional Network Activity Supports Institutional Narrative

Meanwhile, the rise in XRP’s average transaction size comes alongside broader growth in real-world asset (RWA) and stablecoin activity on the XRP Ledger.

According to RWA.xyz data, the XRP Ledger attracted $2.6 billion in new tokenized real-world asset value over the past six months, ranking second among all blockchains. The network’s total RWA value has now grown to $4.38 billion, highlighting increasing adoption of tokenized assets.

Stablecoin activity has also accelerated. Stablecoin transfer volume on the XRP Ledger increased 10.8% over the past 30 days to $4.28 billion, while the total stablecoin market capitalization reached $926 million. 

Ripple’s RLUSD accounts for about 94% of the network’s stablecoin market, strengthening XRP Ledger’s role in payments and institutional financial activity.

These trends suggest that the network is seeing growing use for larger-value transfers, tokenized assets, and settlement-focused applications.

XRP Price Holds Around $1.07

The TradingView data comes as XRP trades near $1.07. The token is down about 0.6% over the past 24 hours, with a market capitalization of roughly $67.1 billion.

If the trend continues alongside other positive on-chain signals, such as rising active addresses and healthy exchange flows, it could strengthen the view that institutional capital is increasingly moving through the XRP Ledger for large-value transactions.

Hoskinson Says Cardano Is Stronger Than 2024 Technically but Weaker in Market Reputation

0

Cardano founder Charles Hoskinson has compared the blockchain’s current state with its performance in 2024. 

Speaking during a recent livestream, Hoskinson said Cardano is far stronger from a technical standpoint than it was in 2024. He credited the ecosystem’s continued innovation, particularly the upcoming Ouroboros Leios upgrade, as evidence of the network’s engineering progress.

Currently undergoing testing, Leios is expected to significantly increase Cardano’s transaction throughput and scalability. Once deployed, the upgrade could reinforce the blockchain’s reputation as one of the industry’s most research-driven networks. 

However, Hoskinson acknowledged that these technical achievements have not translated into stronger market performance or wider industry recognition.

According to him, Cardano’s brand, market position, and overall level of respect within the crypto industry remain below where they should be. While praising the ecosystem’s engineering accomplishments, he stressed that Cardano must make important strategic decisions if it hopes to regain its competitive edge.

Cardano Has Lost Ground Since 2024

Hoskinson’s remarks come as Cardano continues to recover from a prolonged market decline.

Following the 2024 U.S. election, ADA emerged as one of the market’s strongest-performing cryptocurrencies, climbing to $1.31 and comfortably holding a position among the industry’s top 10 digital assets. 

Since then, however, the token has experienced a sharp downturn. ADA currently trades around $0.17, representing a 87% decline from its December 2024 peak. The cryptocurrency has also slipped to become the 14th-largest digital asset by market cap.

Beyond the price decline, Cardano has faced several ecosystem challenges, including project shutdowns, EMURGO’s withdrawal from Pentad, and ongoing governance-related controversies that have weighed on community sentiment.

Hoskinson Pledges to Push Cardano Forward

Despite the setbacks, Hoskinson made it clear that he has no intention of slowing down.

Addressing the Cardano community, he said he plans to continue to advance the ecosystem regardless of whether everyone agrees with his approach. He emphasized that he already knows the direction he wants to pursue and invited supporters who share his vision to help execute it rather than wait for universal consensus. 

He also urged the community to focus on getting ADA “back on track” and restoring what he described as Cardano’s winning culture.

Reaffirming his long-term confidence in the project, Hoskinson described Cardano as a blue-chip blockchain that has already secured its place among the industry’s foundational networks. In his view, changing market cycles and growing competition will not diminish the network’s long-term relevance.

Governance Reform Forms Part of His Strategy

As part of his broader plan to revive Cardano’s momentum, Hoskinson revealed that he intends to establish a political party that would create a Delegate Representative (DRep) to participate directly in Cardano’s on-chain governance.

He believes this initiative could help counter what he sees as growing cynicism and pessimism within the ecosystem while encouraging more constructive participation in governance.

According to him, stronger leadership and clearer strategic direction will be essential if Cardano is to strengthen its market position and restore confidence among investors and the broader crypto community. 

XRP Keeps Pushing, Looking to Breach the Yearly Downtrend Resistance

XRP is nearing a key technical level after months of selling pressure.

Hopes are rising that it will finally break above a downward trendline that has acted as resistance for the past year.

A three-day TradingView chart shows XRP trading at a bottom, testing a resistance line that has held it back since mid-2025. A breakout above this formation would shift the market structure into a new uptrend. However, another rejection could send XRP price to lower levels last seen in 2024.

XRP Holds Key Support

The chart shows XRP trading just above a major support zone between $1.03 and $1.05. Buyers have defended this area three times since May, preventing XRP from breaking below it.

For context, the major market drawdown from late May into early June saw XRP fall to $1.0547 without breaching the $1.00 mark. It soon recovered to $1.289 in mid-June. However, bearish momentum returned, causing XRP to fall to $1.0098, its lowest price since November 2024.

Bulls stepped in to defend the $1.00 level once again, helping XRP recover to $1.181 shortly afterward. Since then, it has remained around the $1.10 range. Meanwhile, three days ago, XRP dipped again to $1.0459 on July 28, with bulls stepping in once more to defend support.

That repeated defense has given bulls a foundation from which to challenge the descending resistance. However, the long-term trend remains bearish until XRP posts a convincing close above the falling trendline.

Image

Where it Sits Now

According to present data, XRP was trading at $1.07 at the time of writing. The token was down 0.3% over the past 24 hours and 4% over the past seven days.

Despite the recent pullback, XRP has gained 3.06% over the past month. However, it is still down 41.65% year-to-date, highlighting the decline from last year’s highs.

How Low Could XRP Go if the Breakout Fails?

With XRP trading in a tightening range below the descending trendline, a move above it could strengthen bullish momentum and open the door to higher resistance levels. However, if the breakout fails, XRP could remain trapped in its longer-term downtrend, with the price potentially falling below $1.00.

Technical analyst Casi recently said XRP is following the bearish scenario she previously outlined. She expects a break below $1.00, with downside targets at the 0.786 Fibonacci retracement level equivalent to $0.87.

Other market watchers, including Ali Martinez and ChartNerd, have expressed similar views, calling for XRP to drop to $0.70 before the next major uptrend begins.

Whale Activity

Meanwhile, a recent report by The Crypto Basic found that XRP whale activity on Binance has dropped significantly, with both large inflows and outflows declining. The slowdown suggests that major investors are staying on the sidelines rather than accumulating or selling.

Transactions involving more than 100,000 XRP—especially those exceeding 1 million XRP—have declined significantly. With whales largely inactive, the market is in a “waiting phase,” showing no clear signs of either accumulation or distribution.

Mid-term Historical Data Suggests How XRP Could Perform in August and September 2026

0

Historical data on how XRP has historically performed in midterm years provide hints into how the asset could perform in August and September 2026.

XRP remains under selling pressure after falling from its July 2025 peak of $3.60. The token currently trades at $1.07, leaving it down by more than 70% from the high it reached last July. The extended decline has kept market sentiment weak, with investors awaiting signs of a recovery.

XRP Following a Familiar Pattern in Mid-term Years

As the downtrend moves into its 12th month, historical chart data suggests a possible repeat of past market cycles. Previous trends suggest XRP could face another month of losses in August 2026 before recovering part of its decline in September.

Data from previous market cycles show that XRP has regularly struggled in August during mid-term years before rebounding after the summer. This pattern has appeared several times since 2013, particularly during 2014, 2018, and 2022.

Although each cycle had its own market conditions, they all followed a similar path. Specifically, XRP posted gains in July, lost ground in August, and then recovered much of those losses in September. However, these rebounds did not immediately lead to a full market recovery.

How XRP Performed in 2014

During the downtrend that continued into 2014, XRP delivered a strong 36% gain in July 2014. However, the recovery did not last long. In August 2014, the token dropped 5.69%, extending the market weakness.

The selling pressure continued into September 2014, when XRP declined by another 4.51%. After that, the market changed direction. 

Beginning in October 2014, XRP recorded three straight monthly gains for the first time since its 2013 launch. During that rally, the token climbed 495%, rising from $0.0047 in October 2014 to $0.0280 by December 2014 before giving back part of those gains.

The Same Trend Appeared in 2018 and 2022

A similar pattern played out during the 2018 market downturn. After remaining under pressure for months, XRP fell another 23% in August 2018, adding to the ongoing losses.

After reaching $0.3349, the token began to recover once summer ended. In September 2018, XRP jumped 73% to $0.5812. Despite the strong rebound, the recovery did not last. The price later turned lower again, and the broader downtrend remained in place.

XRP Performance in Mid-term Years

Meanwhile, during the 2022 downtrend, which became even more severe after the May 2022 Terra ecosystem collapse, XRP saw losses in the first half of the year. However, the asset managed to post a 14.42% gain in July 2022.

This recovery proved temporary. In August 2022, XRP fell 13.74%, continuing the pattern seen in previous mid-term years. 

Once August ended, buyers returned, pushing the token up 46.79% in September 2022. However, this move did not start a full bull market. Instead, XRP later pulled back again, while the broader bull run only began in November 2024, about two years later.

What the Pattern Could Mean for XRP in 2026

The current market cycle shares several similarities with those earlier mid-term years. XRP has remained in a prolonged downtrend throughout 2026, although July 2026 appears set to end with a modest gain. So far, the token has risen 3.91% during the month.

If the historical pattern repeats, XRP could once again come under pressure in August 2026 as July draws to a close. History also suggests the token could recover in September 2026, as it did during previous mid-term years. 

However, earlier cycles show that these post-summer rebounds did not mark the end of the broader downtrend or the beginning of a new bull market. Instead, XRP usually gave up part of those gains before eventually entering a stronger and more sustained recovery.