Home Blog Page 58

XRP Has Added $1B Worth of Asset-Backed Credit in 2026

0

The XRP ecosystem has welcomed about $1 billion in tokenized asset-backed credit so far in 2026, already outpacing the total from the previous year.

This trend comes as the XRP Ledger (XRPL) continues to witness an increase in tokenized asset value this year amid the growing attention that has enveloped the narrative. For instance, BlackRock CEO Larry Fink argued in January that the tokenization of RWA is inevitable.

According to RWA.xyz, a leading provider of tokenized RWA data, the tokenized asset-backed credit market has grown to a total value of $42.78 billion from just $9.35 billion at the beginning of last year, 2025. Essentially, the market has added over $33 billion in less than two years.

Tokenized Asset Backed Credit Market
Tokenized Asset Backed Credit Market | RWAxyz

XRP Adds $1B in Asset-Backed Credit

Amid the uptrend, the XRP Ledger appears to be making a massive contribution. Notably, the XRP ecosystem currently boasts $1.5 billion worth of tokenized credit. This represents a 3.61% market share when considering total credit, and a 22% share in terms of represented credit value.

Interestingly, at the start of this year, XRP only hosted $552 billion worth of tokenized credit. The latest figure indicates that the network has added about $1 billion in asset-backed credit over the past seven months of this year.

XRP Ledger Within Credit Market

This is an incredible boost from the growth recorded last year. Specifically, the XRPL only saw an increase of over $500 billion worth of credit throughout 2025. The most recent growth shows that the ecosystem has already doubled its 2025 growth this year, with five more months to go.

For the uninitiated, tokenized asset-backed credit represents debt that issuers convert into digital tokens and back with a pool of real financial assets instead of unsecured loans. These assets can include consumer loans, mortgages, and other income-generating financial assets that serve as collateral for the debt.

Overall RWA Growth

Besides tokenized credit, the XRP ecosystem has also continued to record impressive growth in other RWA areas, especially commodities, stablecoins, corporate credit, and U.S. Treasury Debt. 

For instance, tokenized commodities on the XRP Ledger have grown to a whopping $2.5 billion, representing nearly 61% of the total RWA value resident on the network at $4.1 billion. Most of this commodity value comes from the JMWH product from Justoken, worth more than $2.2 billion.

Meanwhile, the growth of the Ripple stablecoin, RLUSD, on the XRPL has contributed to a massive uptick in stablecoin value across the ecosystem. With $877 million worth of RLUSD now residing on the network, the XRPL currently hosts a total of $968 million in overall stablecoin market cap, already close to the $1 billion milestone.
XRP Downtrend Nears Completion as Price Sits at Extreme Opportunity Buy Zone

0

XRP selling pressure is dwindling, suggesting bearish exhaustion, as prices sit at an extreme opportunity buy zone on the daily chart.

XRP has spent nearly a year moving through a deep corrective phase after reaching its cycle high in mid-July 2025. Looking at the chart structure today, recent price action suggests that the downtrend is approaching its final stages.

XRP Selling Pressure Has Faded Significantly

Chart analysis suggests that XRP is no longer behaving like an asset trapped in a strong bearish trend. Instead, it appears to be building a base near historical levels for the next uptrend phase.

One of the notable confirmations of this is how selling pressure has declined through the ongoing corrective phase. Data shows that the most aggressive selling volume appeared immediately after XRP reached its all-time high of $3.66 on July 18, 2025.

The volume spike marked the beginning of the broader correction and reflected heavy distribution from market participants. However, recent market activity tells a very different story. 

As XRP approached its lowest levels in years during the June 26 drop to $1.009, bearish trading volume had fallen dramatically. The peak bearish volume recorded was 421,000 XRP. Days before the June dip, the trading volume had dropped to 105,000 XRP, which is roughly four times lower than what was seen during the initial stages of the downtrend.

Notably, this shift matters because sustained selling pressure usually accompanies strong bear markets. In XRP’s case, the opposite is happening. Prices continued to make new lows while selling momentum declined substantially, signaling gradual exhaustion.

XRP at Extreme Opportunity Buy Zone

Further analysis suggests that XRP completed the steepest part of its correction months ago. Since the July 2025 peak, the coin has traded within a falling wedge, persistently making lower highs and lower lows.

XRP Accumulation Zone

However, since the broader crypto market crash in February, XRP has largely consolidated, reflecting a market that is no longer dominated by aggressive sellers. Price action has remained in a range, suggesting that the earlier distribution is nearing its completion.

At current levels, XRP has entered an extreme opportunity zone from a long-term perspective. Here the risk-to-reward ratio looks very appealing, with long-term holders already taking advantage of this rare chance to buy at a very low price.

It bears mentioning that the longer XRP spends consolidating around the current levels, the more significant the eventual breakout would be once momentum returns.

Possible Recovery Targets

When momentum starts to return, the result could be notable for XRP. One of the possible recovery targets is the level around $3, a 165% increase from the current price of $1.135.

A sustained hold above this level opens the path for a 224% rally to retest the all-time high of $3.66. Notably, these are long-term targets and would require broader market recovery momentum to come to fruition.

Interestingly, XRP is not moving in isolation from the broader crypto market. Comparing its current structure with other major digital assets such as Bitcoin and Ethereum shows similar signs that the bearish phase is nearly complete. This suggests the market is simply gearing up for the next breakout to higher levels.

Shiba Inu Stabilizes Near Historic Lows, but Bears Retain Control Below Key Level

0

Shiba Inu continues to trade under strong bearish pressure, with its broader market structure still pointing lower despite early signs that selling momentum may be easing.

This assessment comes from market commentator Dukes Markets Analysis, who shared the outlook in a recent TradingView publication titled “SHIB: From Meme Queen to New Historic Lows.”

Bearish Trend Remains Firmly Intact for Shiba Inu

According to Dukes, Shiba Inu remains below both its 50-day and 100-day Exponential Moving Averages (EMAs), two widely used indicators for identifying the prevailing market trend.

More importantly, the 50-day EMA continues to trade below the 100-day EMA, maintaining a bearish crossover that typically signals sellers remain in control of the market.

As long as SHIB stays beneath both moving averages, the broader technical structure continues to favor further downside. Consequently, any short-term price rebounds are likely to be corrective rallies rather than the beginning of a sustained bullish reversal.

Shiba Inu Must Reclaim a Key Resistance Level: Dukes

Despite the prevailing bearish outlook, Dukes identified $0.00000458 as the first major resistance level bulls must reclaim.

This price previously served as a strong support zone before breaking down and subsequently turning into resistance. He suggests that a decisive breakout above $0.00000458, followed by a strong daily close, would mark the first meaningful improvement in SHIB’s market structure and suggest buyers are beginning to regain control.

Until then, however, the dominant bearish trend remains unchanged.

Shiba Inu TradingView Chart

Momentum Indicators Hint at a Potential Recovery

Although the overall trend remains negative, several momentum indicators suggest selling pressure may be easing.

The Relative Strength Index (RSI) has started to recover after previously falling into weaker territory. However, it still trades below the neutral 50 level, indicating bearish momentum continues to outweigh bullish strength despite the recent improvement.

Meanwhile, the Stochastic RSI (StochRSI), which measures the speed and momentum of price movements, continues to climb steadily without entering overbought territory. This suggests SHIB could have additional room for a short-term recovery before bullish momentum becomes overstretched. 

Another Major Barrier Awaits Bulls

Even with improving momentum readings, Dukes noted that Shiba Inu’s trading volume remains relatively subdued, highlighting the lack of strong conviction from either buyers or sellers.

He emphasized that any breakout above the immediate resistance would require significantly stronger buying activity to confirm a sustainable recovery rather than another temporary bounce.

Even if SHIB successfully reclaims the $0.00000458 resistance level, Dukes believes another significant challenge lies around $0.00000520. This price marks the next major resistance zone, where sellers could once again step in and cap further gains. As a result, bulls would likely need to overcome both resistance levels before Shiba Inu can establish a more convincing medium-term recovery.

SHIB Still Trades Far Below Its Record High

At press time, Shiba Inu remained significantly below its all-time high of $0.00008845. Trading around $0.00000424, the token has declined 95.2% from its peak.

While SHIB has gained a modest 1.04% this month, it remains down 38.58% since the start of the year. The token currently ranks as the 31st-largest cryptocurrency by market capitalization, a notable decline from late 2021, when it consistently ranked among the world’s top 10 digital assets.

Meanwhile, trading activity continues to weaken, with daily volume falling 6.08% over the past 24 hours to $42.98 million, underscoring the lack of strong market participation despite tentative signs of improving momentum. 

XRP Now Seeing Return of Leveraged Activity as OI Z-Score Shoots Up

0

XRP remains under pressure as its downtrend continues, but new derivatives data suggests that leveraged trading activity is picking up again. 

While bulls continue to wait for a relief rally, the latest figures show that traders are becoming more active in the futures market, and this change could influence XRP’s next move.

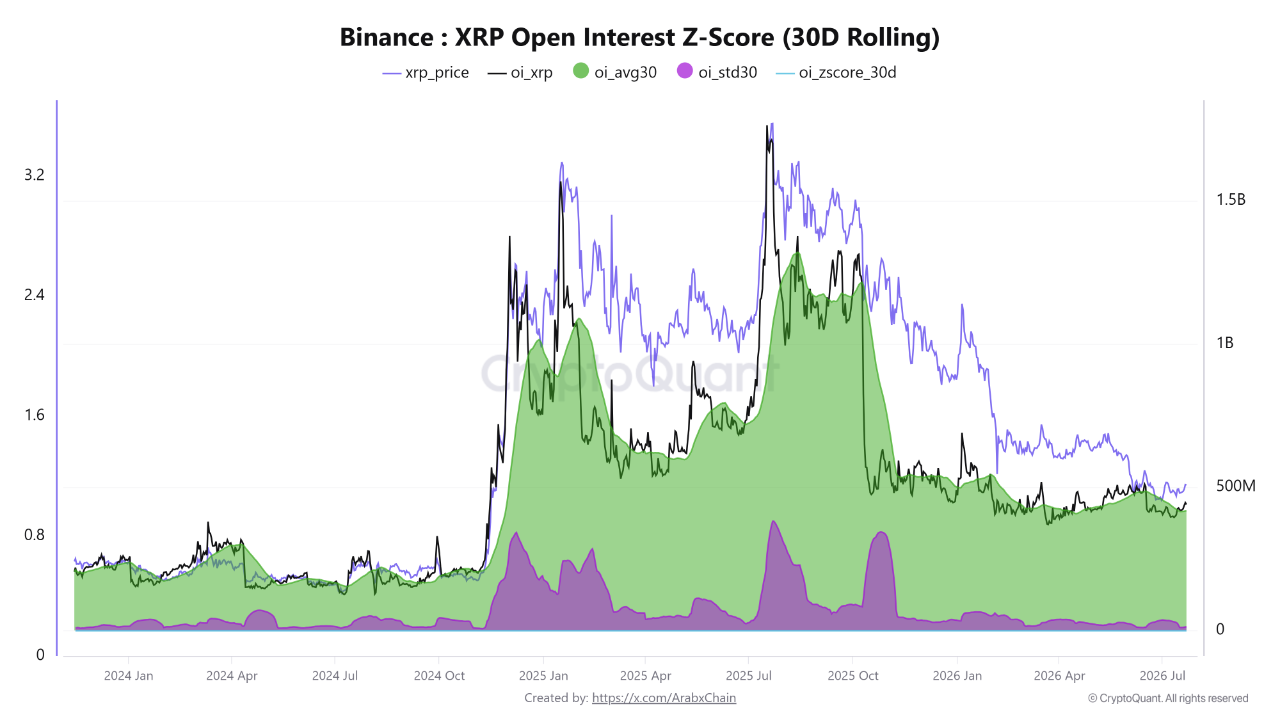
In a recent disclosure, CryptoQuant analyst Arab Chain reported that the 30-day Open Interest (OI) Z-Score for XRP futures on Binance has risen to about 1.60. 

XRP Open Interest Z-Score CryptoQuant
XRP Open Interest Z-Score | CryptoQuant

The analyst also confirmed that total open interest has climbed to roughly 440.6 million XRP, compared with a 30-day moving average of 418.5 million XRP. 

In addition, XRP’s standard deviation has reached about 13.8 million tokens, and this indicates that participation in the derivatives market has increased over the past month.

More Traders Return as Open Interest Moves Higher

According to Arab Chain, the higher Z-Score means that open interest now sits above its 30-day historical average. This suggests that the XRP futures market is witnessing a quicker return of leveraged trading and stronger participation.

However, the analyst stressed that current activity remains far below what the market recorded during XRP’s 2025 peak. 

At that time, open interest climbed above 1 billion XRP, and XRP also enjoyed a strong price rally. Although trader participation has improved, it still has a long way to go before reaching those earlier levels.

Arab Chain believes that if the price and open interest continue to rise together, it could show growing confidence among traders and support a stronger bullish trend.

On the other hand, the analyst warned that rising open interest without a matching increase in price could indicate that traders are taking on more leveraged speculative positions. 

If this happens, the market could become more vulnerable to large liquidation events, leading to sharper price swings in either direction.

XRP Remains Stuck in a Tight Trading Range

Meanwhile, data from the XRP daily chart shows that the token is still waiting for a clear breakout. At the time of the report, XRP traded near $1.13, with buyers and sellers remaining evenly matched.

XRP trades above the 20-day Exponential Moving Average (EMA20) at $1.11 but remains below the 50-day Exponential Moving Average (EMA50) at $1.1448. The longer-term 200-day Exponential Moving Average (EMA200) stands at $1.43, showing that the trend still faces strong resistance.

XRP Daily Chart
XRP Daily Chart

Further, the Relative Strength Index (RSI) stands at 55.24, staying above the midpoint but without showing strong momentum. At the same time, the MACD remains almost flat, with the MACD line at 0, the signal line at -0.01, and the histogram at just +0.01.

Notably, XRP now faces two possible paths. A daily close above $1.15 alongside stronger trading volume could open the door to $1.16 and later the $1.25-$1.30 range. However, if XRP falls below $1.11, the next downside target could be $1.06, with $1.00 acting as the final major support.

XRP Inverse Head-and-Shoulders Targets 16% Move to $1.32

0

XRP has formed an inverse head-and-shoulders pattern on the daily chart, with its completion targeting a 16% move to $1.32.

The setup comes amidst the recent price rebound. Notably, from the lows of $1.05 on July 13, XRP has rebounded nearly 8% to its current price. Chart analysis shows that this move completed a bullish formation, one that could potentially take the coin to higher prices.

XRP Inverse H&S Pattern Formation

On the daily chart, XRP has formed an inverse head-and-shoulders (H&S) pattern. The formation follows a rejection from a key support area at $1.32 in early June. 

Notably, this demand zone has held XRP since the February crypto market crash, with each price weakness halting there. However, bears forced matters on June 1 and eventually pushed XRP below the support.

The consequent dip to $1.05 on June 6 started the inverse H&S pattern. There, the coin formed the left shoulder before a short-term rebound. The pattern’s head formed during the drop to $1.009 on June 26. Buying pressure stepped in to prevent a decline below the psychological $1 price mark, with XRP subsequently recovering.

The right shoulder formation built on the inverse head-and-shoulders pattern. Following the drop to $1.05 again on July 13, XRP rebounded from the support area again, confirming the bullish structure.

XRP Inverse H&S Pattern Formation

An inverse head-and-shoulders pattern suggests that selling pressure is declining as prices stop making lower lows. It is usually a trend reversal formation, signaling the gradual transition from a downtrend to an uptrend.

Trendline Breakout Confirms Bullish Structure

The completion of the inverse H&S formation saw XRP break above a downward-sloping trendline that has capped recoveries since May. After the high of $1.36 on May 30, XRP has made lower highs, each aligning closely with this trendline.

However, this resistance gave way on July 21 when XRP rallied approximately 3% to complete the right shoulder. This breakout confirms that momentum is now with the bulls, and its sustenance opens the path to higher prices.

The key level to watch is $1.09. As long as XRP stays above this area, the breakout and the inverse H&S pattern remain intact. Meanwhile, the upward target for the bullish formation is reclaiming $1.32, representing a 16% increase from the current price of $1.13.

XRP Whales Extensively Accumulating

Another bullish development that could fuel a price uptrend is the growing dominance of XRP whales on exchange outflows. A recent report shows that whales accounted for 77.8% of all XRP withdrawals from centralized exchanges on July 22.

Whales have a reputation for holding longer than retail. As such, when large holders increasingly shift an asset away from exchanges, it has a lasting impact on available supply. It also signals accumulation, reinforcing confidence in XRP’s future trend among key market participants.

Futures data is also showing renewed derivative interest in XRP. Over the past 3 days, traders have opened more futures positions than they have closed, with the percentage net change showing a staggering 452% increase. Inflows stand at $1.10 billion and outflows at $1.04 billion, reflecting a net inflow of $59 million.

XRP Futures Flow/CoinGlass

Coinbase Moves 1,163,213,299,134 Shiba Inu Tokens in Minutes

0

Coinbase has transferred more than 1.16 trillion Shiba Inu tokens through three large transactions, drawing attention from on-chain observers.

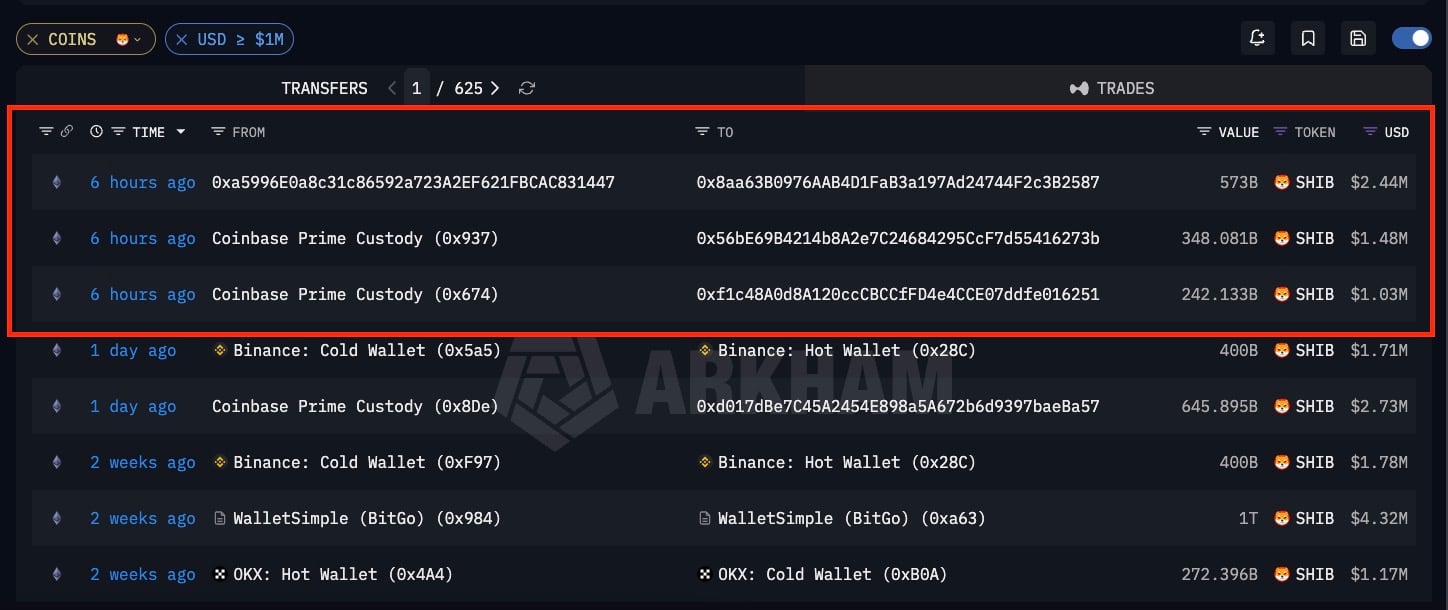
According to blockchain data from Arkham Intelligence, the Shiba Inu transfers did not pass through the spot market order book. Instead, Coinbase moved the tokens from its Prime Custody wallets to three newly created wallets with no prior transaction history, suggesting the transfers were internal rather than customer-driven market transactions.

Coinbase Massive Shiba Inu Transfers 

The first transaction saw Coinbase transfer 242,132,753,815 (242.13 billion) SHIB from its Coinbase Prime Custody wallet (0x674) to a newly created wallet. Shortly afterward, the exchange moved another 348,080,545,216 (348.08 billion) SHIB from the Coinbase Prime Custody wallet (0x937) to a different newly created address.

The largest transfer involved 573,000,000,103 (573 billion) SHIB, which originated from an unmarked wallet (0xa59) during the same hour as the first two transactions. Although this address was not explicitly labeled as a Coinbase wallet, blockchain analysts believe the transfer was also initiated by Coinbase because of its timing and transaction pattern.

Combined, the three transactions totaled 1,163,213,299,134 (1.16 trillion) SHIB, all completed within 30 minutes. 

Coinbase Shifts 1.16 Trillion Shiba Inu Tokens

Internal Custody Management Likely Behind the Transfers

The transactions appear to represent an internal wallet reorganization rather than buying activity.

Large cryptocurrency custodians and exchanges routinely distribute digital assets across newly created wallets to strengthen security, optimize liquidity management, and improve operational efficiency. 

Since the transfers occurred between wallets believed to be controlled by Coinbase, they are not considered direct indicators of market demand or selling pressure. As of press time, all three newly created wallets continue to hold the transferred SHIB tokens, with no subsequent outbound transactions recorded. 

Coinbase’s wallet reshuffle comes shortly after Binance conducted a similar internal transfer involving 400 billion SHIB. Like the Coinbase transactions, Binance’s move appeared to be an operational wallet reallocation rather than an exchange sale.

SHIB Continues Push to Reclaim Top 30 Ranking

Meanwhile, Shiba Inu continues its effort to regain a position among the world’s 30 largest cryptocurrencies by market capitalization.

At press time, SHIB ranks 31st in the global crypto standings with a market cap of $2.49 billion. The meme-inspired cryptocurrency trails Tether Gold (XAUt), which currently ranks 30th with a market value of around $2.52 billion.

SHIB is trading at $0.000004231, while its 24-hour trading volume has spiked 5.74% to $43.56 million, reflecting sustained market activity as investors monitor both on-chain movements and broader market conditions. 

XRP Holds Ascending Triangle Support as Monthly Chart Points to $6.44 and $8.76 Targets

0

XRP has continued to maintain support within an ascending triangle over the past eight years, with chart data pointing to new price targets.

Currently, XRP changes hands at $1.13, up more than 9% this month after opening at $1.0385. Since the start of July, it has reached a high of $1.1828 and a low of $1.0210. 

While the strong monthly gain shows promise, a more impressive milestone is XRP’s ability to remain within a multi-year ascending triangle that has been developing since 2018. 

Eight-Year Pattern Continues to Hold

Specifically, the monthly chart features an ascending triangle that has formed for about eight years. Notably, the lower trendline has continued to rise from the 2017 lows, connecting higher lows during the 2019 correction, the 2020 accumulation phase, and the 2022 bear market bottom.

Each new low formed above the previous one, showing that buyers have consistently entered the market at higher prices through several market cycles. This pattern suggests that long-term demand has remained strong. 

Meanwhile, the upper trendline has acted as a flatter resistance level since the 2018 peak of around $3.3, stopping every major rally that followed.

XRP Ascending Triangle

XRP moved above this resistance during 2024 and climbed beyond $3.6 in July 2025 before pulling back into the triangle during the ongoing correction. Even amid the retreat, the current price of $1.1314 remains safely above the rising lower trendline. 

XRP Fibonacci Levels Show the Next Key Price Zones

The Fibonacci retracement levels measure the move from $0.4094, which marks the 0 level, to $3.5733, representing the 1.0 level. 

Based on this range, XRP currently trades between the 0.33 retracement at $0.8369 and the 0.618 retracement at $1.5620, placing the price in the lower part of the highlighted retracement area.

The $0.8369 level now serves as the main support that buyers need to defend. Holding above this level supports the view that the pullback from the 2024 breakout is a normal correction instead of a breakdown of the larger trend.

The next major resistance sits at $1.5620. A monthly close above that level would suggest that the correction may be coming to an end. Above it, the 0.786 Fibonacci level at $2.2477 and the 0.888 level at $2.8035 mark the next resistance zone.

$6.44 and $8.76 Become the Main Upside Targets

The 1.0 Fibonacci level at $3.5733 lines up with the upper resistance of the ascending triangle. This level rejected XRP during the 2018 market peak and also limited the 2024 breakout attempt. 

A confirmed monthly close above $3.5733 would clear this long-standing resistance and shift attention to the next Fibonacci extension targets.

The first extension target stands at the 1.272 Fibonacci level of $6.4413, which represents the first major objective after a confirmed breakout above the triangle. Meanwhile, the next target appears at the 1.414 extension of $8.7614.

Bitcoin Outlook Improves as Exchange Inflows Stay Low, BlackRock IBIT Draws $557M

Bitcoin short-term outlook is improving as mid-sized investors are not sending large amounts of BTC to exchanges.

At the same time, BlackRock’s spot Bitcoin ETF continues to see steady demand from institutional investors.

Bitcoin Exchange Inflows Remain Below Previous Sell-Off Levels

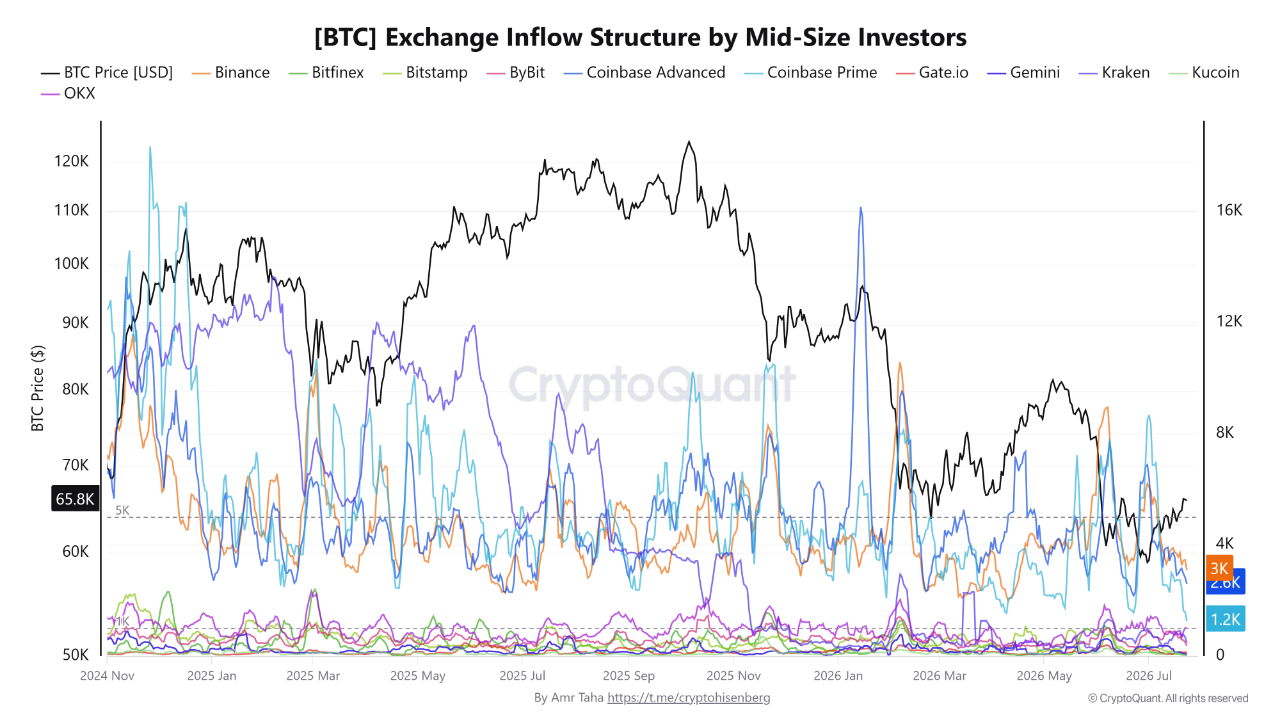
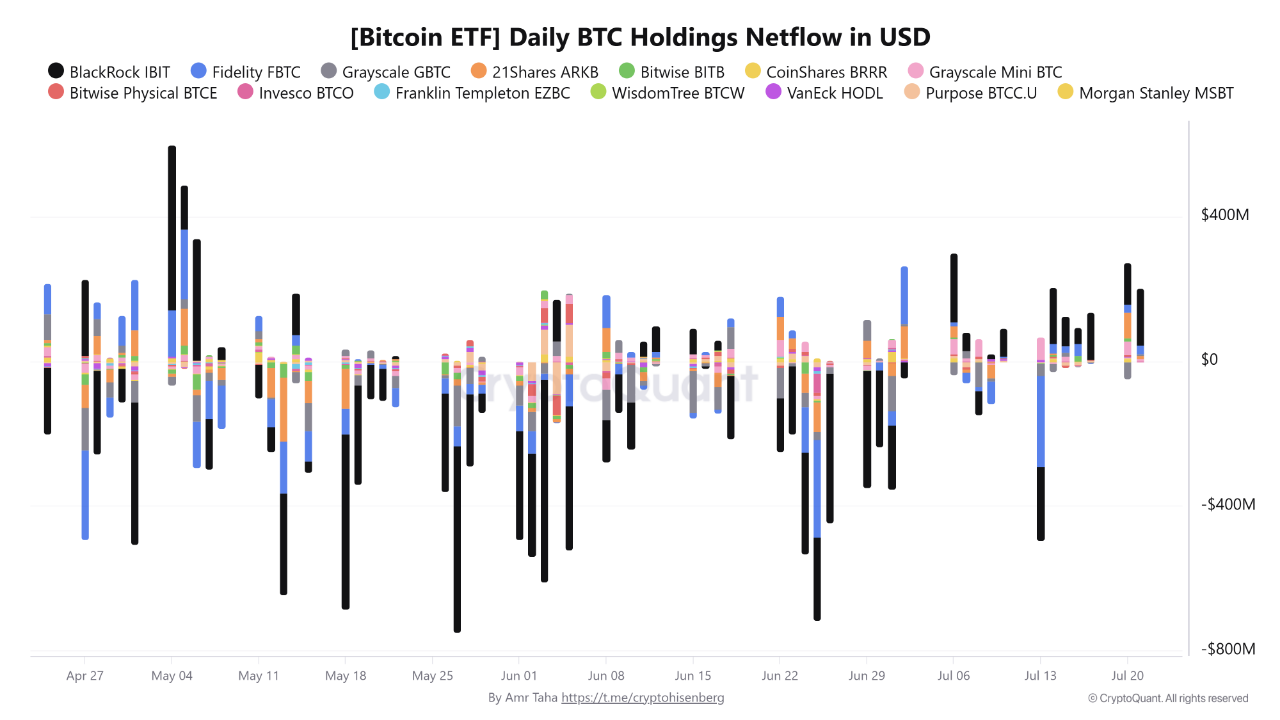
CryptoQuant analyst Amr Taha revealed Bitcoin inflows from mid-size investors remain below, or close to, the levels seen on June 22. That reduces the likelihood of a sell-off similar to previous market corrections.

On July 23, Binance recorded inflows of 3,000 BTC, down from 3,446 BTC on June 22. Coinbase received 2,600 BTC, slightly higher than its previous 2,170 BTC. Coinbase Prime recorded 1,264 BTC, below the earlier 1,560 BTC.

Combined inflows across the three platforms reached 6,864 BTC. That was slightly below the 7,176 BTC the market saw on June 22.

The gap between Binance and Coinbase also narrowed. It fell from 1,276 BTC to just 400 BTC, suggesting selling activity was spread more evenly across exchanges.

Taha said previous Bitcoin corrections in October 2025 and January 2026 were marked by sharp inflow spikes on a single exchange. Those concentrated inflows created localized selling pressure.

This time, no similar spike has appeared. According to Taha, that suggests the market is not showing the same immediate bearish setup.

With Bitcoin trading near $65,800, the restrained and balanced inflows point to limited short-term selling pressure. This may explain why Bitcoin price only dipped mildly in the past few days amid the correction that followed after its price reached $66,900 two days ago.

BlackRock’s IBIT Extends Inflow Streak

Meanwhile, institutional demand also remained strong through U.S. spot Bitcoin ETFs. BlackRock’s iShares Bitcoin Trust (IBIT) attracted about $557 million in net inflows across four consecutive positive trading sessions between July 14 and July 21.

The fund added about $155 million on July 14, $131 million on July 17, $114 million on July 20, and $157 million on July 21. The final three sessions accounted for roughly $402 million of the total.

Demand extended beyond BlackRock. On July 20, 21Shares’ ARKB attracted about $70 million. Together, the two funds recorded roughly $184 million in inflows that day.

Consistent BTC ETF Demand Supports Bullish Outlook

Rather than focusing on a single large inflow, Taha said the more important signal is the consistency of positive ETF flows over several trading sessions.

If spot Bitcoin ETFs continue attracting capital at similar levels, it would point to sustained institutional demand. Combined with muted exchange inflows, that could reinforce the constructive outlook and ease concerns about near-term selling pressure.

Whales Accumulate 30 Million ADA as Cardano Flips Stellar to Reclaim Top 15 Position

0

Large Cardano investors significantly increased their holdings over the past week, signaling growing confidence in ADA’s near-term outlook.

According to on-chain data from Santiment, Cardano wallets controlled by large holders accumulated more than 30 million ADA over the past seven days. The data also shows that whale holdings steadily climbed to 5.69 billion ADA, suggesting consistent accumulation rather than isolated purchases.

Image

Whale accumulation often draws market attention because these investors have the financial resources to influence price trends. Although sustained buying does not guarantee an immediate price rally, it generally reflects growing confidence among major market participants and is often viewed as a bullish on-chain signal.

Accumulation Extends an Ongoing Trend

The recent buying activity is part of a broader accumulation trend rather than a one-off event. Cardano whales have remained highly active in recent weeks as they continue to expand their exposure to ADA.

Previously, The Crypto Basic reported that wallets holding between 100,000 and 100 million ADA increased their combined balance to 25.6 billion ADA, the highest level in more than three and a half years.

The addition of another 30 million ADA further strengthens the view that major holders are positioning themselves ahead of a potential market move.

Cardano Reclaims a Spot Among the Top 15 Cryptocurrencies

Meanwhile, renewed whale accumulation has coincided with improving sentiment across the broader crypto market, helping Cardano regain ground in the market-cap rankings.

Notably, ADA overtook Stellar (XLM) to reclaim its position as the 15th-largest cryptocurrency by market capitalization. Cardano currently boasts a market cap of $6.39 billion, narrowly edging past Stellar’s $6.30 billion valuation.

Moreover, the gap separating Cardano from the projects immediately above it remains relatively small. Chainlink (LINK), ranked 14th, has a market capitalization of $6.43 billion, while Monero (XMR) occupies the 13th position with a valuation of $6.61 billion. If ADA maintains its current momentum, it could challenge both cryptocurrencies in the coming days. 

Cardano Re-enters Top 15 Crypto Rankings

Hoskinson Still Expects a Return to the Top 10

Cardano founder Charles Hoskinson has also remained optimistic about the project’s long-term prospects. He recently reiterated his belief that ADA could re-enter the top 10 cryptocurrencies by market cap before the end of the year.

To achieve that milestone, Cardano’s market value would need to surge 76.05% from its current level of $6.39 billion to around $11.25 billion, assuming the market cap of Dogecoin, the current 10th-largest cryptocurrency, remains unchanged. Under that scenario, ADA would surpass Dogecoin to reclaim a place among the industry’s top 10 digital assets.

At press time, ADA trades at $0.1752, up 0.97% over the past 24 hours. The cryptocurrency has also spiked 6.30% over the past seven days, reflecting improving market momentum alongside the latest wave of whale accumulation. 

Shiba Inu Nears Top 30 Crypto Ranking as Investors Withdraw 74 Billion SHIB From Centralized Exchanges

0

Shiba Inu is closing in on a return to the top 30 cryptocurrencies after investors withdrew billions of SHIB tokens from centralized exchanges.

It has been more than two weeks since Shiba Inu dropped out of the top 30 amid prolonged weakness across the broader crypto market. The downturn pushed SHIB to 33rd place on CoinMarketCap’s rankings, raising concerns that the token could slip even further below the top 35.

However, SHIB has defied those expectations. The token has steadily recovered and now ranks as the world’s 31st-largest cryptocurrency, putting it within striking distance of re-entering the top 30. 

At the time of writing, Shiba Inu trades at $0.000004230 with a market cap of approximately $2.49 billion. It trails Tether Gold (XAUt), which currently occupies the 30th position on CoinMarketCap, by only $20 million in market value. 

SHIB Ranking
SHIB Ranking

Exchange Outflows Reduce Immediate Selling Pressure

Shiba Inu’s recent recovery coincides with significant exchange withdrawals, a trend that typically signals reduced selling pressure.

According to CryptoQuant data, investors withdrew 235.93 billion SHIB from centralized exchanges over the past 24 hours, while 161.74 billion SHIB flowed into trading platforms. As a result, the exchange netflow stood at -74.18 billion SHIB, indicating that approximately 74.18 billion tokens left exchanges during the period. 

Shiba Inu Exchange Flows

This negative net flow suggests that investors are moving SHIB into private wallets rather than keeping the tokens on exchanges for immediate sale, potentially easing short-term selling pressure. Despite these withdrawals, exchanges still hold approximately 86.2 trillion SHIB.

Technical Outlook Remains Mixed

Although SHIB has regained momentum and moved closer to the top 30 ranking, analysts remain divided on its short-term outlook.

Recent technical analysis suggests that Shiba Inu is mirroring its 2023 price structure. Based on that pattern, analysts believe SHIB could decline by at least 20% before staging a recovery toward the $0.0000055–$0.0000056 range.

Meanwhile, on-chain data continues to paint a cautious picture. Shibarium’s daily transaction count has fallen to just 661, reflecting weaker network activity. At the same time, the SHIB burn rate has dropped sharply, declining from a recent high of 13 million burned tokens to 2.42 million.

While strong exchange outflows have helped support Shiba Inu’s recent rebound, the token still faces notable headwinds. Weakening network activity and slowing token burns could limit the pace of any sustained recovery, even as SHIB edges closer to reclaiming a place among the top 30 cryptocurrencies by market capitalization.