Home Blog Page 59

Bitcoin Institutional Pessimism Extends Beyond 900 Hours as Coinbase Premium Remains Negative

Institutional sentiment toward Bitcoin has fallen to its weakest level in two years, according to CryptoQuant author Darkfost. 

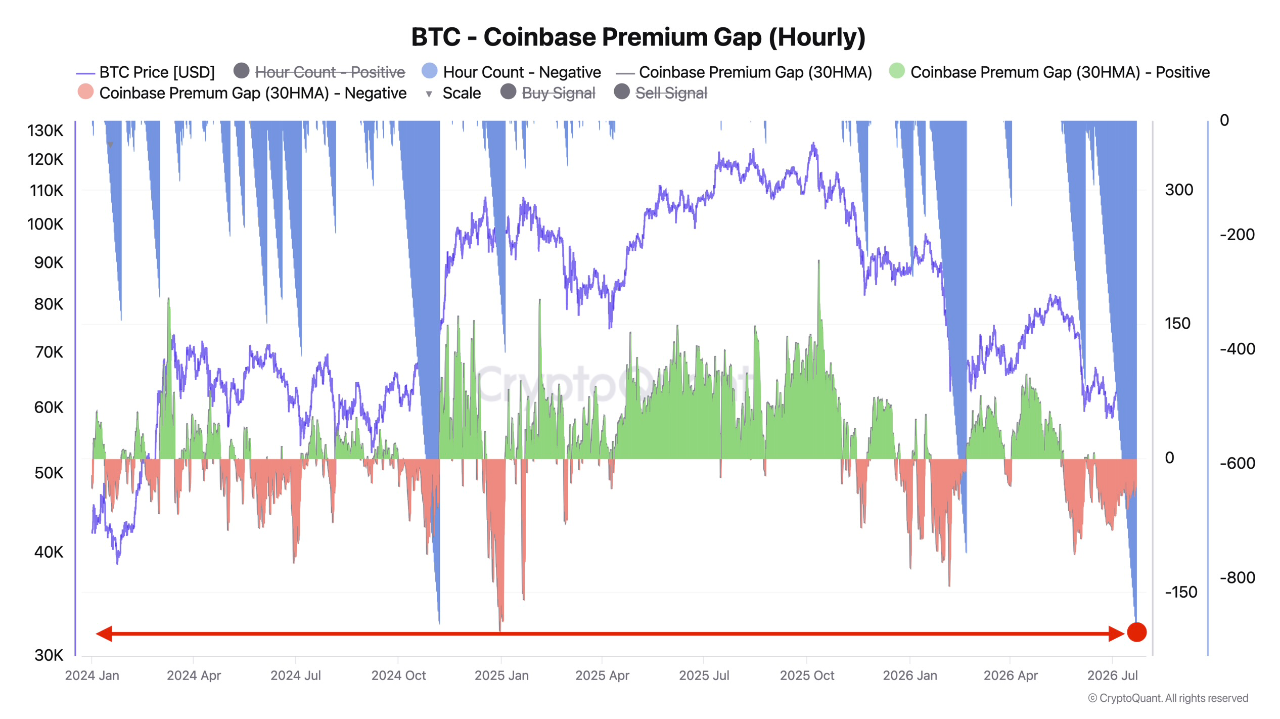
The Coinbase Premium Index has remained below zero for more than 900 cumulative hours. The extended negative reading suggests that professional and institutional investors are continuing to reduce their Bitcoin exposure. This comes amid ongoing macroeconomic uncertainty, even as Bitcoin has posted modest weekly gains.

Coinbase Premium Points to Institutional Selling Pressure

Darkfost explained that the Coinbase Premium Index compares Bitcoin prices on Coinbase Advanced, which is mainly used by institutional and professional investors, with prices on Binance, the world’s largest exchange by spot and derivatives trading volume.

A negative premium means Bitcoin is trading at a lower price on Coinbase than on Binance. This suggests stronger selling pressure from institutional investors compared with the broader market.

According to Darkfost, the current streak of more than 900 cumulative hours below zero represents the longest period of institutional pessimism seen in the past two years.
Macroeconomic Uncertainty Keeps Institutions Cautious

Darkfost linked the continued selling pressure to a more uncertain global economic environment.

The analyst highlighted several factors affecting institutional risk appetite. These include persistent inflation, high oil prices weighing on economic growth, and uncertainty around U.S. monetary policy under the Federal Reserve’s new leadership.

Unlike retail traders, institutional investors often reduce market exposure during periods of heightened macroeconomic and geopolitical uncertainty. Darkfost said this pattern is currently visible in Bitcoin markets.

Bitcoin Maintains Weekly Gains Despite Institutional Selling

Despite the bearish institutional positioning, Bitcoin has shown resilience. According to CoinMarketCap data, Bitcoin is trading at $65,958, down 0.32% over the past 24 hours. However, the cryptocurrency remains up 1.78% over the past seven days, although it is still down 27% year-to-date.

The gap between continued institutional selling and Bitcoin’s ability to hold weekly gains suggests that other market participants have absorbed much of the selling pressure.

However, the negative Coinbase Premium indicates that institutional sentiment remains cautious.

Ethereum Builder Activity Jumps 192% as ETH Nears $2,000 Amid Rising Leverage

Ethereum is showing stronger network activity despite a relatively modest price recovery.

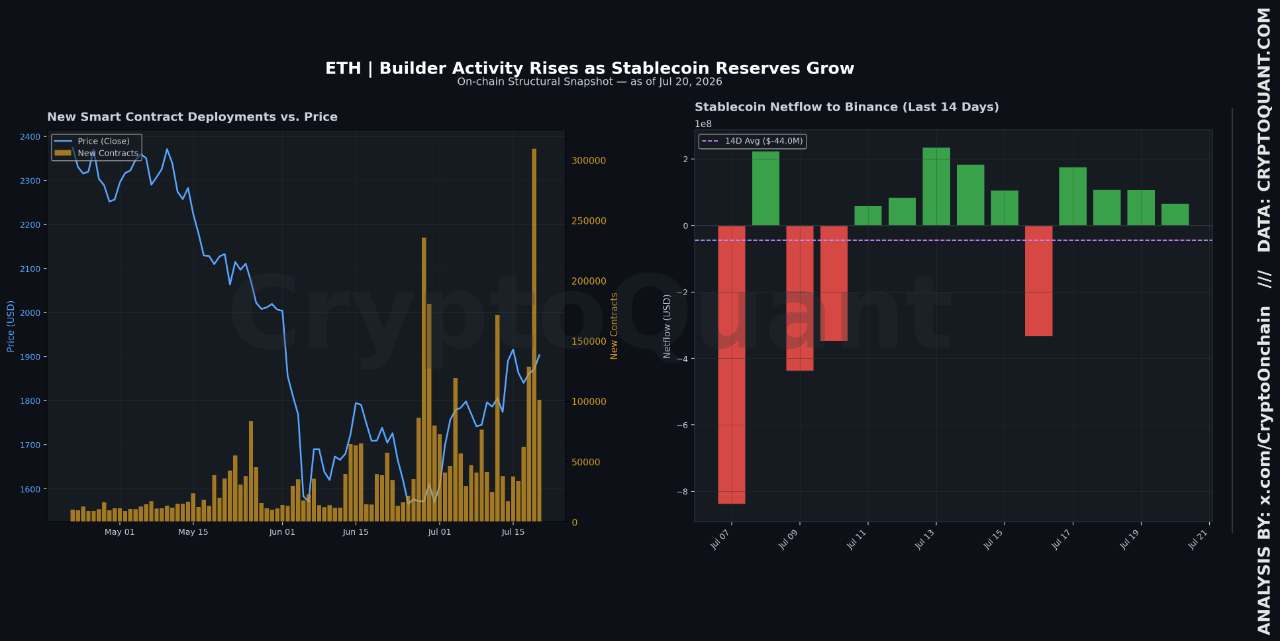
A sharp increase in smart contract deployments is coinciding with rising exchange liquidity and leveraged trading, according to CryptoQuant analyst CryptoOnchain.

The report notes that ETH’s price has climbed from around $1,770 to $1,903 over the past two weeks. At the same time, several key on-chain metrics are strengthening together. This combination differs from the patterns typically seen during accumulation or distribution phases.

Smart Contract Deployments Surge

CryptoOnchain reported that new smart contract deployments are about 192% above their 90-day average. Deployments also rose 57% over the past week.

According to the analyst, this trend usually reflects renewed developer activity rather than speculative trading. It can include new protocol launches, contract redeployments, or testing ahead of product releases.

The increase suggests Ethereum’s ecosystem continues to expand even as price action remains uneven.

quicktake-image

Stablecoin Inflows and Leverage Climb

Binance has also seen a sharp increase in stablecoin inflows. The report says net stablecoin flows are nearly 370% above their three-month average, with daily inflows topping $58 million.

CryptoOnchain said the inflows suggest capital is being positioned on the exchange instead of being deployed directly on-chain.

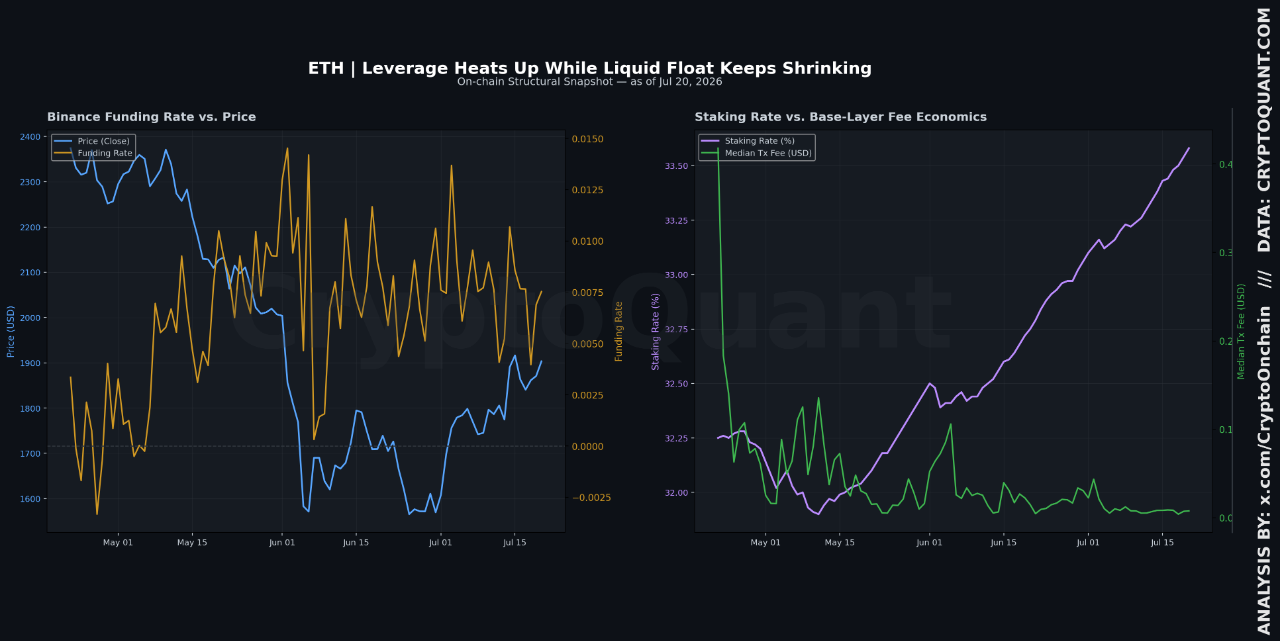
At the same time, Binance funding rates have climbed to roughly 220% above their 90-day average. Higher funding rates typically signal stronger demand for leveraged long positions.

This means spot liquidity and derivatives activity are expanding at the same time. This setup has historically been followed by periods of elevated two-way volatility rather than a sustained move in one direction.

quicktake-image

Low Fees and Record Staking Tighten Supply

Despite stronger developer and trading activity, Ethereum’s base-layer transactions remain inexpensive. Median transaction fees are down more than 96% from levels seen three months ago.

Meanwhile, Ethereum staking has reached a record 33.58%. As more ETH is staked, less is available for trading. That could tighten the liquid supply.

CryptoOnchain said Ethereum is currently showing an unusual combination of rising builder activity, growing exchange liquidity, and elevated leverage. The analyst believes the next major move may depend on whether funding rates cool or whether price can build on its recent breakout attempt.

ETH Price Analysis

ETH traded around $1,921 at press time after recovering 8.5% from roughly $1,770 over the previous two weeks. Notably, ETH reached an intraday high of $1,945 for the first time since June, showing signs of a potential move toward reclaiming the $2,000 level.

The surge in smart contract deployments and record staking levels point to improving network fundamentals. Meanwhile, rising stablecoin inflows suggest that fresh capital is waiting on exchanges.

However, elevated funding rates also increase the risk of sharper price swings as leveraged positions continue to build. If buyers maintain momentum and spot demand absorbs the growing leverage, Ethereum could attempt a stronger breakout above recent highs.

Top Crypto Collateral Platform Confirms Shiba Inu Integration to Enable SHIB-Backed Borrowing

0

Popular meme-coin collateral platform Purinta has confirmed it will soon launch a dedicated Shiba Inu market.

Once the feature goes live, users will be able to use their Shiba Inu holdings as collateral to borrow funds without selling their tokens. Announcing the development on X, Purinta stated:

“SHIB market coming soon to Purinta. Deposit, borrow, [and] keep your exposure.”

The announcement also featured a promotional banner reading, “Borrow Against SHIB. Coming Soon to Purinta,” indicating that the feature is currently under development. 

Image

Community Vote Secured SHIB’s Listing

The decision to add SHIB came directly from the community. A few weeks ago, Purinta conducted a poll on X, asking its more than 25,900 followers to vote on the next meme coin the platform should support.

The results strongly favored Shiba Inu. Out of 396 votes cast, 67.9% supported SHIB, while 32.1% backed Floki. By declaring, “You voted. We listened,” Purinta made it clear that community demand, not an internal decision, determined the outcome.

After the SHIB market launches, users will be able to deposit their Shiba Inu tokens as collateral and borrow stablecoins such as USDC while retaining exposure to SHIB’s potential price appreciation.

This model allows holders to unlock liquidity without liquidating their positions. Instead of selling SHIB to raise capital, users can continue holding the token while borrowing against it through Purinta’s decentralized finance (DeFi) platform.

SHIB Becomes Purinta’s Fourth Meme Coin Collateral

The upcoming integration expands Purinta’s meme coin-focused lending ecosystem, which is built on Morpho and powered by Api3DAO infrastructure.

Currently, the platform supports three meme coins as collateral, such as Pepe (PEPE), Cash Cat (CASHCAT), and SPX6900 (SPX). 

With the addition of SHIB, Shiba Inu will become the fourth meme coin available for collateralized borrowing on the platform.

Shiba Inu’s DeFi Utility Continues to Expand

Purinta’s integration further strengthens Shiba Inu’s role in decentralized finance by allowing holders to access liquidity without selling their SHIB holdings.

The platform joins a growing number of services that accept SHIB as collateral for stablecoin-backed loans, including CoinRabbit and Binance Loans. Additionally, the Shiba Inu ecosystem team has introduced Shib Finance, a product designed to provide a broader financial suite covering lending, borrowing, and savings.

Notably, Purinta’s support expands SHIB’s utility within the DeFi sector, giving investors another option to unlock capital while maintaining exposure to the token. 

Cardano Founder Says “We Have Huge Things Coming for Midnight,” Reaffirms NIGHT Strength After Wanchain Bridge Exploit

0

Cardano founder Charles Hoskinson has emphasized that Midnight’s long-term fundamentals remain strong despite the recent Wanchain bridge exploit that briefly rattled the market.

In a post on X, the Cardano founder said Midnight continues to hold significant fundamental value and revealed that the project has a roadmap packed with major upcoming developments. He also praised the ecosystem’s technology, commercialization strategy, and leadership team.

“There is fundamental value in Midnight, and we have some huge things coming for Midnight. It’s an incredible ecosystem with wonderful technology, commercialization, and leadership,” Hoskinson stated. 

However, Hoskinson did not reveal details about the upcoming initiatives planned for the Cardano partner chain or provide a timeline for when they will be unveiled.

NIGHT Rebounds After Massive Sell-Off

Hoskinson made the remarks shortly after NIGHT staged a sharp recovery following a severe market sell-off triggered by the unauthorized withdrawal of 515 million NIGHT tokens from the Wanchain bridge.

As previously reported, the perpetrators quickly sold hundreds of millions of NIGHT tokens across decentralized exchanges, driving the token’s price down to a low of $0.01582.

However, buying pressure returned as panic selling subsided. Consequently, NIGHT climbed back to $0.024, leaving it just a fraction of a cent below its pre-incident price of $0.02689.

At press time, NIGHT has gained 36% over the past 24 hours while recording approximately $114 million in trading volume. The strong rebound has boosted optimism that investor confidence is gradually returning despite the exploit.

Hoskinson Calls the Incident Midnight’s First Major Stress Test

Addressing the exploit in a livestream, Hoskinson described the event as Midnight’s first real stress test. He argued that the ecosystem demonstrated remarkable resilience even after hundreds of millions of tokens suddenly entered the market.

According to him, Midnight’s ability to absorb such a significant liquidity shock without collapsing highlights the strength of its community and reinforces its long-term growth prospects.

Hoskinson also expressed confidence that the exploit would eventually become only a small chapter in Midnight’s broader development story.

Exploit Did Not Affect Midnight or Cardano Infrastructure

Hoskinson also moved to dispel misconceptions surrounding the incident, stressing that the exploit did not compromise Midnight’s core infrastructure or the Cardano network.

He explained that the attack was confined to the Wanchain bridge and did not impact Midnight’s blockchain, smart contracts, or day-to-day ecosystem operations.

According to Hoskinson, both Midnight and the NIGHT smart contract running on Cardano have continued operating normally around the clock without any interruptions.

He further noted that the Glacier Drop distribution remains on schedule and emphasized that none of Midnight’s infrastructure was hacked. Likewise, he stated that no Cardano systems connected to Midnight were compromised during the incident. The development comes days after the Glacier Drop achieved a significant milestone, with 1.5 billion NIGHT tokens successfully redeemed through the distribution process. 

XRP Whales Capture Record 77.8% of Exchange Outflows as Retail Activity Slumps

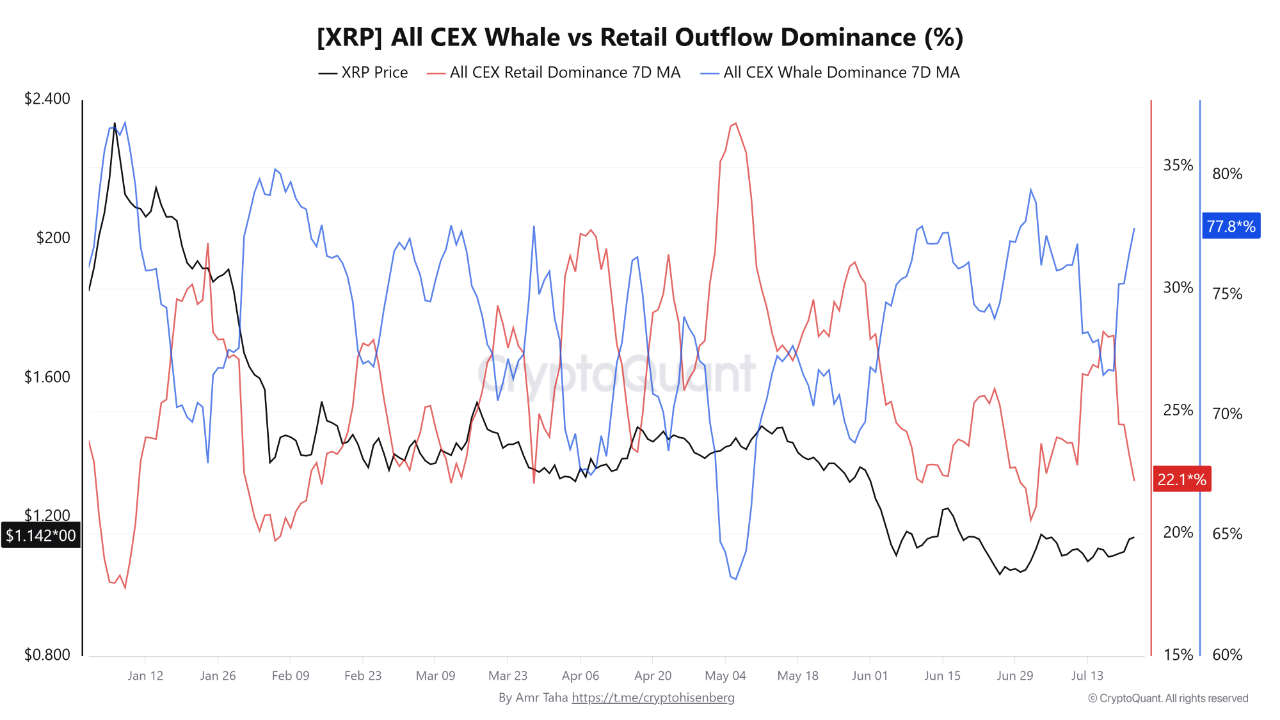
Large XRP holders are accounting for an increasingly larger share of exchange outflows, according to new data from CryptoQuant.

The trend confirms whales are playing a much bigger role in moving XRP off centralized exchanges than retail investors.

Whale Share Reaches New High

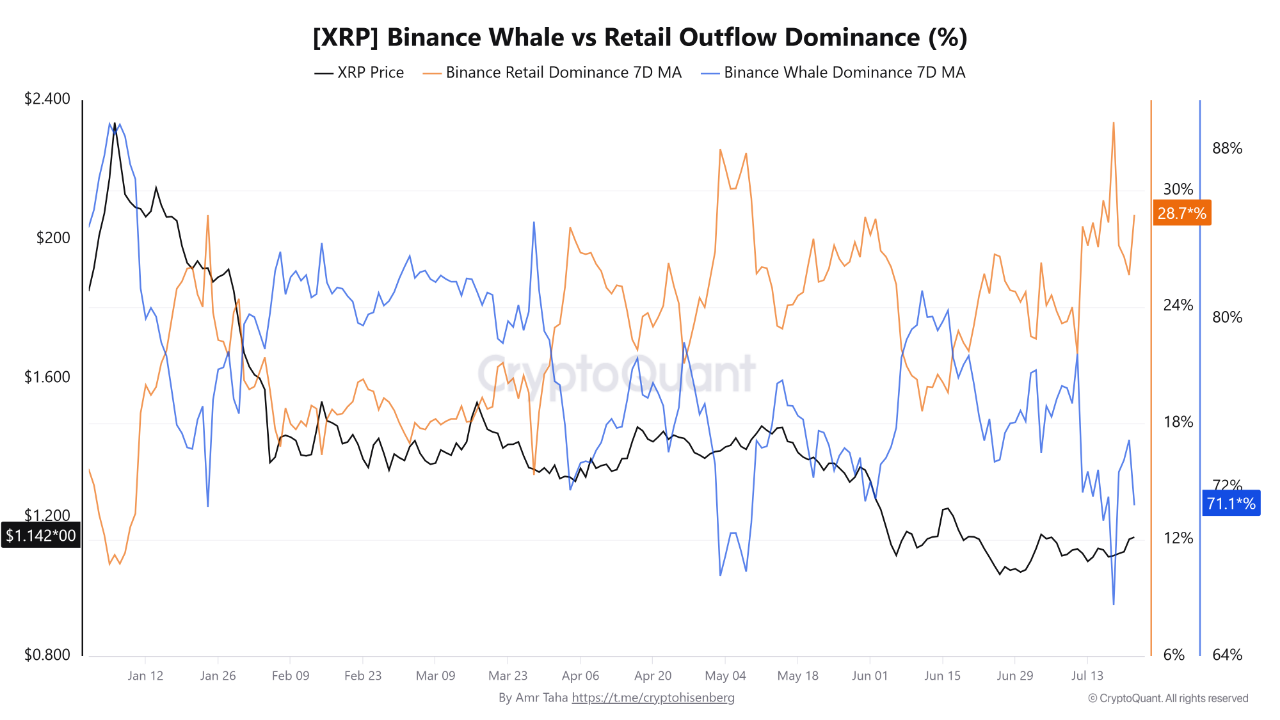
Data from CryptoQuant contributor Amr Taha shows that whale outflow dominance across all centralized exchanges (CEXs) climbed to a record 77.8% on July 22. Retail investors accounted for just 22%, the lowest share on record.

The shift is notable compared with May 6. At that time, whales represented 63% of XRP outflows, while retail investors accounted for 36%.

Since then, whale dominance has risen by 14.8 percentage points, while retail participation has fallen by about 14 percentage points.

The data suggests that large holders are increasingly driving XRP outflows, while retail investors make up a shrinking share of activity.

Binance Shows the Same Pattern

The same trend is visible on Binance, the world’s largest cryptocurrency exchange by trading volume.

Whale outflow dominance on Binance reached 71% on July 22, up from 67% on May 3. Retail dominance fell to 28.7%, compared with 32% in early May.

Binance still has a slightly larger share of retail-driven outflows than the broader market. Even so, whale participation continues to grow.

Whale Activity Spreads Across Exchanges

Whale dominance across all centralized exchanges now stands 6.8 percentage points higher than on Binance. This suggests the shift is taking place across the broader market rather than on a single exchange.

The gap between whale and retail activity has also widened. Across all exchanges, whales exceed retail participants by 55.8 percentage points. On Binance, the gap is 42.3 percentage points.

The data shows that whales are responsible for a much larger share of XRP leaving exchanges. However, it does not reveal the total amount of XRP transferred, where the tokens were sent, or whether the transfers represent accumulation, custody moves, or preparations for future transactions.

What It Could Mean for XRP

The growing share of whale outflows may indicate that large holders are moving XRP into self-custody. That could reduce the supply immediately available on exchanges.

However, the data is not inherently bullish or bearish. If whale outflows continue while exchange balances decline, XRP could benefit from lower selling pressure and stronger price support. On the other hand, if those tokens later return to exchanges, they could signal renewed selling.

Notably, this observation comes as XRP’s price climbed to $1.16 over the past day for the first time since June. However, the momentum has quickly reversed as the market cools from the ongoing relief rally. XRP is now trading at $1.13, erasing all of its gains from the past 24 hours.

Crypto Banter Predicts When Cardano Would Break Out to $0.60

0

A recent analysis has identified that Cardano is trending within a descending wedge, and a breakout could take the altcoin to $0.60.

Specifically, Crypto Banter’s Sheldon shared this Cardano (ADA) price analysis in a recent YouTube livestream. The analysis projected when ADA could break out of its current descending wedge to target higher prices.

Cardano In a Descending Wedge

Sheldon analyzed the 1-week ADA/USDT chart and highlighted the asset’s trend within a “very good” descending wedge. The structure’s lower support began forming from the October 10 crash low of $0.27. Meanwhile, the upper resistance started to take shape after the early December high of $0.48.

Cardano has persistently slid lower within this wedge, shuffling between the descending upper and lower boundaries. Notably, the lower support provided a strong cushion during its recent multi-year level retest. For context, ADA dropped to 2020 lows of $0.138 in June as bearish pressure intensified.

However, the wedge’s support stood strong again, sparking a 27% rebound to its current price at $0.175. Currently, the altcoin is nearing the upper resistance of the multi-month wedge.

Cardano Descending Wedge/Sheldon

Cardano Breakout Targets $0.5-$0.6

Notably, Sheldon highlighted $0.20 as a key level to watch if the recent resurgence persists. According to him, reclaiming and trading above this region is key. Notably, it confirms a breakout from the current wedge. From here, reclaiming levels above $0.20 requires at least a 14% increase from the current market price.

When this does happen, the analyst predicted a nice move towards the $0.50-$0.60 region, representing a 186% to 243% growth from the current price. The target aligns with price levels last seen in November 2025.

Sheldon went a step further to predict when this breakout could occur. Although ADA seems to be regaining bullish momentum, he sees the descending wedge trapping the altcoin until around September this year. This aligns with the strengthening narrative that the broader crypto market would start to sustainably recover in the last quarter of 2026.

Meanwhile, Sheldon sees the current Cardano price level appealing. He noted that it is a “good trade coming on Cardano,” particularly if it starts to move towards $0.20.

Short-Term ADA Target Is $0.25

In a separate analysis, Cardano SPO Ssebi identified an inverse head-and-shoulders pattern on the daily timeframe. The left shoulder formed at the June 6 low of $0.148, the head at $0.138 on June 25, and the right shoulder at $0.155 on July 13.

Cardano Inverse H&S Pattern/Ssebi

According to the analyst, the target for this setup is $0.25, representing a 43% increase from the current market price.

Notably, the bullish development hinges on Cardano continuing to trend upward and avoiding a break below levels around the right shoulder. This means that a daily close below $0.155 could invalidate this pattern.

XRP Sees Progress in AI Payments, DTCC Education, and On-Chain Lending: Evernorth CEO

The XRP ecosystem continues to develop despite broader macroeconomic uncertainty. 

Asheesh Birla, CEO of XRP treasury company Evernorth, highlighted three recent milestones involving AI payments, institutional education, and decentralized lending.

Birla said while markets remain focused on possible U.S. Federal Reserve rate decisions, activity within the XRP ecosystem has continued to grow without relying on macroeconomic catalysts.

AI Agents Complete One Million XRPL Payments

Birla said AI agents processed about one million payments on the XRP Ledger (XRPL) in roughly one month. He cited on-chain data from AI payments platform t54ai.

According to Birla, the milestone shows software autonomously paying other software through XRPL. Transactions settle in seconds and cost only fractions of a cent.

He added that this level of activity was not present earlier this year, suggesting growing demand for AI-powered micropayments on the network.

DTCC References XRP in Educational Materials

Birla also highlighted that the Depository Trust & Clearing Corporation (DTCC) added XRP to its educational Learning Center. The asset is referenced in materials explaining how crypto collateral haircuts work.

He clarified that this does not mean DTCC has decided to accept XRP as collateral. Instead, he said the educational content includes XRP as part of broader discussions about digital asset collateral management and risk assessment.

XRP Lending Proposal Enters Testing

Birla’s third update focused on the XRP Ledger’s on-chain lending proposal, XLS-66, which has entered the testing phase.

RippleX recently confirmed that testing is now underway. The milestone marks another step toward expanding decentralized finance (DeFi) functionality on XRPL. Birla said tracking protocol development offers more insight than focusing on short-term price movements.

Ripple Expands Institutional Strategy With XRP Ledger and RLUSD

Meanwhile, Ripple is strengthening its institutional blockchain strategy through partnerships with Mastercard, JPMorgan, Ondo Finance, and OKX.

In a Grayscale interview, Ripple SVP Jack McDonald said the company is building institutional-grade infrastructure, with trades from its collaborations with Mastercard, JPMorgan, and Ondo Finance set to settle on the XRP Ledger (XRPL).

McDonald also highlighted OKX’s expanded support for Ripple USD (RLUSD), allowing the stablecoin to be used for spot trading, derivatives, and collateral.

RLUSD, launched about 18 months ago, has grown to a market cap of around $1.6 billion. McDonald said Ripple’s priority is now shifting from exchange listings and growth to expanding RLUSD’s real-world institutional utility while continuing to use XRPL as its settlement layer.

Ecosystem Development Continues

Summing up the recent progress, Birla said advances in AI payments, institutional education, and on-chain lending show that XRP ecosystem builders are continuing to expand the network despite market uncertainty.

What Next as XRP Tests Key Resistance After Ichimoku Cloud Breakout?

0

XRP has reached an important resistance level after breaking above the Ichimoku Cloud on the one-hour chart amid a recent rebound push.

The breakout has improved the token’s short-term outlook, but buyers still need to push through key resistance levels before they can confirm that the recovery has more room to continue.

XRP Recovers but Meets Strong Resistance

XRP bounced back sharply after dropping to a recent swing low of $1.0826. The recovery carried the token above the Ichimoku Cloud before it met resistance around $1.13. 

At the time of writing, XRP trades at $1.1311, down 0.24% over the past day. Amid this slight decline, it remains to be seen if buyers can build on the breakout or whether sellers will stop the rally.

The latest move has strengthened the short-term picture, but the broader trend still points lower. Because of that, traders have yet to treat this recovery as confirmation of a full trend reversal. The next price moves will likely show whether XRP can extend its gains or return to its earlier downtrend.

Ichimoku Cloud Shows Buyers Have the Edge

The Ichimoku indicator suggests buyers have gained control in the short term. XRP now trades above both the Tenkan-sen at $1.1240 and the Kijun-sen at $1.1114, and this shows growing buying strength. As long as the price stays above these lines, buyers keep the advantage.

However, the breakout still faces an important test. Senkou Span A sits at $1.1311, matching the current price and acting as immediate resistance. 

Meanwhile, Senkou Span B stands at $1.1177, creating a key zone between $1.1177 and $1.1311. If XRP remains above this area, the breakout stays intact, and the short-term outlook remains positive.

XRP Ichimoku Cloud Breakout

A move back inside the cloud would weaken the current setup and increase the chances of another pullback. At the same time, the Chikou Span has not yet moved above the price levels from 26 periods ago. Until that happens, the Ichimoku signal remains positive but still lacks full confirmation.

XRP Fibonacci Levels

Elsewhere, XRP’s Fibonacci extension reveals areas traders should watch next. The nearest support levels sit at $1.1251, which marks the 0.786 retracement, and $1.1158 at the 0.618 retracement. If XRP pulls back, these levels could help slow the decline.

If selling pressure increases, the next support comes in at $1.1002 near the 0.33 retracement. This level also sits close to the Kijun-sen, which makes it an important area that could help determine whether the recent recovery remains in place.

On the upside, XRP first needs to break above the 0.888 Fibonacci level at $1.1307, which aligns with the upper edge of the Ichimoku Cloud. 

A successful move above this level would bring the 1.0 extension at $1.1369 into focus. If buyers keep the momentum going, they could then target the 1.272 extension at $1.1522, followed by the 1.414 extension at $1.1602.

Even so, the resistance zone between $1.13 and $1.16 could slow the rally. Buyers will likely face fresh selling pressure throughout this range. Breaking above each level would strengthen the recovery, while rejection could send XRP back toward its nearby support levels.

XRP Momentum Slowing Down

Although XRP has recovered slightly, the Directional Movement Index suggests buying strength has started to fade. The Average Directional Index (ADX) stands at 33.6457, showing that the market still has a strong trend instead of moving sideways.

However, the positive directional indicator (+DI), which measures buying pressure, has fallen from 37 to 29.3752 over the past few hours. This drop suggests buyers have lost some momentum even though the price has held near its recent highs. 

Meanwhile, the negative directional indicator (-DI) has also declined to 11.5424, showing that sellers have not yet taken control.

This leaves the market in a balanced position. Buyers still have the advantage because the +DI remains above the -DI. However, if buying pressure continues to weaken while the ADX stays high, XRP could pull back toward the support area between $1.1158 and $1.1177.

Shiba Inu Price Risks 20% Drop as 2023 SHIB Bearish Pattern Resurfaces

0

Shiba Inu is showing renewed signs of weakness as its current price action closely resembles a bearish setup that unfolded in 2023. 

According to analysts, Shiba Inu’s recent market structure shares a 91.2% similarity with the price pattern recorded between April and June 2023, increasing the possibility of another downside move before any meaningful recovery.

For context, SHIB has remained in a prolonged downturn since losing the critical $0.00000628 support level in May 2026. Following that rejection, SHIB has continued to print lower highs and lower lows, confirming that sellers remain firmly in control of the market.

Price Action Suggests More Downside

As the bearish momentum persists, SHIB has fallen below $0.0000042 and is now trading around $0.00000415, close to the lower boundary of its recent consolidation range.

Notably, this price structure closely mirrors SHIB’s performance between April and June 2023. During that period, the token traded sideways for several weeks before breaking lower and eventually establishing a local bottom. The current setup suggests that a similar sequence may be unfolding once again.

Based on the projected historical pattern, analysts expect SHIB could decline toward the $0.0000032–$0.0000033 support zone through late July and into August 2026. From the current price of $0.00000415, such a move would represent a decline of roughly 20%. 

Image

Recovery Remains Possible After Support Test

Despite the bearish outlook, the projected pattern also indicates that SHIB could stage a rebound after testing the expected support area.

If buyers step back into the market and overall sentiment improves, Shiba Inu could recover toward the $0.0000038–$0.0000040 range. However, a stronger bullish reversal would require SHIB to reclaim key resistance levels.

Specifically, the token would need to break above the $0.0000044–$0.0000045 resistance zone before targeting the more significant $0.0000055–$0.0000056 area. 

Historical Pattern Is a Guide, Not a Guarantee

If the historical comparison continues to play out, SHIB could establish another local low before beginning a more sustained recovery. However, while the 91.2% pattern match highlights a credible short-term bearish scenario, it does not guarantee that the token will follow its 2023 trajectory exactly. 

At the time of writing, Shiba Inu has posted a modest 3.23% gain over the past 24 hours and 3.69% over the past week. Trading activity has also picked up, with SHIB’s 24-hour trading volume rising 7.58% to $55.46 million. Despite the recent recovery, however, Shiba Inu remains outside the top 30 largest cryptocurrencies by market cap. The token currently ranks 32nd globally, with a market capitalization of approximately $2.46 billion.

XRP Records Thinning Spot Activity Amid Rising OI: Possible Impact on Price

0

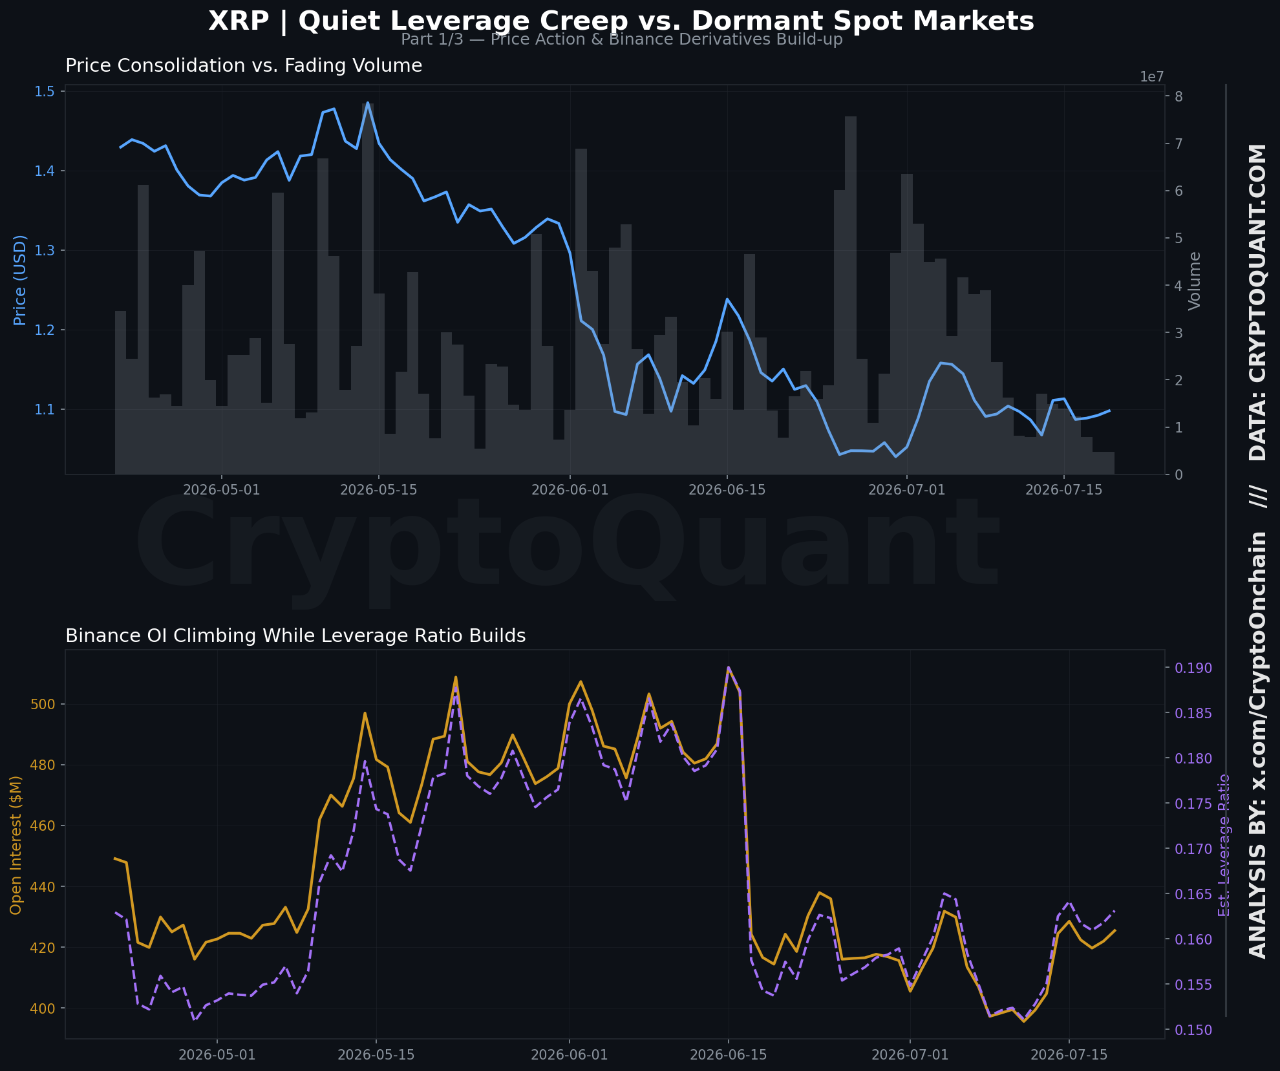
XRP has reached an important point where spot market activity has crashed while traders continue to increase their positions in the derivatives market. 

This comes during a broader downtrend that has erased about 70% of XRP’s value since it reached its all-time high of $3.66 in July 2025. The current situation has raised new questions about where XRP could move next.

XRP Spot Trading Activity Drops to Near-Zero Levels

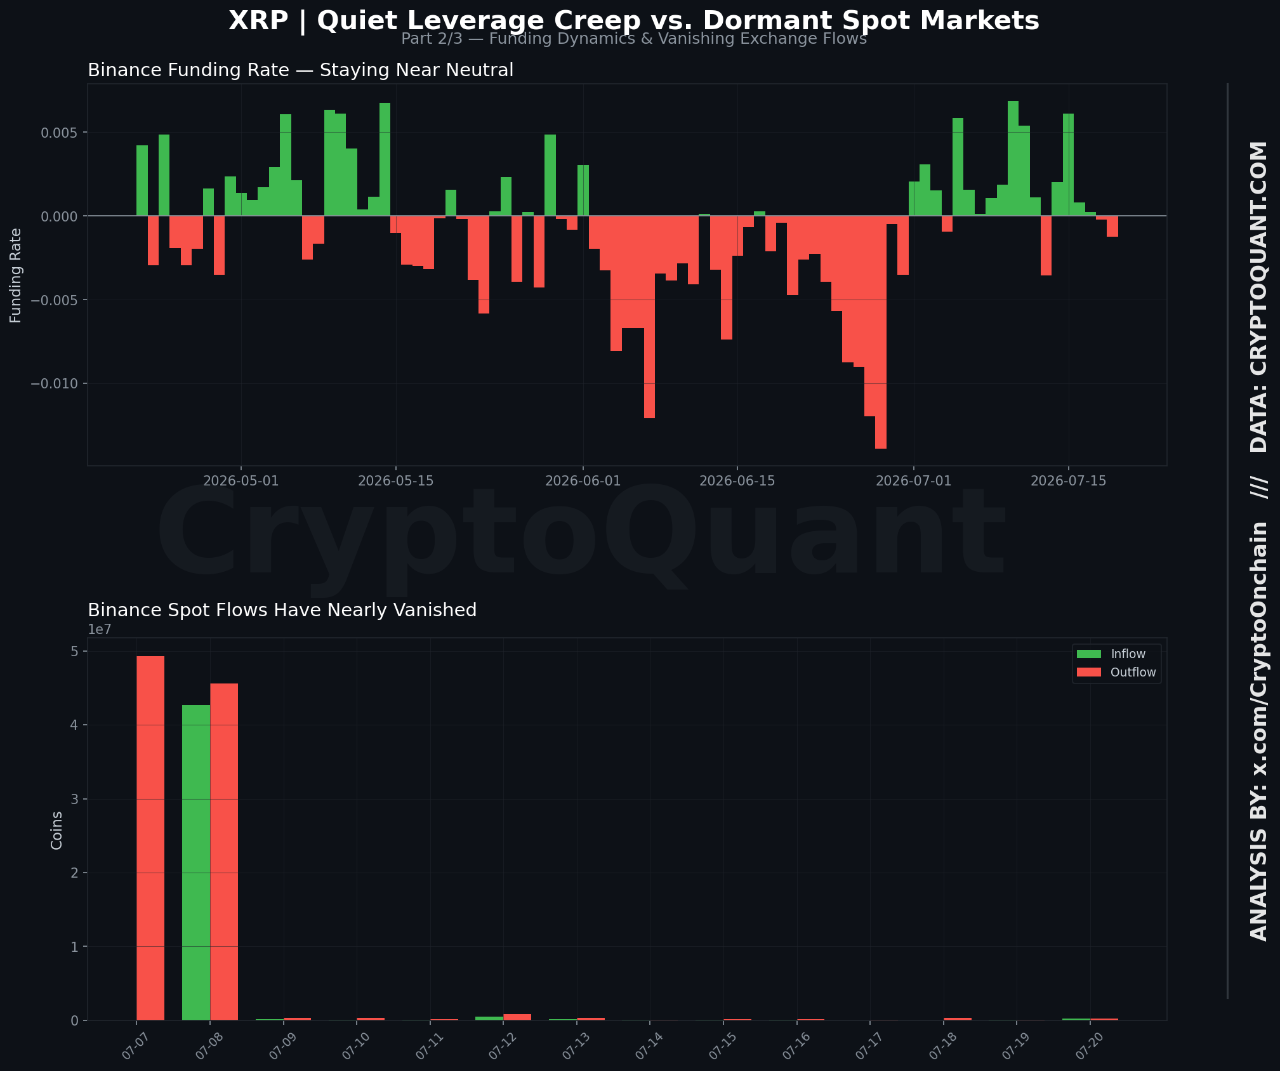
Recent data from Binance shows that spot market activity has almost disappeared. According to CryptoQuant, exchange inflows have fallen 99.1%, while outflows have dropped 99.0% compared with previous levels. 

In addition, the number of deposit addresses has declined 97.6% below the weekly average, confirming that far fewer users are moving XRP onto the exchange.

Trading volume has also weakened sharply. Binance’s spot volume has fallen 54.6% week over week and now stands more than 67% below both its monthly and quarterly averages. 

With the drop in trading activity, XRP has traded in a tight range between $1.086 and $1.113 for nearly two weeks. During that time, the price has continued to battle the 50-day moving average at $1.11. 

In an ongoing downtrend, this sort of price compression without stronger trading volume does not confirm that the market has formed a bottom. Instead, it shows that both buyers and sellers remain cautious and are unwilling to commit significant capital.

Derivatives Traders Continue Adding Positions

However, while spot traders have reduced their activity, derivatives traders have continued increasing their exposure. Specifically, Open Interest has risen 5.9% to $423.8 million, while the estimated leverage ratio has climbed to 0.162, its highest level during the recent period.

XRP Open Interest on Binance Climbing CryptoQuant
XRP Open Interest on Binance Climbing | CryptoQuant

Meanwhile, funding rates have declined 29.9% from last week and have remained close to zero for much of the period. This suggests the market does not currently have the conditions that usually lead to a strong one-sided short or long squeeze.

Despite this, funding rates remain much higher than their longer-term averages. They are 172.5% above the monthly baseline and 271.7% above the quarterly baseline, showing that leverage across the market remains elevated despite the recent decline. 

XRP Funding Rates on Binance
XRP Funding Rates on Binance and Spot Flows

Notably, these signals suggest traders are quietly adjusting their positions, not necessarily making strong directional bets.

Important Price Levels to Watch

The sharp decline in spot activity means that any major catalyst, whether it comes from macroeconomic events, regulation, or institutional developments, could trigger a larger price move because order book liquidity has become much thinner. 

However, as funding rates remain close to neutral, current market data does not clearly favor either an upward or downward squeeze. 

For now, XRP’s nearest support remains between $1.086 and $1.10, where the price has traded for the past two weeks. Below that, the $1.00 to $1.05 range stands out as an important psychological and technical support area. 

A decisive daily close below $1.00 could open the way for a move toward $0.90 to $0.93, while $0.85 to $0.90 remains the deeper support zone that many technical analysts see as the most likely floor for the current correction.

On the upside, $1.13 has now changed from support into resistance. A strong daily close above $1.15, where an important trendline also meets the price, could clear the way for a move toward $1.20 and later $1.25. 

However, XRP also needs a meaningful return of spot trading volume above $1.15 before traders can confidently say that the market structure has improved. Until that happens, the broader trend continues to favor lower prices.