Home Blog Page 60

XRP Enters ‘Liquidity Equilibrium’ as Whale Inflows Slow and Futures Positioning Builds

XRP is moving into a period of “liquidity equilibrium,” according to new CryptoQuant data, as traders’ positions become more evenly balanced after recent price gains.

A CryptoQuant chart shows that XRP long and short liquidations have fallen to similarly low levels. At the same time, Binance funding rates are near neutral, suggesting that neither buyers nor sellers have a clear advantage right now.

This kind of balance often comes before a larger price move, meaning a breakout could happen soon, although the direction remains unclear.

Liquidations and Funding Rates Signal Market Balance

The latest data shows Binance long liquidations at roughly 103,055 XRP, while short liquidations across exchanges stand at about 121,820 XRP. Funding rates have also flattened around zero, indicating that traders are not taking on heavily leveraged positions in either direction.

These conditions often appear after periods of high volatility. During such periods, excessive leverage is flushed from the market as traders wait for the next major catalyst.

Notably, the current equilibrium does not point to an immediate bullish or bearish move. Instead, it suggests the market is becoming compressed. A stronger move could follow once fresh buying or selling pressure enters the market.

Image

Whale Activity Slows as Exchange Inflows Drop

Meanwhile, large XRP holders (“whales”) are sending fewer tokens to Binance, according to additional data from CryptoQuant.

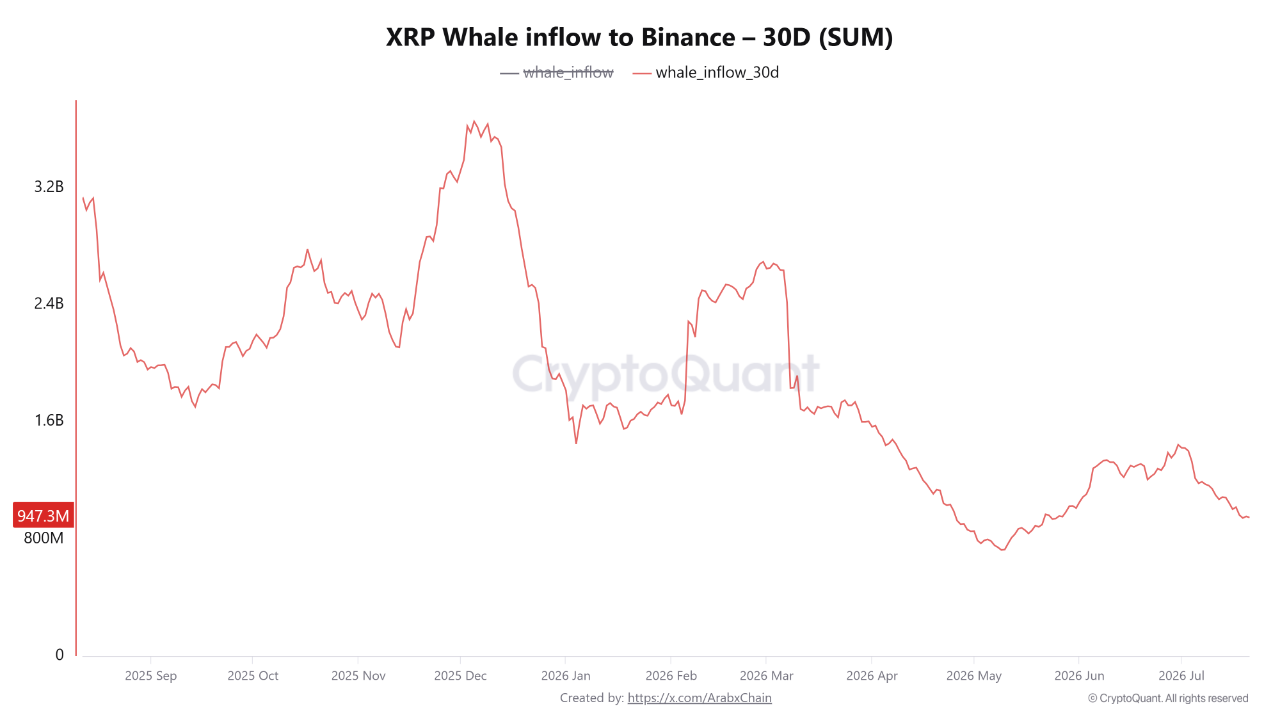
Analyst Arab Chain reported that XRP whale inflows to Binance over the past 30 days have fallen to about 947 million XRP, the lowest level in two months. That is down 34.4% from around 1.45 billion XRP in late June.
quicktake-image

Large transfers to exchanges can sometimes signal that whales are preparing to sell. The decline suggests whales are moving fewer tokens to Binance, which could mean reduced selling pressure or that they are keeping their XRP in private wallets.

If this trend continues and demand improves, it could support XRP’s price.

Derivatives Grow While Spot Trading Slows

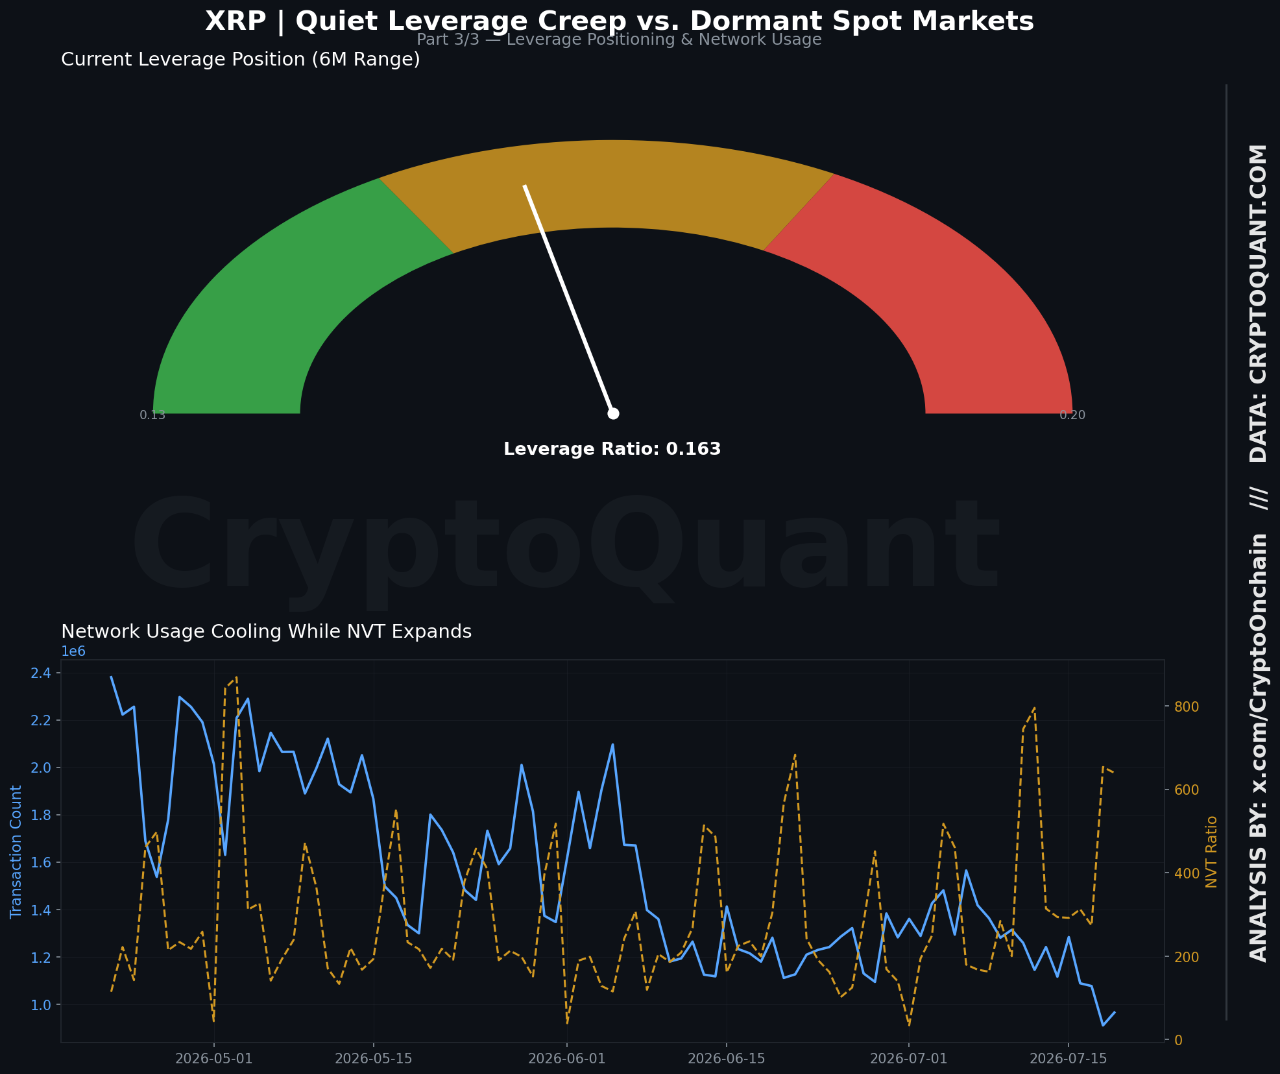
Another CryptoQuant analyst, CryptoOnchain, pointed out that XRP’s futures and spot markets are moving in different directions.

Spot trading activity has fallen sharply over the past week, with exchange inflows down 99.1%, outflows down 99%, and Binance deposit activity down 97.6% compared with the weekly average.

At the same time, traders are increasing their futures positions. XRP open interest has risen 5.9% to 423.8 million, while leverage levels have reached their highest point in the recent period.
quicktake-image

Despite this increase, XRP has remained mostly flat, trading between $1.086 and $1.113 for nearly two weeks, while trading volume has fallen 54.6% from the previous week.

CryptoOnchain said this suggests traders are gradually building positions rather than making aggressive bets. Neutral funding rates also indicate that traders are waiting for a major market catalyst instead of placing strong bets on either a price increase or decline.

Outlook

Overall, XRP’s market appears to be in a waiting phase. Buying and selling pressure are balanced, whale activity has slowed, spot trading has weakened, and futures positions are gradually building.

XRP was trading at $1.13 at the time of writing, up 4% over the past 24 hours, 6.2% over the past week, and 7.33% over the past month. However, it remains down 37% year to date.

The current data does not clearly indicate whether XRP will move higher or lower next. Instead, it suggests traders are positioning for a larger move once a new market catalyst emerges.
XRP Bullish Trend Confirmed After Breaking Out from Symmetric Triangle

0

XRP is showing early signs that it has regained bullish momentum after breaking out of a structure that has suppressed its price for several weeks.

The coin’s bullish price action over the past few days has aided this breakout. On Monday, XRP recorded its fourth consecutive daily green closing, with momentum coming from the resurgent Bitcoin.

Today, XRP has extended its bullish push, further rising by 2% at the time of writing. This has confirmed its breakout from a multi-week symmetrical triangle.

XRP Triangle Breakout

Notably, the symmetrical triangle began forming on June 15, when XRP made a lower high of $1.29. From then on, a series of lower highs and higher lows continued to form, with prices starting to compress within the structure’s lower and upper boundaries.

After the last lower high to $1.12 on July 15, volatility dropped further, with longer swings replaced by indecision among buyers and sellers. This hinted at an imminent breakout, with the resistance at $1.13 emerging as a key breakout point.

The recent upward momentum over the past few days has seen buyers gain control of the market. They pushed XRP to the neckline resistance and finally past the more than one-month-old upper descending trendline. This breakout occurred on Monday, with the sustained uptrend today confirming the resistance breach.

XRP Symmetrical Triangle Breakout

Upside Target if Breakout Sustains

Breakouts at times are not straightforward. In some cases, an asset experiences a mild consolidation around the breakout point and then records a strong uptrend afterwards. Some other cases see the coin break higher and pull back to retest the neckline resistance before further upside.

In either case, what is most crucial is to trade above the breakout point. If XRP does this, resistance areas at higher prices come into focus. The first major area to watch is the lower high formation at $1.18, where the early July bullish momentum stalled. Breaking above this level confirms buyers are in control of market proceedings.

The next upward target is at $1.29, where the symmetrical triangle started to form. XRP would need to rally by 14% to reclaim this key area. A sustained uptrend above this level might confirm that XRP may have formed a durable bottom and could kickstart the next bullish phase.

Historical July Performance Fuels Further Uptrend

History further suggests that XRP could rally higher. For context, in the past three Julys in the midterm election year, XRP has increased by an average of 14%. In one case, in July 2014, it closed 34% higher than its opening price that month.

This suggests that XRP could visit higher prices, spurred by the historical precedent and the latest triangle breakout.

Renewed buying pressure also provides additional fuel. Over the past 7 days, market users have withdrawn a net of $32 million worth of XRP from exchanges, suggesting accumulation.

XRP Spot Flows/Coinglass

$686M in Bitcoin Withdrawn From Binance, Coinbase, Bybit in One Day as BTC Targets $66K

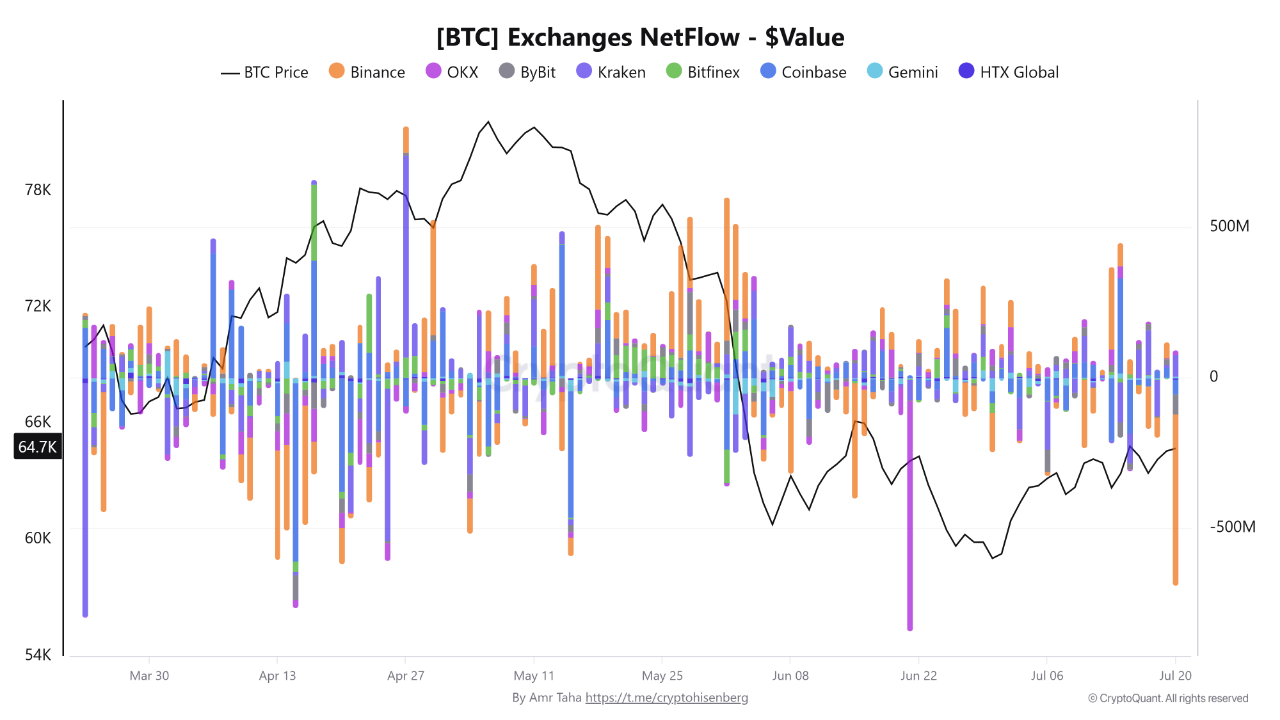
Bitcoin saw a broad wave of exchange outflows on July 20, with nearly $686 million worth of BTC leaving major trading platforms.

CryptoQuant contributor Amr Taha highlighted this record in a recent commentary. Notably, Binance accounted for most of the withdrawals, recording its largest daily net outflow since April.

For context, if the coins remain off exchanges, the trend could help reduce short-term selling pressure. Interestingly, this new trend has emerged as Bitcoin’s price continues to stabilize, pushing up gradually,

Binance Drives Bitcoin Exchange Outflows

Taha said Binance recorded roughly $570 million in net Bitcoin outflows on July 20. It was the exchange’s largest daily negative netflow in about three months.

Meanwhile, the trend wasn’t limited to Binance. Bybit recorded about $65 million in net outflows, while Coinbase saw roughly $48 million leave the platform. HTX posted nearly $3 million in outflows.

Together, the four exchanges recorded around $686 million in Bitcoin withdrawals. According to Taha, the synchronized outflows suggest investors were moving Bitcoin off exchanges on a broad scale rather than reacting to a platform-specific event.

Bitcoin exchange flow chart | CryptoQuant

Falling Exchange Balances May Reduce Selling Pressure

Bitcoin leaving exchanges reduces the amount of BTC immediately available for spot-market selling. If those coins stay in private wallets or long-term custody, lower exchange balances could ease near-term sell-side pressure.

Notably, large exchange outflows are often a sign of accumulation. However, they do not guarantee higher prices because the coins can always be transferred back to exchanges later.

Whale BTC Selling Activity Slows

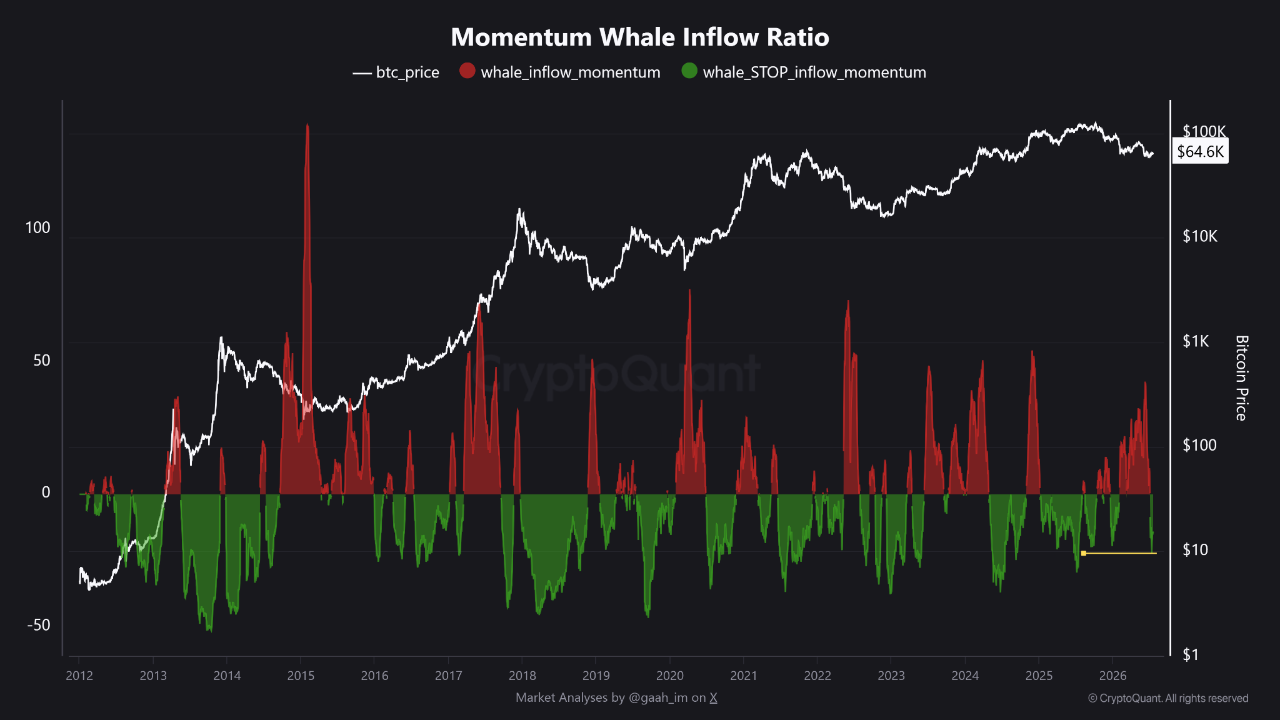
Separately, cryptoQuant contributor Gaah also pointed to another bullish on-chain signal. The Momentum Whale Inflow Ratio has turned negative for the first time in 2026 after staying positive for five straight months.

The metric tracks how much Bitcoin whales send to exchanges. A negative reading suggests large holders are depositing fewer coins for sale, indicating weaker selling pressure.

According to Gaah, the shift reduces bearish momentum and could support a short-term Bitcoin recovery if whale inflows remain low.

BTC Whale Inflow | CryptoQuant

Bitcoin Extends Weekly Gains

At the time of writing, CoinMarketCap data showed Bitcoin trading at $65,800, up 2.55% over the past 24 hours.

The latest rally has pushed Bitcoin’s seven-day gain to 5%, while its 30-day performance has turned positive at 2.44%. Despite the recent rebound, Bitcoin is still down 25% year to date, suggesting the broader recovery remains a work in progress.

Notably, the ongoing rally is supported by continued U.S. spot Bitcoin ETF inflows, which totaled $227 million at the end of trading yesterday, led by BlackRock’s IBIT with a $116 million inflow on Monday.

Improved risk appetite also helped, as a rebound in Asian semiconductor stocks lifted global markets and pushed the total crypto market cap up 2.27%.

Shiba Inu Bullish Catalysts Lose Impact as SHIB Recovery Hinges on This Key Factor

0

Several catalysts, including Shibarium and burns, that were once expected to drive Shiba Inu higher have failed to generate meaningful price momentum. 

Despite years of ecosystem development and community initiatives, Shiba Inu continues to trade near a multi-year low of around $0.0000042.

Shiba Inu On-Chain Activity Wanes

Meanwhile, on-chain metrics paint a similarly weak picture. Both SHIB’s burn rate and blockchain activity have dropped sharply, providing little support for a sustained price recovery. 

Low Shibarium Activity

Shiba Inu’s Layer-2 blockchain, Shibarium, launched in August 2023 to give the ecosystem greater utility and reduce reliance on speculation. However, network activity has slowed considerably in recent months.

According to the latest data from Shibariumscan, Shibarium processed only 796 transactions over the past 24 hours, while total transactions over the past seven days remain below 15,000. These figures mark a dramatic decline from the network’s early days, when it regularly handled millions of daily transactions.

The slowdown stands in stark contrast to Shibarium’s lifetime statistics, which include approximately 1.56 billion cumulative transactions and nearly 269.9 million wallet addresses. 

Shibarium Activity
Shibarium Activity

SHIB Burn Rate Continues to Lose Momentum

Shiba Inu’s token burn mechanism has also lost much of its impact.

Over the past day, the community burned just 21.79 million SHIB, while the seven-day total reached 61.48 million tokens. Although these burns still amount to tens of millions of tokens, they remain insignificant compared to SHIB’s enormous circulating supply of 589.15 trillion tokens.

The current burn activity also represents a steep decline from 2024 and 2025, when the community routinely removed billions of SHIB from circulation each day.

Moreover, recent on-chain analysis has raised questions about Shiba Inu’s reported holder growth. An analyst recently claimed that contract-generated addresses artificially inflated the token’s holder count earlier this month. According to the report, WoofSwap allegedly used an automated contract that created more than 70,000 additional wallet addresses during the first few days of July, making the growth appear stronger than it actually was.

Ecosystem Updates Fail to Inspire Investors

At the same time, SHIB investors have received few meaningful ecosystem developments capable of reversing the token’s downward trend.

Even Rakuten’s announcement regarding the development of a physical SHIB product in Japan failed to generate positive market momentum. Furthermore, leading ecosystem figures, including Lucie and Shytoshi Kusama, have remained silent on social media, leaving the community without significant updates or visible leadership.

Meme Sector Recovery Could Be Shiba Inu’s Only Hope 

Rather than reflecting project-specific issues alone, Shiba Inu’s prolonged weakness appears closely tied to the broader meme coin market. The GMCI Meme Index, which tracks the performance of major meme cryptocurrencies, dropped from a peak near 160 in January 2026 to 66 this week. 

The index has since recovered only slightly to around 67.2, according to TradingView data. Throughout that decline, SHIB has closely mirrored the sector’s overall performance. 

GMMEME 2026 07 21 08 38 52

As a high-beta meme asset, Shiba Inu’s next significant rally may depend more on renewed enthusiasm across the meme coin sector than on project-specific catalysts.

Previous meme coin rallies have demonstrated this relationship. For example, Dogecoin’s double-digit gains earlier in 2026 helped lift SHIB alongside other meme tokens. However, market sentiment remains cautious today.

The Altcoin Season Index currently stands at 53, suggesting that investor appetite for higher-risk altcoins remains limited. Until broader market conditions improve, SHIB could continue struggling to attract sustained buying interest despite its ecosystem developments. 

Currently, Shiba Inu trades at $0.000004282, giving the token a market cap of $2.52 billion. Despite the broader bearish trend, SHIB has gained 3.44% over the past 24 hours and 2.81% over the last seven days. 

Cardano: Midnight Crashes 35% After 515M NIGHT Exploit Rocks Wanchain Bridge

0

The Midnight ecosystem came under intense scrutiny after an unusually large transfer of NIGHT tokens triggered a sharp market sell-off, sending the token’s price tumbling.

According to on-chain analysis, a Wanchain bridge contract originally funded in December 2025 transferred 515.2 million NIGHT, the native token of Cardano’s partner chain Midnight, within just eight minutes. 

Interestingly, the contract also held several other liquid assets, including Mynth, XER, and WMT, yet only the NIGHT tokens were withdrawn. This suggests that the activity specifically targeted the NIGHT asset.

On-Chain Investigation Reveals Transfer Pattern

In an X thread, Cardano community investigator UTxOMaestro revealed that the 515.2 million NIGHT tokens arrived from the Wanchain bridge in four separate transfers, such as 203.0 million NIGHT, 129.6 million NIGHT, 120.4 million NIGHT, and 62.1 million NIGHT. 

All four transfers reached the same wallet between 14:46 UTC and 14:55 UTC on July 20, 2026. The investigation further suggested that Wallet 1 (W1) and Wallet 2 (W2) were likely controlled by the same entity.

According to the analysis, W1 first sent 1,000 ADA to W2 before transferring 200.06 million NIGHT. W2 later returned 100.31 million NIGHT, along with ADA and USDCx, reinforcing the theory that both wallets operated under common control. 

Image

300M NIGHT Sold Across DEXs

After receiving the tokens, W1 immediately began selling NIGHT across decentralized exchanges. Early estimates indicate that W1 sold around 300 million NIGHT, contributing to an initial price decline of nearly 50%.

Subsequent blockchain analysis identified several confirmed swaps, including 217.7 million NIGHT exchanged for approximately 24.02 million ADA, while 87.88 million NIGHT swapped for roughly 1.44 million USDCx.

Although a significant portion of the tokens entered the market, the liquidation remained incomplete. Investigators found that W1 transferred 200 million NIGHT to W2. At the time of analysis, W2 had sold only a small portion of those holdings, leaving a substantial amount of NIGHT unsold and creating the potential for additional selling pressure.

Rather than liquidating all of its holdings, W2 adopted a different strategy. The wallet deposited approximately 68.27 million NIGHT into the Liqwid lending protocol as collateral. It then borrowed roughly 4.364 million ADA against those holdings and transferred the borrowed ADA back to W1.

Midnight Foundation Reacts 

As concerns spread throughout the community, the Midnight Foundation issued an official statement clarifying that the Midnight blockchain itself had not been compromised.

According to the foundation, the incident was isolated to the Wanchain Cardano-BNB bridge, which operates as third-party cross-chain infrastructure.

The organization emphasized that Midnight’s protocol, validator network, consensus mechanism, and core infrastructure continue to function normally and remain secure. Based on current findings, the foundation sees no evidence that the incident has affected the security or operational integrity of the Midnight network.

NIGHT Remains Under Pressure Despite Rebound

The large-scale selling triggered intense volatility across the NIGHT market. Earlier in the day, the token climbed to an intraday high of $0.02689 before plunging to a low of $0.01582 as the wave of on-chain selling intensified.

At press time, NIGHT is down 35.12% over the past 24 hours, currently trading at $0.0174. Notably, its daily volume is up 798% over the past day to $125.96 million. 

Although NIGHT has staged a modest recovery from its lows, analysts caution that the remaining unsold holdings still pose a significant overhang. If those tokens are eventually sold, they could continue to weigh on the token’s price in the near term. 

Expert Says XRP Could Fall to Negative $5 in Long Term

0

Crypto investor Mike Alfred has ignited fresh debate across the digital asset community after sharing an unusually bearish long-term outlook for XRP.

In a post on X, Alfred revealed that he expects Bitcoin (BTC) to eventually reach a long-term target of $1.5 million per coin and Ethereum (ETH) to climb to $31,500. However, he offered a dramatically different outlook for XRP.

Instead of predicting gains, Alfred remarked that his long-term target for XRP is “negative $5 per coin.” Since cryptocurrencies cannot trade below zero in practice, market participants interpreted the statement as sarcasm and an expression of extreme bearishness rather than a literal price forecast.

Alfred’s View Clashes With Growing $5 XRP Narrative

Alfred’s comments come as the $5 XRP target continues to gain traction among analysts and members of the XRP community.

In 2024, crypto analyst Altcoin Moe predicted that XRP would reach $5 during the 2025 bull market. Although XRP delivered a strong rally, it peaked at around $3.65, falling short of that milestone.

Earlier this year, Korean market analyst Ninedex argued that XRP’s ascending channel pattern could drive the asset to $5. He also suggested that a stronger breakout could eventually propel the token toward $20.

Meanwhile, a community-produced research paper proposed another bullish scenario. According to the document, growing institutional adoption of Ripple’s RLUSD stablecoin could indirectly increase demand for XRP by facilitating large-scale XRP purchases. 

Supporters believe such activity could help the token move beyond the $5 mark. However, this theory remains a community hypothesis rather than an established market mechanism.

Against this backdrop, Alfred’s “negative $5” target stands in stark contrast to the increasingly optimistic sentiment surrounding XRP. Many market observers have therefore viewed his remark as an intentionally exaggerated expression of skepticism rather than a realistic valuation.

While the target remains speculative, several analysts and community members continue to argue that favorable market conditions, broader crypto adoption, and increased institutional participation could make such a move achievable over the long term.

On-Chain Data Continues to Support Bullish Sentiment

Despite Alfred’s bearish commentary, XRP supporters continue to highlight several encouraging on-chain indicators.

One of the strongest bullish signals is the continued withdrawal of XRP from centralized exchanges. Investors generally interpret declining exchange balances as a sign that holders are transferring tokens into long-term storage instead of preparing to sell.

Recently, Binance’s XRP reserves declined to a five-month low of 2.6 billion XRP. At the same time, Coinbase recorded a five-month extreme net outflow of 13,000 XRP, suggesting that accumulation activity remains intact.

In another positive development, the XRP Ledger recently surpassed 8 million activated accounts for the first time since its launch more than 13 years ago. Many community members regard this milestone as further evidence of the network’s expanding user base, growing ecosystem activity, and continued long-term adoption, reinforcing the bullish outlook held by many XRP supporters despite Alfred’s pessimistic stance.  

In the meantime, XRP trades at $1.08 and boasts a market cap of $68.11 billion.

XRP Is Up 5% in July—What Historical Midterm Year Returns Suggest

0

XRP has a positive average performance record in July of every midterm year, and its price trend so far suggests a repeat.

At the time of writing, XRP trades at $1.088, down less than 1% in the past 24 hours. While it has dropped 8% from its intra-month high, it remains well above its opening price in July.

Meanwhile, historical data shows that XRP has performed well in July of every midterm year. If this is anything to go by, then higher prices could be on the horizon before this month ends.

XRP Up 5% Already

On July 1, XRP opened at $1.03, having dropped 1.8% the day before. Although the 22% dump in June made it a month to forget, a bright start to July began to change the narrative.

After the first four days, XRP pumped to a high of $1.18, its highest price this month. Although that bullish momentum has subsided, the asset has retained some of its earlier gains. 

At its current price, XRP is up approximately 5% in July. If things close at its stands, it would be the coin’s best-performing month since July 2025. History, however, suggests XRP could close higher this month.

Historical XRP Midterm Performance in July

2026 is a midterm election year in the United States. This event is held every four years and two years into a president’s tenure. During this election, the US House members and one-third of Senators go to the polls for reelection.

For XRP, July of every midterm election year has been positive on average. Since its market debut, it has traded through three midterm years and is on its fourth.

How has it performed? In July 2014, XRP rallied by 34.21% from $0.0036 to close at $0.0051. Four years later, in July 2018, the asset declined by 6.97%, dropping from $0.46 to $0.43.

The last July midterm year’s price action in 2022 was a 14.21% increase from $0.33 to $0.37. This brings the historical average performance for XRP to approximately 14%.

While there is no guarantee of a repeat, this strengthens the case for a macro relief rally this month.

Possible Scenarios and Strong Case for Repeat

XRP could trend higher if history repeats. For context, if it maintains its average 14% growth over the past three sessions, it could close at $1.18, which aligns with its current intra-month high.

In an optimistic scenario, XRP could repeat its 2014 increase and close 34% higher from its opening price. This culminates in a price of $1.39, taking the coin to price levels last seen in May.

Notably, there is a strong case backing the possibility of history repeating for XRP. In June, XRP followed its corrective trend in the midterm years. Its 22% decline was in sync with the 32% drop in June 2022, 39% correction in June 2018, and 17% pullback in June 2014.

XRP Falling Wedge and Inverse Head and Shoulders Point to Imminent Reversal

0

XRP currently changes hands around the $1 psychological level, with two well-known bullish chart patterns pointing to a possible trend reversal. 

Now trading for $1.08, the token has spent the past several weeks moving within a narrowing price range, which has allowed a falling wedge and an inverse head and shoulders pattern to form on the daily chart.

The current situation suggests that XRP could soon reach a turning point. As the price continues to tighten between key support and resistance levels, a larger move could ensue once it breaks out of the current range.

XRP Falling Wedge Shows Selling Pressure Is Fading

One of the main patterns on XRP’s chart is the falling wedge, which appears near the end of a downward trend. Notably, this pattern forms when price moves between two downward-sloping trendlines, with the lower trendline falling faster than the upper one. 

As the space between the two lines becomes smaller, sellers begin to lose strength while buyers continue stepping in.

XRP has been trading in a tight range between $1.08 and $1.10, staying within these converging trendlines after a long period of decline. The narrowing price action suggests that the current consolidation phase may soon come to an end.

XRP Forming Inverse Head and Shoulders

Alongside the falling wedge, XRP has also developed an inverse head and shoulders pattern, another formation that precedes a reversal. 

The pattern consists of three consecutive lows, with the middle low dropping below the other two to form the head, while the two outer lows create the shoulders. In this pattern, a move above the neckline confirms the pattern.

XRP has built this structure over the past six weeks. The left shoulder formed at $1.05 on June 6, creating the first major low. 

The price later dropped to $1.008 on June 26, forming the head and marking the lowest point of the recent correction. Meanwhile, the right shoulder appeared at $1.0531 on July 13, almost matching the left shoulder.

XRP Forming Inverse Head and Shoulders

Importantly, the neckline sits around $1.18, which also acted as resistance during XRP’s recovery attempt earlier this month. A solid move above this level would complete the pattern and confirm the case for a broader recovery.

As long as XRP remains above the $1.05 to $1.07 support range, the right shoulder stays intact and both bullish patterns remain valid. However, if the price falls below $1.05, the inverse head and shoulders pattern would lose its validity.

Key Resistance and Price Targets for XRP

On the upside, the $1.15 to $1.18 area remains the most important level to watch. A daily close above this range would confirm both the falling wedge breakout and the neckline break from the inverse head and shoulders. 

Even after a breakout, XRP still needs to overcome another resistance zone between $1.18 and $1.20, which stopped the previous rally. Buyers must clear this level before a larger upward move can develop.

If XRP breaks above the neckline, the inverse head and shoulders pattern points to an initial target between $1.25 and $1.35. This target comes from measuring the distance between the head at $1.008 and the neckline at $1.18, then adding that distance above the breakout point. 

A complete breakout from the falling wedge gives a wider target between $1.45 and $1.55, but reaching that range would depend on continued buying pressure and supportive conditions from the broader cryptocurrency market.

Ripple SVP Explains How XRP and RLUSD Fit Into Company’s Institutional Strategy

Ripple has unveiled a series of institutional partnerships involving the XRP Ledger (XRPL).

The company said collaborations with Mastercard, JPMorgan, Ondo Finance, and OKX are to expand blockchain use across traditional and digital finance.

In a video shared by Grayscale, Ripple SVP Jack McDonald outlined the company’s latest institutional strategy. He highlighted the role of both the XRP Ledger and Ripple USD (RLUSD) in driving real-world adoption.

Mastercard, JPMorgan, and Ondo Finance Collaboration

During the interview, McDonald, CEO of Standard Custody and Ripple’s Senior Vice President of Stablecoins, said Ripple is focusing on building institutional-grade infrastructure for moving value.

McDonald said Ripple recently announced a collaboration involving Mastercard, JPMorgan, and Ondo Finance. Trades in the initiative will settle on the XRP Ledger.

“Everything we do at Ripple is built around serving institutions and building institutional-grade infrastructure to help move value,” McDonald said.

He described the collaboration as another step toward connecting traditional finance with blockchain-based settlement.

OKX Expands RLUSD Support

McDonald also highlighted Ripple’s recent partnership with OKX. He said the exchange now supports RLUSD across multiple products.

According to McDonald, RLUSD can be used for spot trading, derivatives trading, and as collateral. This expands the stablecoin’s use beyond payments.

The partnership is part of Ripple’s effort to make RLUSD available on major crypto exchanges before expanding its enterprise use cases.

RLUSD Shifts Focus from Growth to Utility

McDonald said RLUSD has gained strong momentum since launching about 18 months ago. The stablecoin has grown to a market capitalization of roughly $1.6 billion.

However, he said Ripple considers real-world utility more important than market capitalization over the long term.

According to McDonald, Ripple has largely achieved its initial goal of listing RLUSD on major exchanges. It has also built supporting infrastructure through market makers and custodians.

With that foundation in place, Ripple’s next focus is expanding institutional use cases for RLUSD. The company also plans to continue using the XRP Ledger as its settlement infrastructure.

Accelerated RLUSD Issuance in July

As The Crypto Basic reported earlier this month, Ripple accelerated RLUSD issuance in early July, minting $291.6 million across the XRP Ledger (XRPL) and Ethereum in two days. About $225.8 million (77%) was issued on XRPL.

On July 1, Ripple minted $169.8 million in RLUSD, with nearly all of it on XRPL. The following day, it minted another $121.8 million while burning $68.1 million as it adjusted supply between the two networks.

Across both days, XRPL recorded $225.8 million in mints and $58.1 million in burns, resulting in a net increase of $167.7 million. Ethereum saw $65.8 million in mints and $10.05 million in burns, adding $55.75 million to supply.

Familiar Weekly XRP Dominance Pattern Points to Major Reset

0

XRP dominance is completing a weekly MACD reset that previously preceded major rallies, with the current setup signaling a potential reversal.

The XRP dominance is printing one of the most interesting weekly chart setups seen in months. After nearly a year of steady decline, momentum indicators are approaching levels that have historically marked the beginning of major upside moves.

XRP Weekly MACD Reset Mirrors Previous Events

Currently, the XRP dominance sits at around 3.128%, down 2.5% in July. The trend follows a broader sideways trend, where the asset has lost 18% of its share of the total crypto market cap this year.

Meanwhile, a positive signal is emerging from the MACD on the weekly dominance chart. The indicator is having another full momentum reset, a pattern that has only appeared a handful of times in the past two years.

An accompanying chart shows that XRP has seen the MACD histogram bars move from red to green only three times since late 2024. The first in November 2024 led to a 350% surge in dominance from 1.24% to 5.58%.

XRP Dominance Weekly Chart

The second was in July 2025. The reset aligned with a 16.5% XRP dominance rally to 5.52%. The latest reset occurred in early June when the MACD histogram started to form small green bars, signaling a momentum shift. 

Notably, each previous reset came after an extended period of weakness and preceded a sharp move higher in XRP’s share of the overall cryptocurrency market. The current setup is beginning to resemble those earlier momentum transitions.

First Major Signal After Prolonged Consolidation

An asset often starts a strong expansion after prolonged periods of consolidation and momentum resets. The longer an asset spends correcting and building a reliable pattern, the stronger the subsequent move becomes when buyers return.

That is what makes the current XRP dominance structure noteworthy. The technical indicator has spent months below the zero line and printing red bars. From a technical perspective, this type of extended consolidation can create favorable conditions for a powerful reversal if market sentiment improves.

The weekly MACD is now at levels that previously coincided with major turning points, suggesting the downside momentum that has dominated since July 2025 is beginning to fade.

XRP Dominance Eyes Rebound

If XRP dominance follows its historical behavior, the next move could be upward.

The previous two momentum resets led to significant upside moves that reclaimed a large portion of the preceding decline. The current setup suggests that another momentum shift could develop once the bullish MACD momentum strengthens.

While there are no certainties, the similarities between the current chart structure and previous cycle bottoms are becoming increasingly difficult to overlook.

Should the XRP dominance mirror the first event and rally 350%, it would mean controlling around 14% of the total crypto market cap, significantly impacting its price. However, mirroring the more modest 16.5% increase in July 2025 would take the current market dominance to 3.65%.