Home Blog Page 7

Micron Rebounds 5.5% as Memory Tightness Returns to Focus, Taiwan Labor Talks Hit Key Date

0

Micron Technology shares jumped 5.5% to $977.50 on Thursday, putting the stock back above its pre-Monday level as tight memory supply returned to the center of the semiconductor trade.

The rebound now meets a company-specific labor test in Taiwan, where Friday is one of two key mediation dates, and unions have warned they could move toward a strike vote if Micron fails to produce a concrete profit-sharing proposal.

Micron Erases Monday’s AI-Slowdown Selloff

Micron fell 5.25% to $924.03 on Monday as calls from several AI-industry leaders for slower AI development pressured chipmakers. By Thursday’s close, the stock had climbed back to $977.50, about 0.2% above its Sept. 11 close of $975.26, effectively erasing the net loss from the week’s initial AI-slowdown shock, according to Micron’s historical closing prices. Reuters reported that the Monday decline came as AI-slowdown warnings broadly hit semiconductor shares.

Thursday’s move was not isolated. Intel gained 7.7%, AMD rose about 6.5%, and SanDisk advanced 6.2% during a broad semiconductor rebound, while falling oil prices and Treasury yields also supported the wider market. Micron also had a memory-specific tailwind after Intel CEO Lip-Bu Tan warned that memory capacity remained constrained and supply pressure could persist into next year.

That supply backdrop matters because Micron’s recent earnings have been built on unusually strong memory pricing and margins. Micron’s fiscal third-quarter results showed revenue of $41.46 billion and a non-GAAP gross margin of 84.9%, followed by guidance for roughly $50 billion of fourth-quarter revenue and an approximately 86% gross margin.

Wall Street is also focused on how long the memory shortage can last. Goldman Sachs maintained a “Neutral” rating and $1,100 target on Sept. 11, expecting another strong quarter because of tight DRAM and NAND conditions while flagging longer-term supply additions, particularly from China. TD Cowen’s Krish Sankar, by contrast, reiterated a “Buy” rating and $1,600 target this week, arguing that Micron appears further along in margin expansion than in the underlying demand cycle. 

Taiwan Labor Dispute Puts Supply Risk Back in Focus

The same tight-supply story that helped Micron shares Thursday increases the significance of its Taiwan labor dispute. According to Reuters’ report on Micron’s Taiwan labor dispute, unions representing more than 80% of Micron’s roughly 15,000 Taiwan employees are seeking a permanent system allocating 15% of operating profit to employees. Union representatives said that if Micron does not present a concrete proposal during the Sept. 18 and Sept. 21 process, they could declare negotiations broken down and move toward a strike vote.

No strike had been called, and production had not been affected in Reuters’ latest confirmed report. Friday marks the Taichung union’s scheduled first mediation session, while further mediation involving the Taoyuan union is scheduled for Sept. 21. A Friday-morning status review found no confirmed strike announcement or production interruption.

Taiwan is nevertheless a critical Micron manufacturing center for DRAM and high-bandwidth memory, meaning an eventual work stoppage could matter more while memory supply is already constrained. Micron has said it remains committed to participating in mediation in good faith.

The dispute continued even after Micron announced fiscal-2026 rewards worth 35 to 68 months of pay for Taiwan direct labor employees. The union has argued that those awards are one-off compensation rather than the permanent, transparent profit-sharing structure it is seeking. Reuters detailed Micron’s Taiwan compensation package.

Tokenized Micron Market Remains Active

Separately, Micron’s tokenized counterpart remains active on Binance. Binance officially opened MUB/USDT Spot trading in June, establishing MUB as an active bStock linked to Micron.

At the latest check on Friday morning, Binance’s MUB/USDT Spot market showed MUB at $992.49.

MUB trades in a different market and measurement window from Micron’s Thursday 5.5% regular-session gain, so the figures should not be treated as directly equivalent. Binance states that MUB is a bStock issued by BTech Holdings representing an interest in underlying securities rather than direct ownership of Micron shares.

Micron’s next confirmed financial catalyst comes Sept. 30, when the company will hold its fiscal fourth-quarter earnings call at 2:30 p.m. Mountain time. Micron confirmed the Sept. 30 earnings date in August.

Investor Takeaway

Micron’s 5.5% Thursday rally restored the stock to roughly its pre-Monday level as attention swung back from AI-spending concerns toward memory scarcity. The Taiwan dispute now tests that supply narrative from another direction, with the Sept. 18 and Sept. 21 mediation process preceding any potential strike vote and Micron’s Sept. 30 earnings providing the next confirmed financial update.

DraftKings Stock Sinks 7.6% as Needham Data Show Kalshi Leading NFL Prediction Volume

0

DraftKings shares sank 7.6% Thursday to $22.47, extending its losing streak to three sessions while new Needham data showed Kalshi with a commanding lead in NFL Week 1 prediction-market volume.

The weakness developed during regular trading, not before the open. DraftKings was little changed at $24.38 at 9:29:59 a.m. ET, versus Wednesday’s $24.33 close, before sliding through Thursday’s session; Flutter also fell 5.2%, while the Nasdaq rose 1.7%.

Kalshi’s NFL Lead Raises Competitive Pressure

Needham’s exchange-level analysis of NFL Week 1 showed $14.6 billion of sports-and-parlay prediction-market volume across eight exchanges, matching the first 14 weeks of last NFL season combined. Kalshi accounted for 76% of that volume, while DraftKings’ DKeX exchange accounted for around 3% of both total volume and Needham’s estimated consumer-equivalent handle. 

That comparison comes with an important qualification. Needham said exchange data can overstate Kalshi and Polymarket because other operators route activity through their exchanges, while understating DraftKings because it distributes volume across multiple exchanges. The firm expects DraftKings to concentrate more activity on DKeX over time.

The exchange-share data also has a current counterpoint. Stifel’s Jeffrey Stantial reiterated a Buy rating Thursday while emphasizing DraftKings’ parlay capabilities. Stifel said CFTC-regulated single-wager sports volume fell 30% month over month in August to $18.6 billion, while “combo” volume—effectively sports parlays—rose 22% to $18.8 billion. The firm argued that DraftKings and Flutter can compete for market-making flow using their pricing and correlation models and balance-sheet capacity, while cautioning that notional exchange volume can exaggerate parlay activity relative to conventional handle.

Meanwhile, the regulatory environment for prediction markets continued to evolve Thursday. In a new no-action position for passive software providers, CFTC staff said it would not recommend enforcement over introducing-broker or associated-person registration solely for qualifying software that facilitates trading through registered intermediaries and designated contract markets.

The regulatory picture is not one-directional. A day earlier, the 9th U.S. Circuit Court of Appeals blocked Kalshi from offering sports-event contracts on two California tribal lands, finding the tribes were likely to prevail on claims involving federal Indian gaming law and tribal ordinances. The case underscores that prediction markets are expanding while their regulatory boundaries remain contested. 

DraftKings’ Prediction Push Meets a Profitability Test

DraftKings entered football season already committing substantial resources to Predictions. In its second-quarter results, the company said revenue fell 5% year over year to $1.443 billion, mainly because of customer-friendly sports outcomes and greater promotional reinvestment in Sportsbook and Predictions. 

Management nevertheless maintained 2026 revenue guidance of $6.5 billion to $6.9 billion and adjusted EBITDA guidance of $700 million to $900 million, while saying the core business remained on track for roughly $1 billion of adjusted EBITDA. 

The stock initially rallied after those results. DraftKings released them after the Aug. 6 close of $22.17, and shares jumped 8.4% to $24.03 on Aug. 7. DraftKings shares then climbed to $26.14 by Aug. 14.

That recovery then encountered another company-specific development. On Aug. 17, DraftKings launched a proposed $600 million term loan B and a new $750 million revolving credit facility, with term-loan proceeds intended partly to repurchase convertible notes due in 2028. Shares fell 2.2% in morning trading following the announcement and closed 3.2% lower at $25.30; they dropped another 5.0% the next session to $24.04. The company later closed an upsized $700 million term loan alongside the $750 million revolver.

The earnings-window analyst response was mixed. Benchmark raised its price target to $30 from $29 while maintaining a ‘Buy’ rating, while JPMorgan cut its target to $33 from $34, Guggenheim to $33 from $35, and Barclays to $34 from $35, with all three retaining their positive ratings.

Guggenheim said its reduction followed updated estimates incorporating DraftKings’ second-quarter results and reaffirmed its 2026 outlook. Citi subsequently moved in the other direction, raising its target to $32 from $30 while keeping ‘Buy’ and arguing that prediction markets could expand DraftKings’ addressable market.

Thursday’s $22.47 finish leaves DraftKings only about 1.4% above its Aug. 6 pre-earnings close, but about 14.0% below its Aug. 14 rebound close of $26.14, after three consecutive losing sessions.

DKNGx Extends DraftKings Exposure Beyond the Nasdaq Session

Kraken lists tokenized DraftKings as DKNGx for eligible clients in supported markets. Kraken says each DKNGx token is backed 1:1 by DraftKings shares held by a third-party custodian, but owning the token does not constitute direct ownership of the underlying DKNG share or provide shareholder rights.

Kraken’s broader xStocks service supports 24/5 trading, allowing tokenized exposure outside traditional U.S. equity hours. That token-market activity remains distinct from Nasdaq trading and should not be treated as a prediction of DraftKings’ next regular-session opening price. 

DraftKings’ official investor calendar currently shows its Aug. 7 Q2 earnings call as the latest listed event, so the company has not posted a confirmed Q3 earnings date there.

Investor Takeaway

DraftKings’ Thursday slide puts the focus on whether its nationwide Predictions expansion can convert NFL-season demand into attractive economics while Kalshi holds a large exchange-volume lead. 

The counterweight is DraftKings’ established sportsbook and parlay infrastructure, alongside management’s maintained 2026 profitability guidance. Upcoming NFL-week activity and regulatory developments should provide the next measurable tests.

Here’s How Much XRP Has Risen Over the Last 10 Years

0

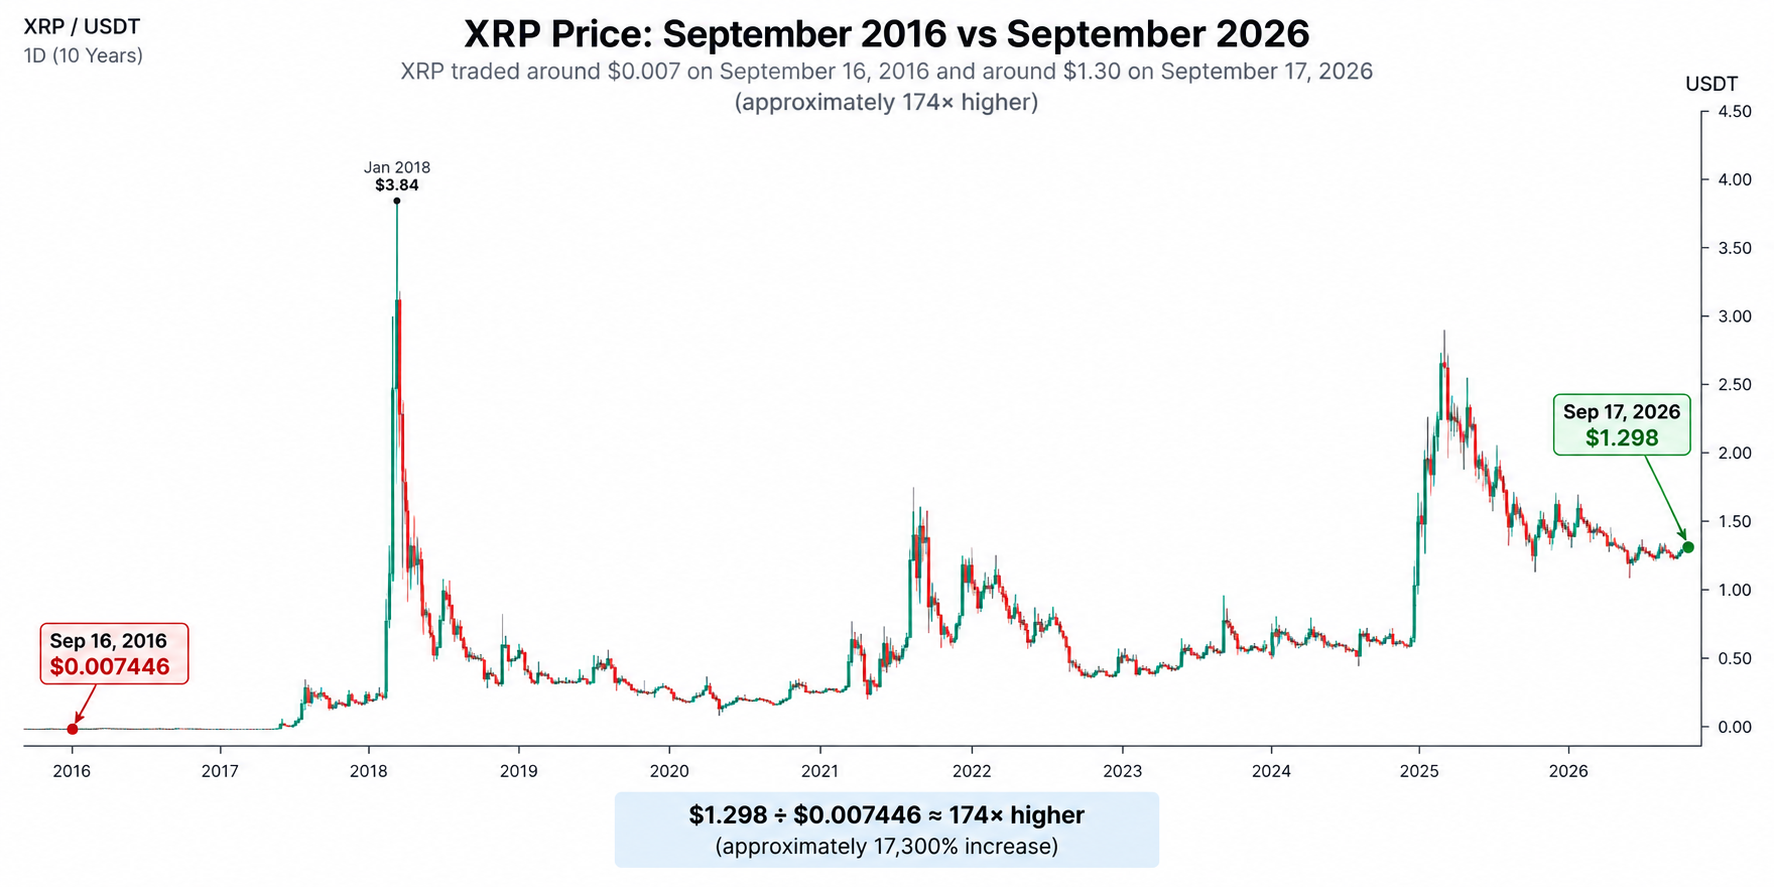
XRP is trading near $1.30 in September 2026, but its price was below one cent around the same period a decade ago. Historical market data shows the scale of XRP’s price increase over the last 10 years.

CoinMarketCap’s historical snapshot for September 16, 2016 recorded XRP at approximately $0.007446. Data around September 17–18, 2016 also places XRP below $0.01, far below its current price.

XRP Rose From $0.0074 to Around $1.30

XRP Price Over the Last 10 Years

On September 17, 2026, XRP was trading around $1.30. Investing.com recorded a price of approximately $1.3017, while a CryptoCompare-sourced dataset published by YCharts placed XRP at $1.298.

The chart also shows XRP at approximately $1.2945, keeping the current market price within the same $1.29–$1.30 region.

Using $1.298 as the current reference price and $0.007446 as the September 2016 reference:

$1.298 ÷ $0.007446 = approximately 174.3,

This means $1 of XRP purchased at the September 2016 price would represent approximately $174 in market value at $1.298, excluding fees and assuming the same number of XRP was held throughout the period.

XRP Has Increased Roughly 17,300% in 10 Years

Measured as a percentage change, XRP has increased approximately 17,300% between the two reference dates.

Period XRP Price
September 2016 ~$0.007446
September 2026 ~$1.298
Price multiple ~174.3×
Percentage increase ~17,300%


The ten-year period also included substantially higher XRP prices. XRP moved above $3 during the 2017–2018 crypto cycle, before falling sharply in subsequent years. The chart shows another major advance beginning in late 2024, followed by prices above $3 during 2025 and a subsequent decline toward the current $1.30 region.

Based on the cited historical and current reference prices, XRP’s ten-year change is approximately $0.007446 to $1.298 — a gain of about 17,300%.

JPMorgan Says Bitcoin Could Gain More Than Gold if ETF Hedging Eases

0

JPMorgan Data Shows Bitcoin ETF Hedging Remains Elevated Versus Gold.

JPMorgan has identified a significant difference between investor positioning in Bitcoin and gold, with derivatives and short-selling data showing greater hedging activity around Bitcoin-related products.


JPMorgan says Bitcoin could receive stronger price support relative to gold if investors reduce hedges linked to spot Bitcoin ETFs.

BlackRock’s iShares Bitcoin Trust (IBIT) had approximately 45.93 million shares sold short as of August 31, 2026. The position was valued at roughly $2.05 billion and had increased 23.8% from the previous reporting period. Shorted shares represented about 3.53% of IBIT’s public float.

Options positioning provides another measurable difference. IBIT has a higher put-to-call open-interest ratio than SPDR Gold Shares (GLD), indicating greater use of downside-oriented options positions around the Bitcoin fund.

Fund-flow data also separates the two markets. During 2026, capital returning to gold ETFs has offset their previous withdrawals. Bitcoin ETFs, by comparison, have regained approximately 50% of their earlier outflows, according to JPMorgan’s figures.

The outstanding IBIT short positions are relevant because closing a conventional short requires purchasing shares to return borrowed stock. Therefore, any reduction in the 45.93 million-share short position would involve corresponding share purchases.

JPMorgan’s analysis identifies Bitcoin as having greater positioning support relative to gold if ETF hedges are reduced. The bank did not quantify a Bitcoin price target or state that short covering will occur.

Fiction Finance Predicts XRP Price Over the Next Six Months

0

Fiction Finance shares six-month crypto targets for March 2027, including XRP, Bitcoin, Ethereum, Solana and others.

XRP is drawing fresh attention after Fiction Finance, an X account followed by nearly 600,000 users, listed $3 as its XRP target for the next six months. The forecast would place XRP substantially above its current September 2026 trading range.

XRP was recently quoted around $1.27–$1.36 across market-data and forecasting platforms. From $1.30, a move to $3 would require an increase of approximately 131%.

Fiction Finance Sets $3 XRP Target

The six-month projection places the relevant period around March 2027. At $3, XRP would be trading roughly $1.70 above a $1.30 starting price.

The target can be expressed numerically as:

$1.30 → $3.00 = +130.8%

The $3 figure is a forecast published by Fiction Finance rather than an established future price.

Six-Month XRP Forecasts Differ Sharply

Other publicly available models show considerably different numbers for approximately the same period.

Changelly’s current March 2027 forecast lists XRP at a $1.14 minimum, $1.75 average and $2.36 maximum. Its broader 2027 model extends as high as $3.33 by December.

CryptoPredictions currently lists March 2027 estimates of approximately $1.29 minimum, $1.52 average, and $1.90 maximum.

CoinCodex’s updated model places March 2027 between approximately $1.36 and $1.66, with an average near $1.43. Its model does not reach the $3 region until later in 2027.

DappRadar’s monthly projection shows March 2027 at approximately $0.93 minimum, $1.45 average, and $2.26 maximum.

$3 Would Put XRP Near Its Recent High Range

XRP’s 52-week high was recently listed around $3.12. A $3 price would therefore place the token approximately 3.8% below that level. (CryptoTicker.io)

The available six-month forecasts consequently span a broad range. For March 2027, the models reviewed here produce central or average estimates from roughly $1.43 to $1.75, while their upper estimates extend to approximately $1.66–$2.36.

Fiction Finance’s $3 target stands above those March 2027 model ranges and represents an approximately 131% increase from an XRP price of $1.30.

Price Targets for Bitcoin, Ethereum and Other Assets

Fiction Finance also published a set of crypto price targets for the next six months, including $125,000 for Bitcoin, $5,000 for Ethereum and $300 for Solana. The post tells readers to “come back in March,” establishing March 2027 as the approximate comparison point for the forecasts.

The complete set of published targets is:

Asset Six-Month Target
Bitcoin (BTC) $125,000
Ethereum (ETH) $5,000
Solana (SOL) $300
XRP $3.00
Dogecoin (DOGE) $0.50
Zcash (ZEC) $2,500
Hyperliquid (HYPE) $200
NEAR Protocol (NEAR) $8.00
Ethena (ENA) $0.50

Bitcoin Road to $90,000 May Include One More Major Higher Low

0

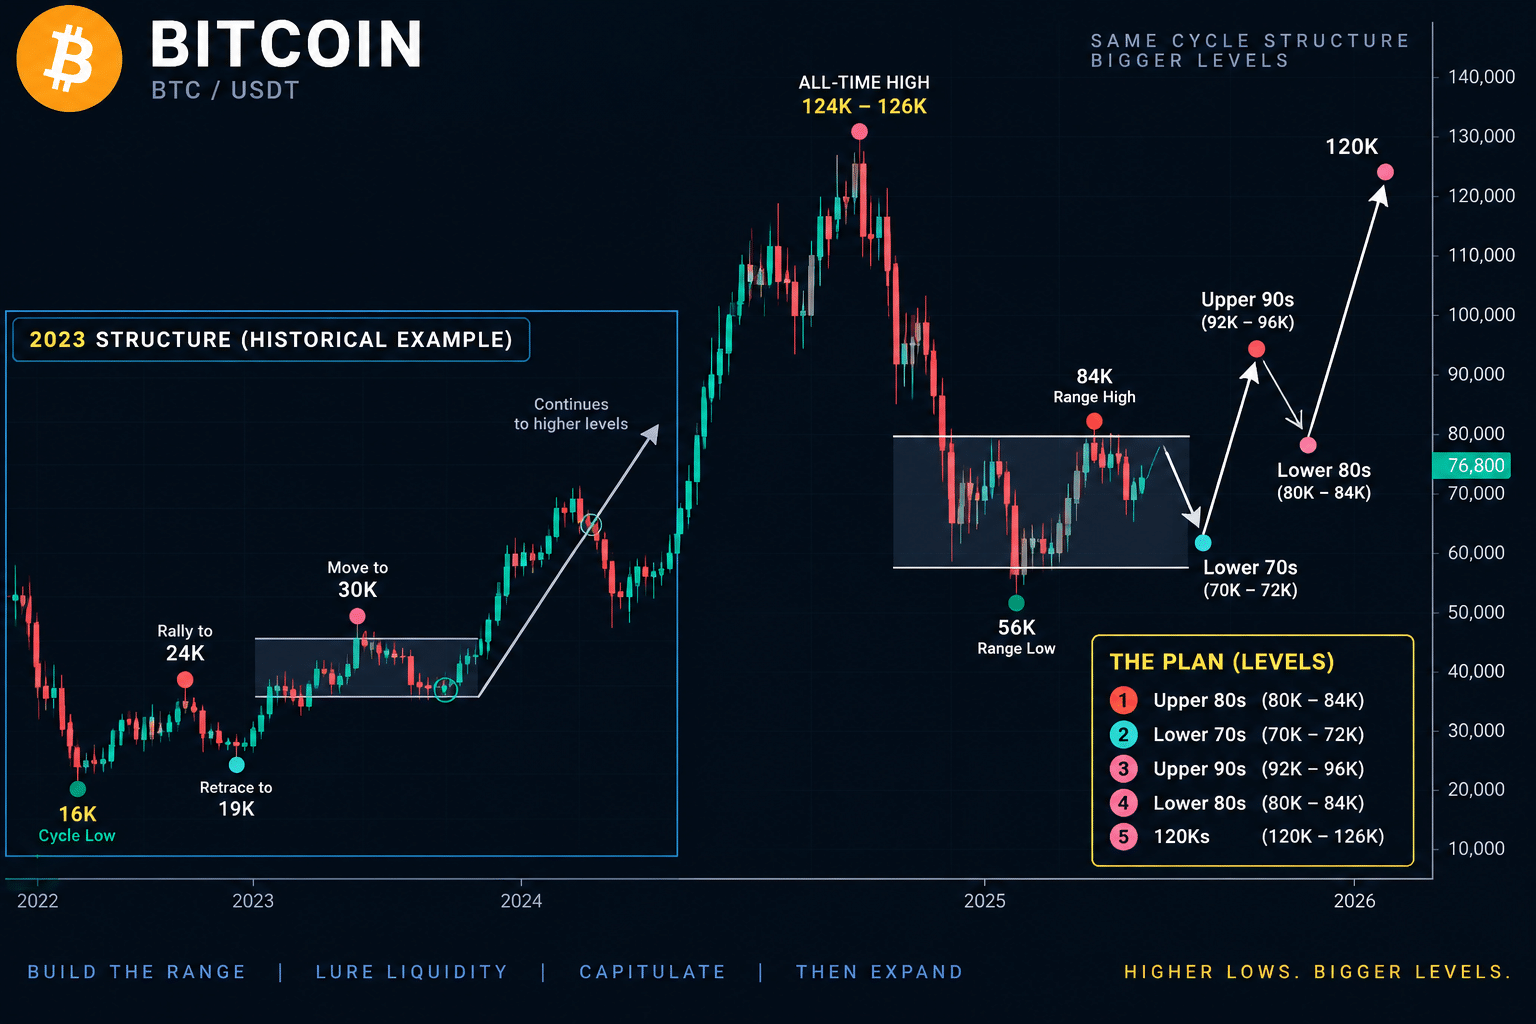
Bitcoin’s Current Range Mirrors a Key 2023 Structure as $70K–$90K Levels Come Into Focus.

Bitcoin’s long-term chart shows a recurring sequence of rally, consolidation, downside liquidity sweep, and renewed expansion. The current structure is developing between roughly $60,000 and $84,000, following the decline from the chart’s major high near $124,000–$126,000.

The chart also highlights a 2023 structure as a historical comparison. The price levels and sequence are similar in form, although the present structure is occurring at substantially higher nominal BTC prices.

Bitcoin’s Current Range Mirrors a Key 2023 Structure
AI-generated illustration by The Crypto Basic

Bitcoin’s 2023 Structure

The earlier section begins with Bitcoin bottoming around $16,000 following a prolonged decline. BTC subsequently recovered to approximately $24,000, establishing the first major rebound from the cycle low.

Price then advanced toward roughly $30,000–$31,000, but that move did not immediately produce sustained continuation. BTC moved back toward the mid-$20,000s before the larger advance developed.

The chart marks the sequence with colored reference points: a major low near $16,000, a higher reaction low around $18,000–$20,000, a rally toward $30,000, and another pullback into approximately $24,000–$25,000. The following expansion carried Bitcoin through $30,000 and eventually toward the $60,000–$70,000 region.

The Current Bitcoin Range

The right side shows a comparable price sequence at a larger scale.

After reaching approximately $124,000–$126,000, Bitcoin entered a steep decline. The first major downswing reached the mid-$60,000s, followed by a rebound toward approximately $80,000–$82,000.

BTC then returned to the low-$60,000 region, with the deepest wick on the chart extending toward roughly $56,000. From that low, price recovered rapidly back into the upper-$70,000 area.

The latest candles are positioned around $76,000–$78,000.

$70K–$84K Defines the Immediate Structure

The chart identifies several levels around the current range. The low-$70,000 area sits below the current price and represents the next major zone inside the broader structure. Above price, approximately $84,000 forms the next marked level, followed by the mid-$90,000s.

The projected sequence displayed on the chart is:

Upper $80Ks → lower $70Ks → upper $90Ks → lower $80Ks → $120Ks.

These are projected levels shown by the chart, not completed price movements.

A move into the lower $70,000s would still remain well above the chart’s approximately $56,000 reaction low, meaning it would constitute a higher low relative to that wick.

A Range-High Deviation Is Also Shown

The 2023 comparison contains another notable feature: price moved above a local range before subsequently retracing.

Applied to the current structure, the equivalent sequence would involve BTC first moving toward or through the $80,000–$84,000 range highs, followed by a return toward the lower part of the range.

From a liquidity-structure perspective, this would create price activity on both sides of the established range before a directional break.

Latest Five Candles Show Strong Rebound Followed by Compression

The five most recent candles show a sharp transition from selling to recovery.

The sequence begins around the $63,000–$65,000 region, followed by a large bullish expansion candle that pushes BTC rapidly into approximately $77,000–$80,000. The next candles have considerably smaller real bodies around the upper-$70,000s.

Upper wicks near $80,000–$82,000 show that price has traded above the recent closes but has not maintained those intraperiod highs. At the same time, the latest bodies remain well above the previous $60,000–$65,000 consolidation.

This produces a clear short-term structure: strong rebound followed by price compression beneath the $80,000–$84,000 area.

Wyckoff Structure: Range Development After Markdown

The decline from approximately $124,000 to the $56,000–$64,000 region represents the chart’s markdown phase. The subsequent sideways movement between the low-$60,000s and low-$80,000s is consistent with a developing trading range.

Within Wyckoff terminology, the current structure is therefore closer to range development/testing following markdown than an established markup phase.

The chart does not display volume, so volume-based Wyckoff confirmation cannot be measured from this image.

The principal figures visible in the current structure are $56K–$64K for the established lower extreme, $70K–$72K as the highlighted higher-low region, $80K–$84K around the current upper range, the upper $90Ks as the next projected expansion area, and the $120K region as the final projected level shown on the chart.

Ric Edelman Sees $500,000 BTC by 2030, Compares Bitcoin to Amazon in 1999

0

Ric Edelman compares Bitcoin’s adoption to Amazon in 1999 and predicts BTC could reach $500,000 by 2030 as global adoption expands.

Veteran American financial adviser Ric Edelman has made a striking comparison between Bitcoin’s current stage of adoption and Amazon during the early days of the internet boom. In a September 17 interview with Bitcoin Magazine TV, Edelman said he expects Bitcoin to become far more widely held over time and reiterated his $500,000 BTC forecast for 2030.

Edelman Draws a Bitcoin-Amazon Parallel

Edelman pointed to the uncertainty surrounding Amazon in 1999, when investors were still debating whether the emerging internet company belonged in their portfolios. His argument is that Bitcoin is experiencing a comparable period in which adoption is expanding but remains far from universal.


“Back in 1999, people were arguing over whether to invest in Amazon,”

Edelman said, adding that he expects Bitcoin to follow a similar long-term adoption trajectory.

The comparison concerns adoption rather than identical investment characteristics. Amazon is an operating company with revenue and cash flows, while Bitcoin is a decentralized digital asset.

Why Edelman Calculates $500,000 Bitcoin

Edelman also explained the assumption behind his price projection. His calculation starts with global investment portfolios allocating approximately 1% of their assets to Bitcoin. He argues that this level of worldwide allocation could correspond to Bitcoin reaching roughly $500,000 per coin.


The $500,000 figure is therefore a forecast based on Edelman’s assumed future capital allocation—not a current valuation or guaranteed target.

He also characterized his projection as relatively restrained compared with other Bitcoin forecasts, saying his estimate is “actually kind of low compared to many others.”

Bitcoin Was Near $76,500 During the Comments

At the time of the September 17 report, Bitcoin was trading at approximately $76,522. The report noted that BTC remained substantially below the $126,080 record high reached in October, despite having recorded a strong performance during August.

A move from roughly $76,500 to Edelman’s projected $500,000 would represent an increase of more than 550%.

Edelman Has Backed Bitcoin for Years

The comments are consistent with Edelman’s established position on digital assets. He has publicly discussed Bitcoin for more than a decade and previously said he began researching cryptocurrency in 2013 and investing in early 2014. He has also argued that digital assets could eventually become a regular component of diversified portfolios.

His latest comments extend that long-running thesis: Bitcoin remains far from the level of portfolio penetration Edelman expects in the future, and his $500,000 forecast depends heavily on that adoption gap narrowing by 2030.

Flare Founder Proposes XRP-to-RLUSD Borrowing Directly From XRPL

0

Flare founder Hugo Philion has proposed a way for XRP holders to use their XRP on the XRP Ledger as collateral, borrow RLUSD through Flare, and receive the RLUSD directly in their XRPL wallet.

The idea would let users “borrow RLUSD against their XRP directly from the XRP Ledger” using Flare Smart Accounts, while keeping the borrowed RLUSD on the XRP Ledger.

However, this would require two things:

  • The Wormhole RLUSD bridge must be operational.
  • XRP Ledger validators must approve the PermissionDelegationV1_1 amendment.

PermissionDelegationV1_1 would allow XRPL accounts to give another account permission to perform certain transactions without sharing their private keys. This makes it easier to build more flexible account-management and application features.

How the XRP-RLUSD Flow Would Work

Under Philion’s proposal, users will keep their XRP on the XRP Ledger instead of manually moving it between different wallets. Users could represent XRP on Flare as FXRP and use it as collateral to borrow RLUSD. Users can then send the borrowed RLUSD back to their XRP Ledger wallet.

In simple terms:

XRP on XRPL → FXRP on Flare → Borrow RLUSD → Receive RLUSD on XRPL

XRPL validator Vet described Flare as an “extended arm” of the XRP Ledger. In this setup, users deposit XRP on XRPL, receive FXRP on Flare, borrow RLUSD through Morpho, and get the RLUSD in their XRPL wallet without creating a new wallet or account.

The idea builds on Flare’s existing work to connect XRP with Ethereum-based DeFi. Flare has also received approval for an FXRP lending market involving RLUSD, with Morpho providing the lending infrastructure. Flare is developing Smart Accounts that could allow users to authorize the entire process directly from an XRP Ledger wallet.

Permission Delegation Is Important

PermissionDelegationV1_1 is important because it would allow an XRP Ledger account to let another account carry out certain transactions for it.

The feature uses a DelegateSet transaction to give, change, or remove specific permissions. The authorized account can then make approved transactions without taking control of the original account.

For the feature to go live, XRP Ledger validators must approve the amendment. According to XRPL documentation, it needs more than 80% validator support for two weeks before it can be activated.

For now, PermissionDelegationV1_1 is still going through the validator voting process. This means the proposed Flare lending system depends on the amendment being approved and activated.

Community Reacts to Flare’s XRP Lending Idea

XRP commentator Eri said the proposal builds on infrastructure created through Ripple’s connection with Wormhole.

In simple terms, users could approve the transaction from their XRPL wallet, keep their XRP on the XRP Ledger, and receive RLUSD at the same address. The lending itself would happen through Ethereum-based infrastructure.

Another XRP community member, Krippenreiter, pointed out that users would start and finish the process on the XRP Ledger, while FXRP would represent their XRP on Flare and act as collateral.

This gives XRP holders access to decentralized lending without manually managing several blockchain accounts. For Flare, the proposal would strengthen its role as a link between the XRP Ledger and Ethereum-based DeFi.

What’s Next as XRP Two-Week RSI Falls to a 13-Year Low?

0

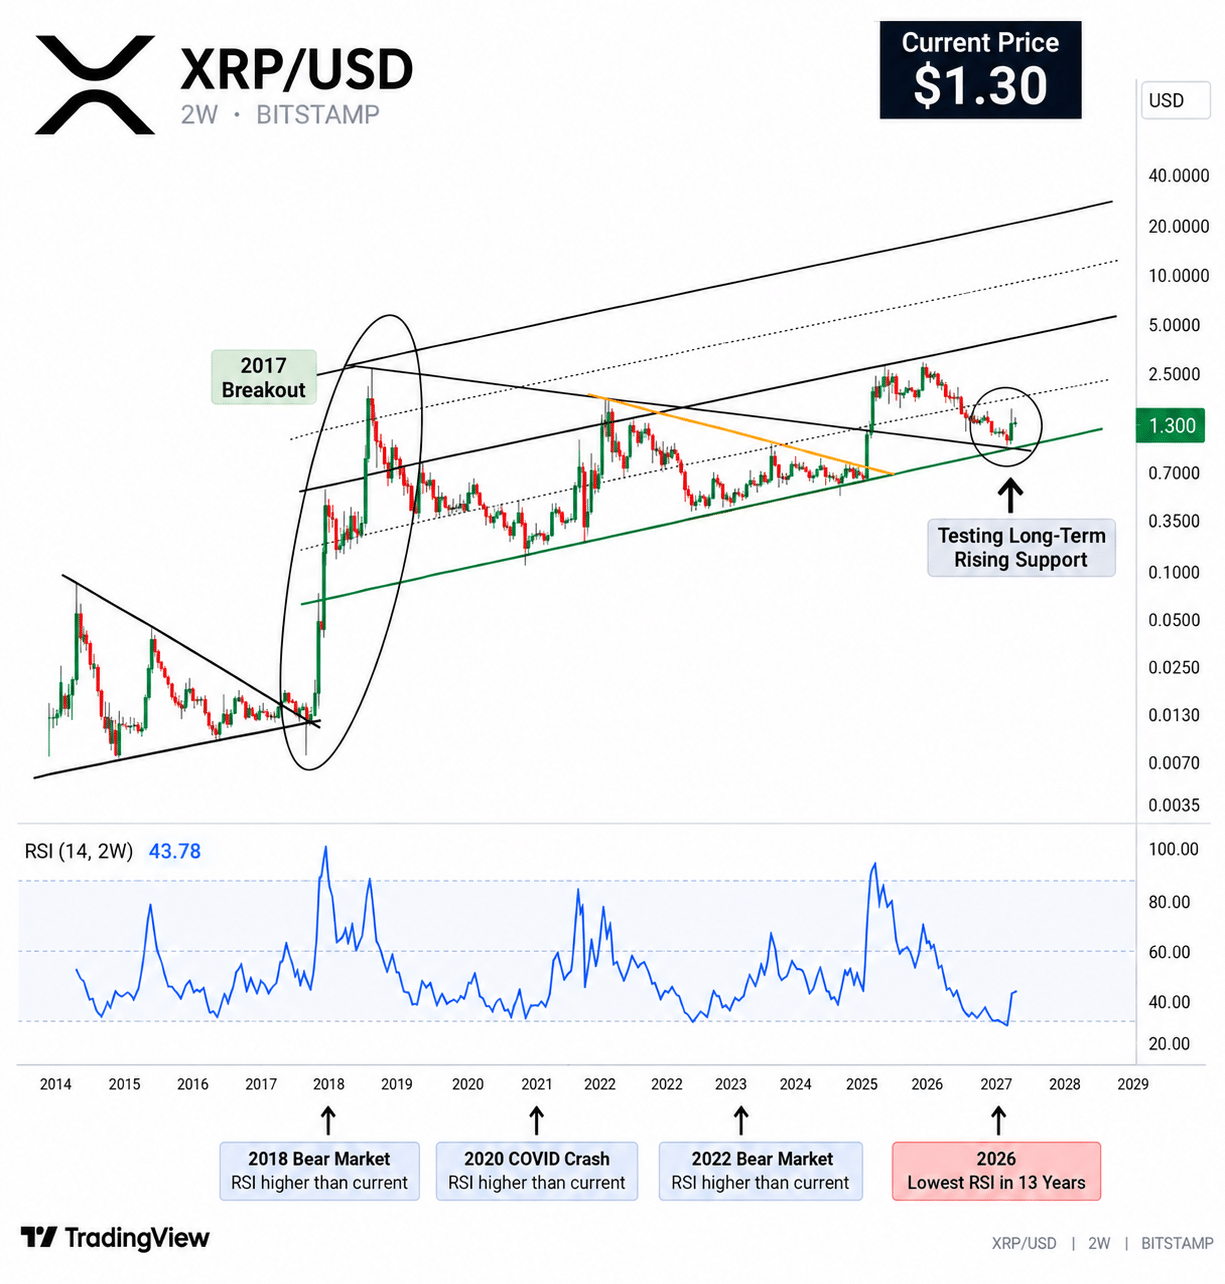
XRP Prints Historic RSI Extreme as Price Tests Long-Term Rising Structure.

XRP is trading around $1.30 on the two-week XRP/USD chart after retreating significantly from its 2025 highs above $3. The decline has brought price back toward the lower boundary of a multi-year ascending structure while momentum has recorded an extreme reading.

XRP RSI ALL TIME LOW
XRP RSI ALL-TIME LOW

XRP’s Two-Week RSI Hits a 13-Year Extreme

The chart marks 33.52 as the recent RSI low, the lowest level displayed across approximately 13 years of XRP history. This reading falls below the RSI lows shown during the 2018 bear market, the March 2020 crash, and the 2022 bear market.

RSI has since rebounded to approximately 43.78, indicating that momentum has recovered from the extreme low even though XRP remains well below its 2025 peak.

XRP Trades Near Long-Term Rising Support

Despite the decline toward $1.30, XRP remains positioned around a rising support trendline extending across several market cycles. The latest candles are clustered close to this lower boundary rather than near the upper portion of the long-term channel.

The chart also highlights the 2017–2018 period, when XRP broke out from an earlier compressed structure before its major historical advance. This is a structural comparison only; the current formation and market conditions are different.

Latest XRP Candles Show Stabilization

The latest five two-week candles show smaller bodies following the larger decline from the 2025 highs. Lower-wick activity around the recent lows indicates buying responses, while upper wicks on rebounds show that selling pressure remains present at higher prices.

Price has therefore shifted from a steep decline into a more compressed structure around the long-term trendline.

Wyckoff Structure Remains in a Testing Phase

From a Wyckoff perspective, the chart currently fits a potential re-accumulation/testing structure rather than confirmed markup. XRP has returned to major structural support following its 2025 expansion, but the recent candles have not yet established a sustained sequence of higher highs and higher lows.

The key data shown on the chart are therefore straightforward: XRP near $1.30, two-week RSI at 43.78 after reaching a historic 33.52 low, price near long-term rising support, and short-term candles showing compression following the 2025–2026 decline.

Together, these features show XRP at a significant long-term structural test, with momentum recovering from its deepest RSI reading displayed on the chart.

XRP Shorts Outgun Longs by 2x at $490M, As Squeeze Corridor Forms from $1.3 to $1.67

0

XRP shorts have increased drastically after the token fell 9% on Sept. 15 following the CLARITY Act’s procedural defeat.

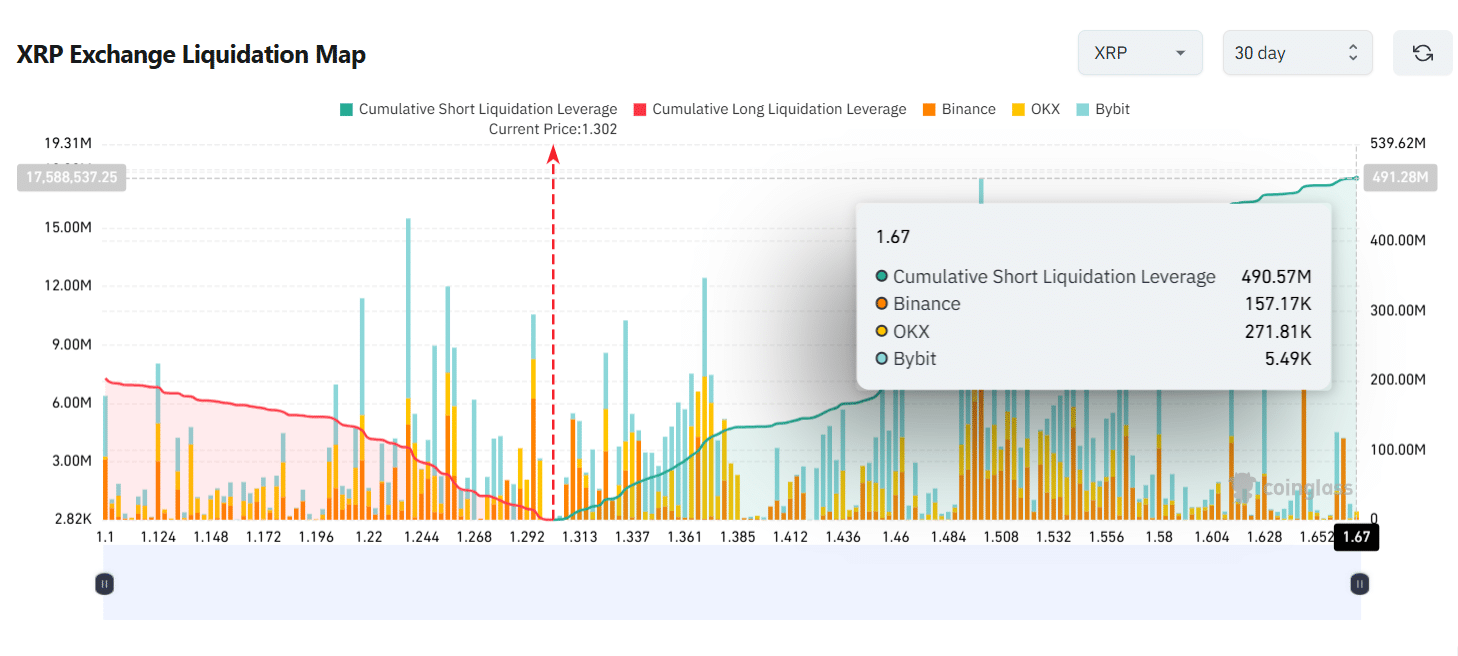
Coinglass data now shows modeled short liquidation leverage at $490 million, more than twice the $203 million in modeled long liquidation leverage. The short structure leaves a potential liquidation corridor between $1.30 and $1.67.

Why XRP Bled the Most

The Senate’s 49-50 procedural vote against the CLARITY Act triggered a much larger decline in XRP than in other major cryptocurrencies. XRP fell from around $1.47 at the start of the session to $1.28, marking a 9% drop in 24 hours and a decline of more than 10% over the week.

Bitcoin fell 3.26% during the same period, while Ethereum declined 4.66%. These figures confirm the stronger selling pressure that XRP faced after the Senate vote. 

XRP’s long connection to the U.S. regulatory discussions could explain the reaction. The token spent years at the center of the SEC’s enforcement case against Ripple, and regulatory developments continue to have a strong effect on its price despite recording a favorable outcome in the lawsuit.

The Senate defeat removed the near-term path toward regulatory clarity provided by the CLARITY Act and increased selling pressure. XRP’s cumulative volume delta also fell to -$10.5 million during the selloff amid strong selling activity.

The $490 Million Short Wall Above $1.30

Data from the Coinglass 30-day XRP Exchange Liquidation Map shows much more modeled liquidation leverage skewed toward the short side.

At $1.67, the top of the 30-day XRP range, cumulative short liquidation leverage reaches $490.57 million. This figure shows the total potential short liquidations that could hit the market if XRP moves from the current price of $1.30 to $1.67.

XRP Cumulative Short Liquidation Leverage Coinglass
XRP Cumulative Short Liquidation Leverage | Source: Coinglass

However, specifically at the $1.67 price tick, Binance has $157.17K in short liquidation exposure, while OKX shows $271.81K and Bybit records just $5.49K. The largest individual short liquidation bar reaches around $17.59 million.

Bears have added to these positions since the CLARITY Act setback, expecting XRP’s regulatory sensitivity to keep the price under pressure. The bill’s failure leaves the market dependent on existing SEC and CFTC guidance.

XRP Sees Smaller Long Liquidation Leverage

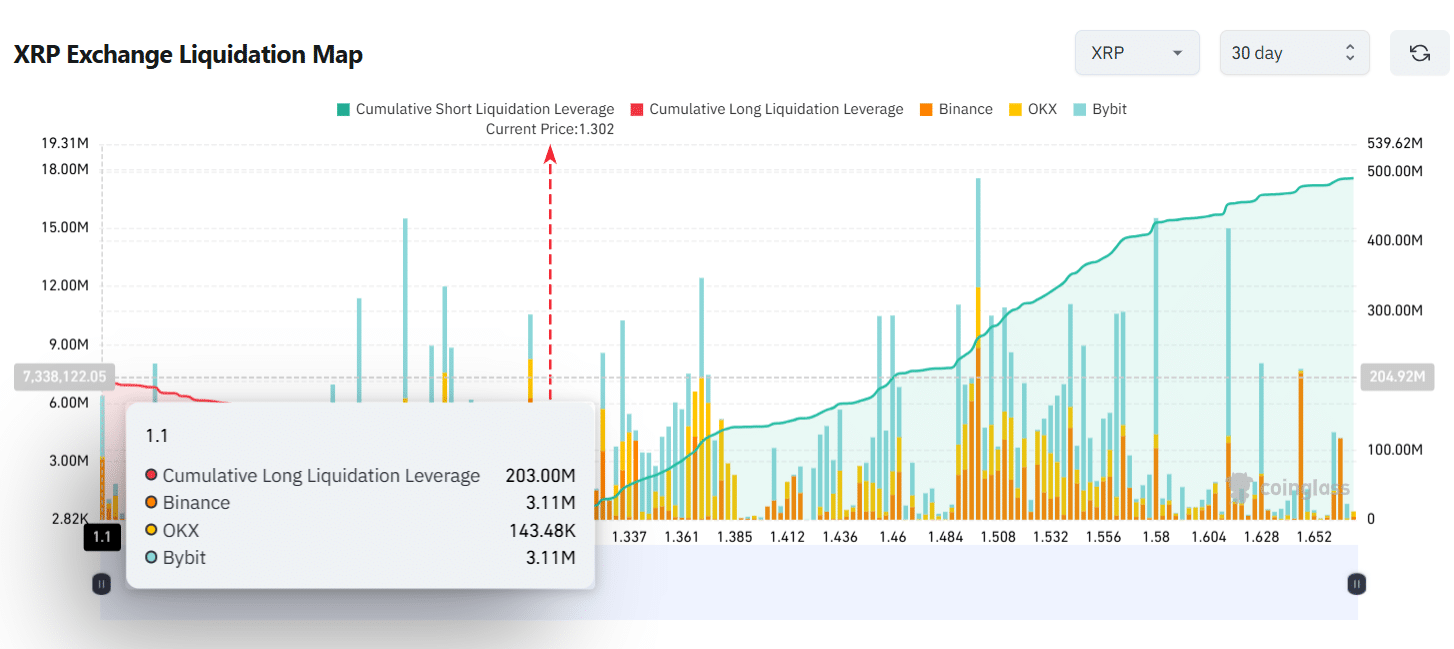
The long side shows much less modeled liquidation exposure. At $1.10, the bottom of the 30-day chart, cumulative long liquidation leverage stands at $203 million. This represents the potential total long liquidation figure if XRP drops from $1.30 to $1.10.

Meanwhile, at the $1.10 price itself, Binance accounts for $3.11 million in long exposure, while OKX shows $143.48K and Bybit also records $3.11 million.

XRP Cumulative Long Liquidation Leverage Coinglass
XRP Cumulative Long Liquidation Leverage | Source: Coinglass

The largest individual long liquidation bar across the visible range reaches approximately $7.34 million near $1.10. Overall, the modeled long exposure below XRP’s current price remains less than half the short exposure above it.

Where XRP Goes from Here

The $490.57 million in modeled short liquidation leverage above XRP and $203.00 million in long exposure below it create the conditions for a possible short squeeze if the token recovers. 

A move toward the $1.46-$1.50 resistance area could force leveraged shorts on Binance and OKX to close, adding buying pressure to any recovery in regular demand.

XRP also retains several factors that could support its broader structure. The token maintains its commodity classification under joint SEC-CFTC oversight, and five live spot XRP ETFs have recorded $1.7 billion in net inflows. XRP remains about 29% higher over the past 30 days despite the latest decline.

The $1.25 level now stands as an important support area. If XRP holds that level, the potential squeeze corridor between $1.30 and $1.67 remains relevant. However, a break below $1.25 could bring long liquidation levels below $1.20 into focus.