Home Blog Page 61

XRP Derivatives Data Reveals Four Pointers Suggesting the Market Has Now Flipped Neutral

0

XRP remains under pressure, but new data from the derivatives market suggests selling pressure has eased.

CryptoQuant analyst Pelinay recently said several Binance indicators now show that XRP has moved into a neutral market structure even as the broader downtrend continues.

According to Pelinay, the latest liquidation data and Binance funding rate reveal four important signals that support this theory.

XRP Liquidation Data Shows a Balanced Market

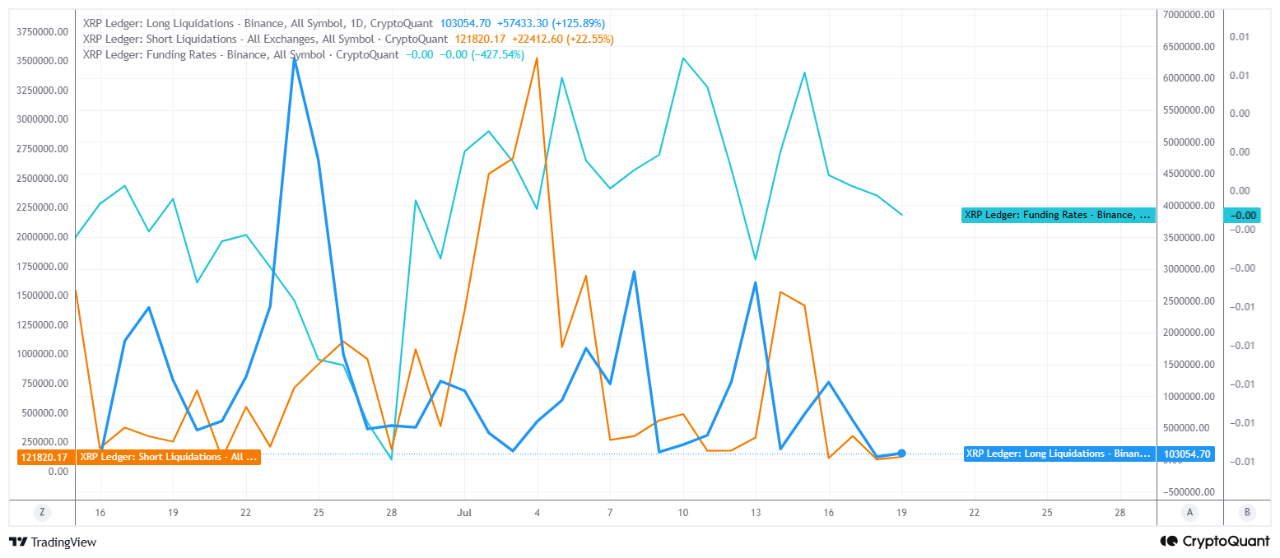
Pelinay first mentioned Binance’s liquidation data. The figures show that long liquidations stand at about 103,000 XRP, while short liquidations are around 122,000 XRP. The small gap shows that neither side has suffered significantly larger losses.

The analyst explained that much higher long liquidations would have indicated strong selling pressure, as bullish traders would have been forced out of their positions. 

On the other hand, much higher short liquidations would have pointed to a short squeeze due to stronger buying activity. Since both figures remain close, neither bulls nor bears currently hold a clear advantage.

Pelinay believes this shows that XRP has moved away from the heavy selling pressure seen earlier and has entered a more neutral stage.

Funding Rate Confirms the Neutral View

The second pointer from the derivatives market is the funding rate, which remains close to zero. This confirms the neutral outlook because it shows traders have not heavily favored either long or short positions.
XRP Derivatives Data CryptoQuant
XRP Derivatives Data | CryptoQuant

For the third sign, the analyst added that the similar liquidation figures also show that leveraged long and short positions remain fairly balanced. 

Because of this, price swings continue to trigger liquidations on both sides instead of affecting only one group of traders. This shows limited confidence in either direction and frequent short-term reversals.

The fourth sign is that a major squeeze on either side is not likely. Notably, the funding rate near zero shows that traders are not showing excessive optimism or strong bearish sentiment. Combined with the liquidation data, it suggests investors have not yet settled on a clear direction for XRP despite the ongoing weakness.

XRP Continues to Hold a Key Support Zone

While derivatives data shows a neutral market, XRP’s price continues to face pressure on the charts. As of July 20, XRP trades at $1.08, which places it near the lower end of an important short-term support area.

Bulls now need to protect the $1.08 to $1.10 range to keep hopes of a recovery alive. The daily chart still shows a downtrend that has remained in place since July 2025. 

Currently, XRP trades more than 70% below its cycle high of $3.6, reached in the summer of 2025. On June 26, the token fell to about $1.008, marking a 19-month low and its strongest test of the important $1.00 level since November 2024.

Price Levels to Watch

The moving averages also show the bearish outlook across multiple timeframes. The 50-day simple moving average (SMA) sits at $1.12, the 100-day SMA stands at $1.25, and the 200-day SMA is at $1.42. All three levels now act as resistance that XRP must overcome before a stronger recovery can begin.

On the downside, buyers have continued to defend the $1.00 to $1.06 support zone, helping absorb recent selling pressure.

However, a daily close below $1.00 could send XRP toward $0.80. Before reaching that level, the $0.90 to $0.93 area also stands out as an important support zone. A break below that range would weaken the current recovery outlook.

If buyers manage to push the price higher, XRP must first reclaim $1.13, which has now changed from support to resistance. Above that, the next major hurdle lies between $1.15 and $1.20, where the 50-day EMA meets an important Fibonacci resistance level.

XRP Validator Opposes Lower Reserve Requirements for Account Activation

XRP Ledger validator Hussein Zangana, aka Vet, has pushed back against calls to reduce XRPL reserve requirements. 

He argued that network security should come before making account creation cheaper. Zangana said he would not support lower reserves unless it can be proven that the network would maintain the same protection against spam and denial-of-service attacks.

Validator Says Reserves Are Key to XRPL Security

In a post on X, Vet explained that XRPL reserves were created to protect the network’s storage and memory resources from spam and distributed denial-of-service (DDoS) attacks.

He noted that, in 2012, creating an account originally required a 1,000 XRP reserve. The requirement was later reduced to 200 XRP in early 2013. Since then, validators have gradually lowered reserves through validator votes rather than protocol changes.

Today, opening an XRP Ledger account requires a 1 XRP base reserve. Users holding assets such as RLUSD, USDC, or up to 32 NFTs must also pay an additional 0.2 XRP owner reserve for each object.

Vet said he previously supported lower reserves because XRP’s price had risen over time, while server hardware had become much more powerful than it was a decade ago.

However, he argued that storage and memory are still valuable resources. He added that growing AI workloads are increasing infrastructure costs.

Image

Lower Reserves May Not Drive Adoption, Validator Argues

Vet also questioned whether reducing reserve requirements would significantly improve XRPL adoption.

He said users need to hold some amount of native cryptocurrency to use almost every blockchain. Because of this, he believes a 1 XRP reserve is unlikely to be a major barrier for new users.

Instead, Vet said the XRPL ecosystem should focus on attracting developers, building useful products, and delivering secure protocol upgrades that support long-term growth.

Sponsored Fees Upgrade Expected Soon

Vet’s comments come ahead of the expected rollout of XLS-68, a proposed feature that would introduce sponsored fees and reserves. He said the upgrade could arrive in about two weeks.

While the feature may improve the user experience, Vet argued that it would not solve what he believes many supporters of lower reserves are actually seeking: network subsidies for businesses.

He also rejected proposals to increase transaction fees to compensate for lower reserve requirements. Vet said he would only change his position if reduced reserves could provide the same level of network protection as the current system.

Cardano Activates Van Rossem Hard Fork as Protocol Version 11 Goes Live

0

Cardano has successfully activated the V11 (van Rossem) hard fork on its mainnet, marking one of the blockchain’s most significant network upgrades to date.

The upgrade went live on July 18, 2026, officially transitioning Cardano from Protocol Version 10 to Protocol Version 11. Intersect, the member-based organization that supports Cardano’s development and governance, confirmed the successful activation after months of ecosystem-wide preparation and coordination.

Meanwhile, on-chain data from Cardanoscan shows that the upgrade took effect as the network moved from epoch 643, which ran Protocol Version 10, to epoch 644, where Protocol Version 11 became active. 

Cardano Van Rossem Hard Fork Goes Live

Intersect Highlights Ecosystem-Wide Collaboration

Following the successful deployment, Intersect praised the efforts of the Hard Forking Working Group, which coordinated the upgrade across the Cardano ecosystem.

According to the organization, the group worked closely with stake pool operators (SPOs), decentralized application (DApp) teams, developers, exchanges, and other ecosystem partners across multiple test and production networks. This extensive collaboration ensured the hard fork was activated safely and seamlessly without disrupting network operations.

Furthermore, Intersect emphasized that the successful transition reflects months of planning, testing, and coordination among technical teams and ecosystem participants.

Notable Features of V11 Upgrade 

Beyond its governance milestone, the van Rossem hard fork delivers several important technical improvements.

Most notably, Protocol Version 11 is expected to reduce the execution costs of smart contracts, making decentralized applications more efficient while lowering operational expenses for developers building on Cardano.

As a result, developers can deploy and run smart contracts more cost-effectively, potentially improving the overall user experience across the Cardano ecosystem. In addition to immediate performance improvements, the V11 hard fork introduces foundational infrastructure for Cardano’s next major scalability upgrade—Ouroboros Leios.

For context, Leios is designed to dramatically increase Cardano’s transaction throughput while preserving the network’s core principles of security and decentralization. By activating Protocol Version 11, Cardano now has the technical framework required to integrate future Leios enhancements as development advances.

Leios Testnet Already Live Ahead of Mainnet Rollout

The activation of V11 comes shortly after Cardano launched the Leios testnet last month.

Cardano founder Charles Hoskinson previously revealed that the protocol is expected to reach the mainnet before the end of the year.

Unlike traditional blockchain architectures that rely on a single slot leader to collect, order, and process transactions sequentially, Ouroboros Leios separates transaction propagation from block sequencing. It achieves this by introducing parallel transaction processing alongside multiple specialized block types.

This architectural redesign aims to solve the blockchain trilemma by significantly improving scalability without sacrificing security or decentralization. Once fully implemented, Leios is expected to substantially increase Cardano’s transaction capacity while maintaining the network’s robust security guarantees and decentralized consensus model. 

Daily XRP Payments Crash 80% from May Highs of 1.69M

0

The number of daily payments on the XRP Ledger (XRPL) has now crashed 80% from the May 2026 highs of over 1.69 million.

This comes amid the ongoing market-wide downtrend that has dealt a blow to investor sentiment. Notably, since hitting the $3.6 peak in July 2025, XRP has collapsed more than 70%, currently trading for $1.08. As a result, bearish sentiments recently hit extreme levels.

XRP Payment Volume Slumps 80%

Data from XRP Scan, a leading XRPL explorer, confirms that these bearish sentiments have now begun impacting on-chain activity. 

Specifically, the number of payments from one account to another on the XRP Ledger dropped to a low of 325,888 on Saturday, July 18. This represents the lowest reading recorded on the network since the crash to 28,760 on Oct. 2, 2025, which occurred as a result of an unprecedented event.

XRP Ledger Payment Crash

After that October 2025 crash, the number of XRPL payments remained above 500,000 every day until late June, when they dropped to around 400,000. Now, this figure has reduced further to a 9-month low of 325,888, indicating that payment activity has continued to decline.

Following the drop to 325,888 on Saturday, payment volume recovered slightly to 327,497 the next day, but this marked a drop below the 400,000 mark. 

Importantly, the 325,888 figure represents an 80.7% crash from the recent highs of around 1.694 million daily payments recorded on May 28, 2026. Moreover, it also marks an 85% decline from the yearly peak of 2.188 million payments from February 2026.

The May 2026 High
The May 2026 High

Slowdown in Overall XRP On-chain Activity 

Meanwhile, further data confirms an overall slowdown in XRPL on-chain activity besides the crash in the number of daily payments, as prices continue to hit lows around the $1 psychological mark.

For instance, the number of active users on the XRPL, when considering source tags and destination tags, dropped to a low of 123,986 on Sunday, coinciding with the crash in payment volume.

In addition, the number of transactions executed on the network also slumped to 1.129 million that day. This represented a 78% crash from the yearly peak of 5.172 million transactions executed on April 6, 2026.

XRP Seeing Bearish Price Action

As earlier mentioned, this overall slowdown in network activity has been largely due to the broader market downturn that has led to increased selling pressure surrounding XRP.

After recovering to $2.41 on Jan. 6, 2026, XRP witnessed one of its steepest declines over the next few weeks, crashing to a low of $1.11 in early February before rebounding above $1.40. The asset maintained this level until early June, when it lost the support area from $1.1 to $1.4. 

Now, XRP changes hands below $1.1, down nearly 41% this year despite seeing a 4.85% gain in July 2026 so far. XRP must hold above the $1 level to hedge against any steeper declines from here, which could push prices down to the $0.7 to $0.8 range.

Bitcoin Spot Demand Slides Toward -170K BTC: Is a Massive Bitcoin Dip Ahead?

Bitcoin spot demand has weakened sharply even as its price has remained relatively stable in recent weeks. 

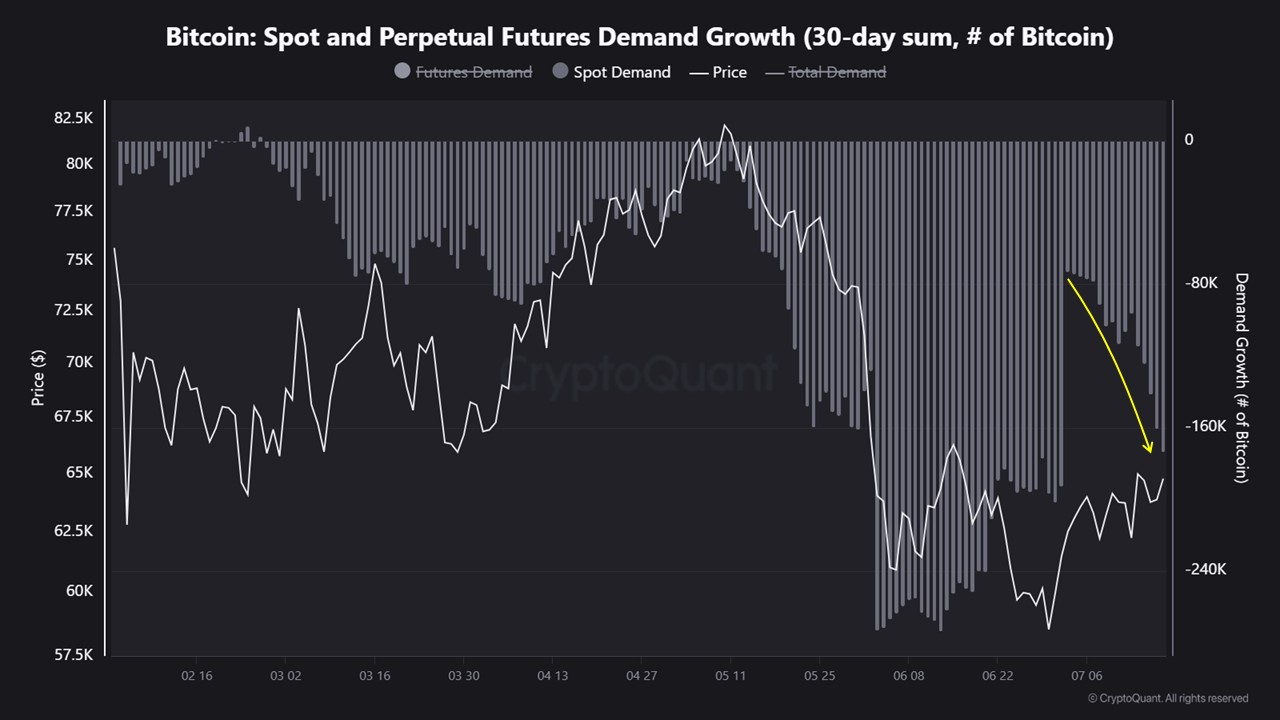
According to CryptoQuant, this divergence could leave the market vulnerable if selling pressure returns. CryptoQuant contributor ScenarioX noted that Bitcoin’s 30-day Spot Demand recovered to around -80,000 BTC in early July. 

However, it later fell back to nearly -170,000 BTC, signaling a renewed slowdown in spot buying activity.

BTC Spot Demand Weakens as Price Holds Steady

According to the analyst, Bitcoin’s recent resilience has not been driven by stronger spot demand. Instead, price stability has largely been supported by easing short-term selling pressure and short covering in the derivatives market.

ScenarioX argued that derivatives activity has helped prevent a deeper decline. However, futures-driven demand alone is not enough to sustain a long-term bullish trend.

As a result, Bitcoin remains in a “structurally fragile” state, the analyst said. Without meaningful spot buying, the market could face a sharp downside move if spot investors begin selling again.

Recovery Could Face Liquidation Risk

Meanwhile, ScenarioX said the momentum in derivatives could continue supporting a short-term rebound as long as spot selling remains limited.

However, the analyst warned that rallies driven mainly by leveraged positions are often unstable. Without stronger spot demand, the current recovery may culminate in a large long liquidation, forcing bullish traders to close positions as prices fall.

The report highlights a growing gap between Bitcoin’s stable price action and weakening underlying demand. It suggests the market may be less resilient than it appears.

Bitcoin Continues Sideways Movement

According to CoinMarketCap data, Bitcoin was trading at $63,941 at the time of writing. The cryptocurrency was down 1.2% over the past 24 hours but remained up 1.91% over the previous seven days.

Bitcoin has gained just 0.41% over the past month, reflecting an extended period of sideways trading. It remains down 27% year-to-date.

ETF Flows Paint a Mixed Picture

Analytics platform Santiment recently noted that U.S. spot Bitcoin ETFs recorded $264.4 million in net inflows over the past two weeks as Bitcoin reclaimed the $64,000 level. This ended a prolonged period of outflows in May and June. 

Fidelity’s FBTC led the early July rebound with roughly $166 million in inflows, while ARKB attracted about $91.8 million. BlackRock’s IBIT also returned to positive territory, contributing $138.9 million during a session that saw $181.1 million of total Bitcoin ETF inflows.

Image

Santiment attributed the renewed interest to softer U.S. inflation data, improving expectations for Federal Reserve policy, and optimism around crypto regulation.

However, CryptoQuant contributor IT Tech argued that the recent recovery should be viewed in the context of the broader trend. 

While spot Bitcoin ETFs accumulated more than 500,000 BTC in net inflows during 2024 and around 250,000 BTC at their 2025 peak, the analyst noted that 2026 has so far recorded roughly 120,000 BTC in cumulative net outflows. 

Graph showing net cumulative Bitcoin inflows to US Spot ETFs from 2024 to 2026, with data indicating significant growth in 2024.

According to the analyst, if ETF demand was a major driver of Bitcoin’s previous rally, the persistent net outflows this year remain a headwind unless other sources of capital replace that demand.

Shiba Inu Burn Rate Jumps 131% as 13.2 Million SHIB Are Destroyed in One Day

0

Shiba Inu’s burn rate surged over the past 24 hours after community members permanently removed more than 13 million SHIB tokens from circulation.

According to Shibburn data, a total of 13.2 million Shiba Inu were burned in the past day, permanently reducing the token’s circulating supply. The burns were completed across 13 separate transactions, with the largest single burn accounting for the majority of the destroyed tokens.

The biggest transaction occurred yesterday when an unidentified user transferred 9.7 million SHIB from the CEX.IO exchange to the official dead wallet. Meanwhile, the second-largest burn took place just hours before press time, eliminating approximately 1.2 million SHIB from circulation.

Shiba Inu Burn Activity Accelerates Sharply

The latest burn marks a significant increase compared with activity recorded over the previous week, during which daily burns generally remained below 7 million SHIB.

Following the latest spike in burns, Shibburn data shows that the 24-hour burn rate soared by 131.2%. The recent activity also lifted longer-term burn totals. Weekly burns have now reached 45.44 million SHIB, while the monthly burn count has climbed to 269.9 million SHIB. 

Shiba Inu Burn
Shiba Inu Burn

Since the launch of the Shiba Inu ecosystem, the community has permanently destroyed 410,840,414,408,454 SHIB (410.84 trillion) through 21,216 burn transactions. That figure represents 41.08% of Shiba Inu’s original 1 quadrillion-token supply, leaving about 58.92% of the total supply still in circulation. 

SHIB Price Remains Under Selling Pressure

Despite the sharp increase in token burns, SHIB continues to trade under bearish pressure. At the time of writing, Shiba Inu was down 0.23% over the past 24 hours, trading at $0.000004143. The token has also declined 1.36% over the past seven days and 12.31% over the last month.

Furthermore, SHIB remains 1.13% lower on a month-to-date basis, leaving the token with only 11 days to recover and turn its monthly performance positive. It continues to rank outside the top 30 and currently stands as the 33rd-biggest token globally, with a market cap of $2.43 billion. 

Meanwhile, growing exchange inflows continue to offset the positive impact of the latest burn activity. According to CryptoQuant data, approximately 12.6 billion SHIB flowed into cryptocurrency exchanges over the past 24 hours. 

Consequently, Shiba Inu’s exchange reserve increased to 86.32 trillion SHIB, suggesting that more holders may be positioning their tokens for potential selling, which could continue to weigh on the asset’s near-term price performance. 

XRP Has Now Fallen Below the 20, 50, 100 and 200 EMAs

0

XRP has entered a difficult position after falling below all four of its major exponential moving averages (EMAs) on the daily chart.

At the time of writing, the token trades at $1.0863, below the 20-day, 50-day, 100-day, and 200-day EMAs. This situation has formed what traders commonly call an EMA waterfall, a pattern that shows sellers have gained control across both the short and long term.

When an asset trades below all of its key EMAs, the moving averages no longer serve as support and instead become resistance levels. As things stand, XRP faces several barriers before it can build a stronger recovery, and the current chart continues to favor the bears.

XRP Collapses Below Key EMAs

The bearish structure developed gradually at the start of this year. Notably, the first major breakdown came on Jan. 6, 2026, when XRP fell below its 200-day EMA after dropping under $2.34. The next day, it also lost the 100-day EMA as the price slipped below $2.22.

The shorter-term moving averages held for several more days, but they eventually gave way as well. On Jan. 18, XRP dropped below the 20-day EMA at $2.05 and the 50-day EMA at $2.07, completing the move below all four major EMAs.

The asset recovered above the 20-day and 50-day EMAs weeks later but recently collapsed below them again amid renewed bearish pressure.

Buyers Face Several Resistance Levels

With XRP now trading below every major EMA, each moving average has become a resistance level. The closest obstacle sits at the 20-day EMA, currently at $1.1004. Buyers need to push the price above this level before any meaningful recovery can begin.

Even if XRP moves above the 20-day EMA, more resistance lies ahead. Specifically, the 50-day EMA stands at $1.1487, followed by the 100-day EMA at $1.2446. Higher still, the 200-day EMA sits at $1.4502, making it the biggest barrier on the chart.

XRP EMAs and Descending Triangle

The gap between the current price and the 200-day EMA also shows how much ground XRP needs to recover. From $1.0863, the asset would have to climb about 33.5% to reach that long-term average.

Even then, reaching the 200-day EMA alone would not confirm a trend reversal because buyers would still need to break above it and hold those gains.

For now, the first sign of improving strength would be a sustained daily close above the 20-day EMA. Until that happens, the overall picture continues to point to further downside.

XRP Descending Triangle Breakout

Meanwhile, XRP has broken above a descending triangle that guided its price from the January 2026 peak near $2.50. The upper trendline connects a series of lower highs, while the lower trendline provides horizontal support at the $1 psychological mark.

Notably, the market currently sees mixed technical signals. Specifically, the EMA structure points to continued weakness, but XRP has already broken above the triangle’s upper trendline. 

In the past, XRP attempted to break above the triangle, but the move did not last. In mid-May, the token climbed above $1.43 and briefly moved beyond the upper trendline. However, buyers could not keep the momentum going, allowing the price to fall back inside the pattern.

A second breakout attempt came on July 14, which proved successful. However, by July 15, XRP had already dropped back below both the 20-day and 50-day EMAs.

The Next Move May Depend on These Levels

The most important support now sits along the triangle’s upper trendline, which currently falls at $1.06. If XRP closes below that support on the daily chart, it would confirm a breakdown back into the triangle and could send the price toward the next major support area between $0.75 and $0.80.

On the upside, buyers must first reclaim the 20-day EMA at $1.1004 before they can build any real momentum. Above that, the upper trendline of the triangle and the 50-day EMA at $1.1487 create a strong resistance zone between $1.10 and $1.15.

XRP Falling Channel Resolution Maps Path Toward $3.18

0

XRP has continued to trade within a falling channel since dropping from the $3.6 peak, with the structure now mapping a path above $3.

Notably, for almost a year, the token has formed a pattern of lower highs and lower lows while staying between two downward-sloping parallel trend lines. At the time of the analysis, XRP changes hands at $1.08, with traders pondering whether the correction is close to ending.

Most analysts see a falling channel that appears after a strong rally as a correction, not necessarily the start of a long-term downtrend. 

In XRP’s case, the upper trend line has repeatedly stopped buying pressure, while the lower boundary has continued to attract buyers during sharp declines. Amid this pattern, the price has remained inside the channel, with each swing becoming smaller over time.

Repeated Breakout Attempts Continue to Fall Short

XRP has tested the upper boundary of the channel several times, but none of those attempts has resulted in a lasting breakout. The first major rally reached $3.18 in September 2025 before sellers pushed the price back into the channel. 

Another move followed in October 2025, but ended at $3.10. Each rally after that lost more strength. In early January 2026, XRP climbed only to $2.31 before turning lower. 

The next attempt reached $1.48 in May 2026, while the latest recovery topped out at $1.29 in June 2026. This $1.29 level had served as a major support area between February and June 2026, but it later became resistance after the price fell below it.

XRP Falling Channel
XRP Falling Channel

This series of failed breakouts points to weakening buying momentum. Every recovery has ended below the previous one, showing that sellers have continued to gain control throughout the correction.

Lower Support Levels Reflect a Gradual Loss of Strength

Buyers have also stepped in several times to defend the lower edge of the channel. XRP first found support at $2.72 in August 2025 before bouncing higher. It later tested $2.19 in October 2025, $1.77 in December 2025, $1.28 in April 2026, and $1.05 in June 2026.

Although buyers managed to lift the price after each decline, every successful defense came at a lower level than the one before it. This suggests that buyers have remained active, but they have not regained enough strength to reverse the broader trend.

As long as this pattern continues, the falling channel remains the dominant structure on the chart. XRP will likely stay under pressure until it breaks above the channel in a convincing way.

Chart Points to One More Dip Before a Move Toward $3.18

The current chart pattern suggests that XRP could make one more move lower before the correction ends. The projected target stands at $0.9223, which matches the lower boundary of the falling channel. 

A drop to that level would mark the deepest point of the correction and represent about a 75% decline from the July 2025 peak of $3.60.

If buyers defend $0.9223, the chart outlines a step-by-step recovery. The first target sits at $1.29, where previous support has turned into resistance. From there, XRP could pull back to $1.11 to confirm that level as new support.

If this support holds, the next move could carry XRP to $1.81, which matches the support area formed in December 2025. The chart then suggests another short pullback to $1.55 before a stronger rally begins. 

From that point, XRP could climb toward $3.18, a level that matches both the failed breakout high from September 2025 and a major resistance zone. Reaching $3.18 would also mark a shift from lower highs and lower lows to higher highs and higher lows, confirming that the long correction has ended.

Ethereum Whales Hold $2.8B Buying Power: So Why Is Selling Pressure Still High?

Ethereum whales remain comfortably in profit, but rising exchange deposits and ample liquidity could keep selling pressure elevated.

CryptoQuant contributor PelinayPA said Ethereum’s Whale Net Unrealized Profit/Loss (NUPL) remains above zero. This means large holders are still sitting on unrealized gains.

However, the metric has not yet reached the extreme levels seen at previous market tops. That suggests whales have not entered the profit zone that typically leads to heavy selling.

“Whales are not yet at the psychological threshold that typically triggers heavy profit-taking,” the analyst said. Although their unrealized profits are gradually shrinking, the current trend does not resemble the conditions seen at past market cycle peaks.

Binance Deposits Keep Selling Pressure Elevated

Despite the lack of peak-profit conditions, Ethereum deposits to Binance remain unusually high. According to CryptoQuant, ETH deposits into Binance have increased sharply since late 2024 and remain elevated.

However, moving ETH to an exchange does not always mean investors plan to sell immediately. Still, it puts more ETH on the market, increasing the risk of selling pressure.

CryptoQuant’s chart shows the Binance User Deposit Address metric standing at 1.12 billion on July 15, remaining close to its highest levels in recent years. This suggests a large amount of ETH remains on the exchange and is available for trading.

Ethereum Whale NUPL chart | CryptoQuant

Stablecoin Reserves Give Ethereum Whales More Buying Power

The report also points to growing stablecoin reserves among large investors. CryptoQuant’s USDT and USDC Whale metric has climbed to 2.7958 billion, indicating that large investors collectively control nearly $2.8 billion in stablecoin liquidity that could be deployed into Ethereum or kept on the sidelines. These holdings give them additional buying power alongside their existing Ethereum positions.

This allows whales to buy more ETH if they see an opportunity. However, they could also shift their capital out of Ethereum if market conditions worsen.

Meanwhile, Ethereum’s Realized Price has climbed to approximately $2,305. This means the average price investors paid for ETH is increasing.

The analyst said this reflects stronger long-term capital inflows than in previous market cycles. It also suggests new investors are still buying Ethereum, even at higher prices.

As The Crypto Basic reported yesterday, large investors, including Bitmine, Abraxas Capital, and unknown whales, accumulated 82,898 ETH over three days. Industry leaders such as Bitmine Chairman Tom Lee have also continued to issue bullish outlooks for ETH, including a 100x price prediction, even amid the bear market.

Whale Capital Flows Could Decide ETH Next Move

PelinayPA concluded that Ethereum whales are holding large amounts of both ETH and stablecoins, giving them ample liquidity on either side of the market.

This means Ethereum’s next major price move could depend on what whales do next. If they use their stablecoin reserves to buy more ETH, prices could rise. If they start selling their ETH for cash, prices could come under pressure.

At the time of writing, Ethereum was trading at $1,846. It was up 1% over the past 24 hours, 2.6% over the past week, and 5.5% over the past month. However, it remained 49% below its price from a year ago.

Cardano: OKX Launches 5 Million Midnight Token Airdrop for European Users

0

OKX crypto exchange has launched a new airdrop campaign for Midnight, Cardano’s partner chain, offering eligible users across Europe a total reward pool of 5 million NIGHT tokens.

The seven-day campaign adopts a Trade-to-Earn model, rewarding users based on both their crypto holdings and trading activity. According to the campaign countdown, participants have five days remaining to register and qualify for the promotion.

Eligible users who complete the registration and satisfy the campaign requirements will automatically receive daily NIGHT token distributions throughout the promotional period.

OKX Combines Asset Holdings With Trading Activity

Unlike traditional cryptocurrency airdrops that primarily reward wallet holders, OKX’s latest X Drops campaign requires participants to maintain eligible crypto assets while actively trading on the platform.

To qualify for the promotion, users must:

  • Hold at least €500 ($571.85) worth of eligible cryptocurrency assets in their OKX account. Nearly all non-stablecoin cryptocurrencies qualify.
  • Trade eligible cryptocurrency pairs during the campaign period.
  • Register for the X Drops campaign before the registration deadline.

Once users meet these conditions, they automatically become eligible to receive daily allocations from the 5 million NIGHT token reward pool without submitting additional claims.

Trade-to-Earn Model Rewards Active Participants

A key feature of the campaign is its Trade-to-Earn mechanism, which determines rewards based on each participant’s trading volume rather than distributing equal amounts to everyone.

OKX calculates each user’s share using a rolling seven-day trading volume. As a result, participants who generate higher qualifying trading volumes receive a larger portion of the daily NIGHT token rewards.

The exchange also offers an additional incentive for trading the Midnight token itself. Specifically, all qualifying NIGHT trades receive a 5x weighting when calculating rewards, allowing active NIGHT traders to increase their share of the daily distribution.

Once calculated, rewards are credited automatically to eligible users’ accounts each day without requiring any manual redemption.

Midnight’s First Airdrop 

The current OKX campaign is not Midnight’s first large-scale token distribution.

The NIGHT token officially debuted through a multi-chain airdrop that rewarded holders across eight blockchain networks, including XRP Ledger, Cardano, Solana, Ethereum, and Bitcoin. Users who held at least $100 worth of the native assets on eligible blockchains qualified to receive NIGHT allocations.

The Midnight Foundation adopted a phased redemption schedule. Allocated tokens unlock gradually over four quarterly periods, with 25% becoming redeemable during each phase.

The third redemption window is currently active and runs from June 8 through September 5, 2026. The final redemption period is scheduled to take place between September 6 and December 4, 2026, allowing eligible recipients to claim the remainder of their allocated NIGHT tokens. 

In the meantime, NIGHT was trading at $0.027, down 11.22% over the past week, and 8.81% over the past month. With a market cap of $459.97 million, NIGHT ranks as the 81st-biggest token on CoinMarketCap.