Home Blog Page 62

XRP Binance Withdrawals Hit Two-Year High, Transaction Imbalance Mirrors Setup Before 66% Rally

XRP withdrawal activity on Binance has climbed to its highest level in at least two years.

According to a new on-chain analysis by CryptoQuant contributor Amr Taha, the exchange is now recording a significantly larger share of withdrawal transactions than of deposits.

Taha said Binance’s share of XRP withdrawal transactions reached 54.5% on July 17, the highest level since July 2024. Meanwhile, deposit transactions fell to 45.4%, the lowest reading since the same period and below the previous low of 46.7% recorded on June 20, 2025.
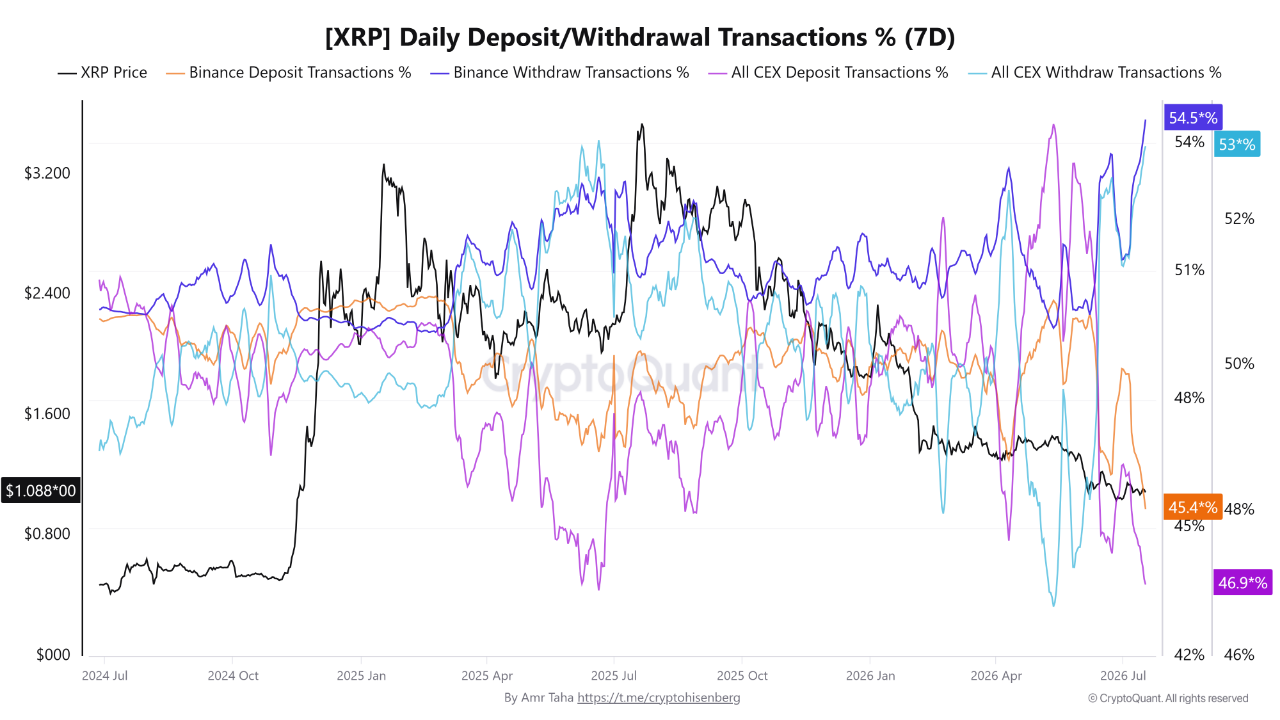
XRP Deposit/Withdrawal chart

The widening gap between withdrawals and deposits has expanded to 9.1 percentage points, up from 6.5 points on June 20, 2025. According to Taha, this makes the current imbalance roughly 40% wider than the previous comparison.

Binance Outpaces Broader Exchange Trend

The broader centralized exchange market is showing a similar pattern, though Binance’s shift is more pronounced.

Across all centralized exchanges, withdrawal transactions accounted for 53.01%, nearly matching the 53.09% recorded on June 20, 2025, while deposit transactions stood at approximately 46.9%.

Binance’s withdrawal share is now 1.49 percentage points higher than the all-exchange average. Its 9.1-point withdrawal-deposit gap is also nearly 49% wider than the roughly 6.1-point gap observed across all centralized exchanges.

The figures suggest Binance users are moving XRP off the exchange at a faster rate than the broader market, although the data reflects the number of transactions rather than the size or value of transferred funds.

Previous Pattern Preceded 66% XRP Rally

Taha pointed to a historical parallel that has drawn attention from market participants.

After similar transaction levels were recorded on June 20, 2025, XRP’s price climbed from approximately $2.11 to $3.50 by July 21, delivering a gain of nearly 66% in about one month.

At the time of the analysis, XRP was trading near $1.09, around 48% below its June 2025 comparison price and nearly 69% below the subsequent $3.50 peak.

However, Taha cautioned against interpreting the data as a direct bullish signal. The metrics track the proportion of deposit and withdrawal transactions, not the volume of XRP being transferred or net exchange flows.

As a result, the shift reflects a change in transaction composition rather than definitive evidence of capital leaving exchanges or a guarantee that price will follow the same trajectory.

Japanese Financial Giant SBI Holdings Inherits 1.1 Trillion Shiba Inu Through Coinhako Acquisition

0

Japanese financial giant SBI Holdings has gained exposure to a substantial Shiba Inu holding following its acquisition of Singapore-based cryptocurrency exchange Coinhako.

The acquisition, carried out through SBI’s subsidiary, SBI Ventures Asset, received final approval from the Monetary Authority of Singapore (MAS), allowing the transaction to close. As a result, Coinhako has become a consolidated subsidiary of SBI Holdings.

Through the acquisition, SBI gains immediate access to Coinhako’s regulated crypto infrastructure, expanding its digital asset ecosystem beyond Japan while strengthening its regional footprint.

SBI Plans Broader Digital Asset Expansion

SBI plans to leverage Coinhako as a gateway to expand its blockchain-based financial services across Southeast Asia. The integration will allow SBI to connect Coinhako’s user base with products such as its yen-backed stablecoin JPYSC and tokenized real-world asset (RWA) offerings.

The acquisition also strengthens SBI’s regulatory position in the region by giving it access to Coinhako’s Singapore-based operations and Major Payment Institution (MPI) license from the Monetary Authority of Singapore. This provides a compliant foundation for expanding digital asset services without building a new infrastructure from the ground up.

SBI Chairman Yoshitaka Kitao said the move aligns with the company’s goal of creating global digital asset corridors that connect Japan and Southeast Asia through faster blockchain-powered payments and cross-border financial services. 

SBI Inherits More Than 1 Trillion SHIB Tokens

Beyond the strategic expansion, the acquisition also gives SBI control over Coinhako’s substantial cryptocurrency treasury. According to blockchain intelligence platform Arkham, Coinhako currently holds $160.87 million worth of digital assets across multiple cryptocurrencies.

Among those assets are 1.11 trillion Shiba Inu tokens, valued at $4.62 million at current market prices. While SHIB represents only a portion of Coinhako’s total holdings, it remains one of the exchange’s largest crypto positions. 

Arkham data shows that Shiba Inu is Coinhako’s sixth-largest cryptocurrency by dollar value. Ethereum, Binance Coin, Chainlink, Tether, and Pepe lead the exchange’s portfolio. 

With Coinhako now operating as an SBI subsidiary, these treasury assets, including the 1.11 trillion SHIB tokens, effectively become part of the broader SBI corporate ecosystem. However, they remain exchange-held assets rather than direct investments by SBI itself. 

Coinhako Crypto Holdings

What the Acquisition Means for Shiba Inu

Meanwhile, the acquisition does not necessarily indicate that SBI has purchased Shiba Inu as an investment. Instead, the company has assumed ownership of an exchange that already custodies significant amounts of SHIB alongside numerous other digital assets.

Nevertheless, the transaction places more than 1 trillion SHIB tokens under the umbrella of one of Japan’s largest financial groups. It is worth noting that SBI’s crypto exchange arm, SBI VC Trade, already supports Shiba Inu trading and has launched several campaigns for users, including staking opportunities and token giveaways.

Bitcoin Sees 2,150% Miner Stress Surge, Long-Term Holders Hit Record 14.85M BTC: Bullish or Bearish?

Bitcoin is showing signs of a major supply-side reset, with BTC miners under mounting financial pressure and veteran investors moving decade-old coins.

Meanwhile, on-chain data suggests the market continues absorbing heavy selling without a major price breakdown. At press time, Bitcoin is trading at $63,964, up 1.78% over the past 24 hours.

BTC Miner Stress Hits Post-Halving Extremes

According to CryptoQuant author CryptoOnchain, Bitcoin is undergoing a “supply-side restructuring” as pressure builds on the network’s key participants.

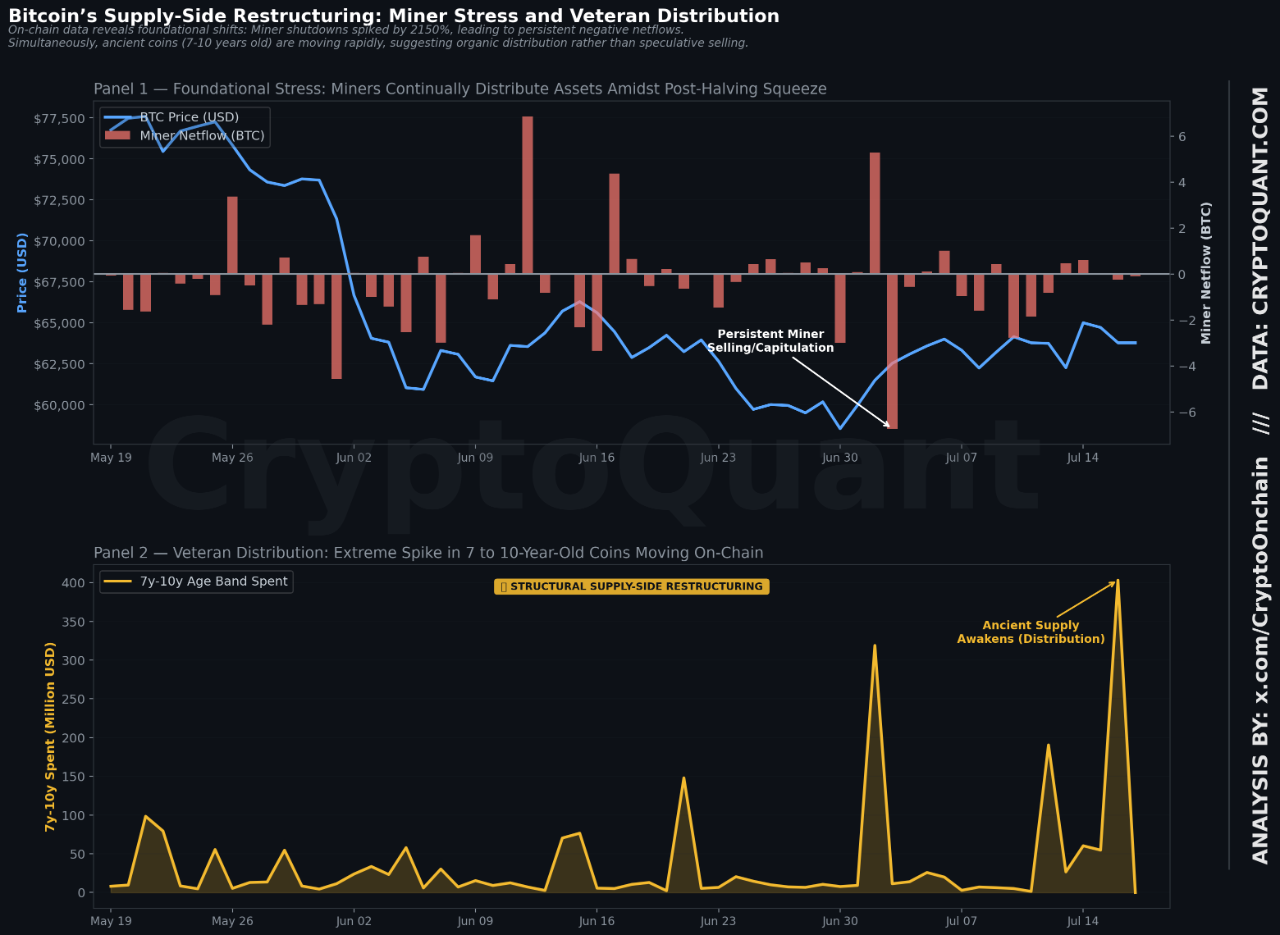
He said miner shutdowns surged 2,150% above the 90-day baseline over the past week. This massive increase implies worsening mining economics following the halving. As profitability declined, miner-to-Binance transfers jumped more than 470%, suggesting miners are selling more Bitcoin to cover operating costs.

The report also noted persistent negative miner netflows. This suggests miners continue to liquidate reserves as less efficient operations shut down.

CryptoOnchain described the trend as a typical post-halving adjustment. Lower block rewards force weaker miners out of the market, while larger and more efficient operators continue.

Bitcoin supply side restructuring chart: CryptoQuant

Veteran Bitcoin Investors Begin Moving Old Coins

Meanwhile, the supply shift is not limited to miners.

CryptoOnchain reported that the movement of Bitcoin held for seven to 10 years surged 374%. Coin Days Destroyed (CDD) also rose sharply, indicating long-term holders from previous market cycles have started moving dormant coins.

However, the analyst said this does not necessarily point to panic selling. Instead, it shows “organic distribution,” as veteran investors use Bitcoin’s prolonged $62,000 to $64,000 trading range to secure liquidity amid macroeconomic uncertainty.

Even with miners selling and long-term holders distributing coins—two forces that have historically pressured prices—Bitcoin has remained relatively stable. That suggests steady demand is absorbing the additional supply.

According to CryptoOnchain, similar conditions have historically appeared during the final stages of post-halving consolidations before the next market expansion.

Loss-making Supply Overtakes Profitable Supply

The broader on-chain picture supports that view.

Recent Glassnode data shows that Bitcoin’s supply held at a loss has exceeded supply held in profit for the first time in the current market cycle.

At the same time, long-term holders now own a record 14.85 million BTC, showing they continue to accumulate despite about 10.8 million BTC still being underwater.

BTC Supply in Profit

In the past, similar periods—such as after the FTX collapse in 2022—have happened near major market bottoms. Those phases were followed by months of price stability before the market recovered.

Together, these trends suggest Bitcoin is going through a shift in ownership rather than a panic sell-off. While some miners and investors are selling, long-term buyers continue to absorb that supply, even as the price remains stuck in a range.

Big Whales Accumulate 81,898 Ethereum in Three Days as Tom Lee Says ETH Could ‘Easily’ Rise 100x

Large cryptocurrency investors have continued buying Ethereum over the past three days. 

They withdrew nearly 82,000 ETH, worth more than $154 million, from major exchanges this week.

At the same time, Fundstrat Chairman Tom Lee shared a long-term bullish outlook for Ethereum. He said the cryptocurrency could ‘easily’ rise 100-fold.

Whales Withdraw Nearly 82,000 ETH From Exchanges

According to blockchain analytics platform Lookonchain, several whale wallets accumulated Ethereum between July 15 and July 17.

On July 17, two newly created wallets withdrew 20,000 ETH worth about $37.72 million from Coinbase Prime. During the same period, investment firm Abraxas Capital withdrew another 8,452 ETH worth roughly $16 million from Binance and Bybit.

Image

The activity followed a strong buying day on July 16. Three newly created wallets withdrew 30,000 ETH worth $57.66 million from Coinbase Prime. Crypto entrepreneur Arthur Hayes also bought 1,293 ETH, valued at around $2.48 million.

On July 15, Abraxas Capital withdrew another 8,153 ETH worth $15.3 million from Binance and Bybit. At the same time, the firm deposited 618 BTC worth nearly $40 million into Kraken. The move suggested a possible shift from Bitcoin into Ethereum.

Overall, the disclosed purchases totaled 81,898 ETH over three days.

Bitmine Expands Its Ethereum Treasury Holdings

Institutional buying has also extended to corporate treasuries. Bitmine, chaired by Tom Lee, purchased another 6,000 ETH worth approximately $11.18 million from FalconX on July 15.

The purchase adds to Bitmine’s growing Ethereum holdings, now approaching 6 million ETH. The company is aiming to build one of the largest Ethereum treasury positions while also investing in Ethereum ecosystem projects.

Tom Lee Shares Bullish Ethereum Outlook

In Bitmine’s July Chairman’s Message, titled “Ethereum Is the Cure for the Uncanny Valley of Wealth,” Lee compared Ethereum’s current stage to the early days of the internet.

He argued that many investors still underestimate crypto’s role in an AI-driven economy.

According to Lee, Ethereum could become the settlement layer for future financial systems. He believes crypto infrastructure will play a key role in supporting digital wealth and AI-powered commerce.

Lee referenced projections from Ethereum co-founder Joe Lubin and research from Etherealize that suggest Ethereum could eventually reach $250,000 per ETH. That would represent a gain of roughly 100 times from current levels.

Bitmine Chairman's Message
Bitmine Chairman’s Message

However, Lee said he was not endorsing that exact price target. Instead, he argued that Ethereum still has “radical upside.”

He compared Ethereum’s potential growth to companies such as Amazon, Nvidia, and JPMorgan during their early expansion phases.

Lee also highlighted the connection between Bitmine’s stock performance and Ethereum’s price. He said the company’s shares have shown a reported 90% correlation with ETH.

If Ethereum reaches the higher valuations predicted by some long-term bulls, Lee believes Bitmine shareholders could also benefit significantly.

Lee ended by quoting investor Charlie Munger: “The big money is not in the buying and selling, but in the waiting.”

The quote reflects Bitmine’s long-term confidence in Ethereum’s future as the firm has accumulated 5.74 million ETH tokens over the past year.

Shiba Inu Faces Renewed Selling Pressure Despite New Visibility Boost in Japan

0

Shiba Inu has come under renewed selling pressure after billions of SHIB tokens moved to cryptocurrency exchanges over the past 24 hours. 

According to data from CryptoQuant, investors transferred 352.53 billion Shiba Inu to exchanges during the period, while only 317.44 billion SHIB left trading platforms. As a result, SHIB recorded a positive exchange netflow of 35.08 billion tokens.  

Exchange netflow measures the difference between tokens entering and leaving cryptocurrency exchanges. A positive reading indicates that more assets are flowing into exchanges than out, a trend that often points to increasing selling pressure because traders typically deposit tokens before selling them.

Although exchange inflows do not automatically lead to immediate selling, sustained positive netflows often suggest that investors are positioning themselves to trade or liquidate their holdings.

SHIB Exchange Reserves Continue to Increase

Meanwhile, SHIB’s exchange reserves also edged higher. Following the latest transfers, the total amount of SHIB held across exchanges climbed to 86.497 trillion tokens, representing a 0.04% increase over the previous 24 hours.

Growing exchange reserves generally indicate that more tokens are readily available for trading. Consequently, if investors decide to sell, the additional supply could weigh further on SHIB’s price. The latest on-chain data, therefore, adds to concerns about the meme coin’s short-term outlook as it continues to struggle amid broader market weakness. 

SHIB Exchange Flows
SHIB Exchange Flows

Recent Inflows Reverse Earlier Bullish Trend

The latest exchange activity marks a clear reversal from the bullish trend observed only days ago. Earlier reports showed that investors withdrew more than 1.4 trillion SHIB from centralized exchanges in 10 days. 

Large exchange outflows are typically viewed as bullish because they suggest holders are moving assets into private wallets for long-term storage instead of preparing to sell.

However, the latest positive netflow indicates that market sentiment may have shifted, with more SHIB now returning to exchanges.

SHIB Extends Decline in Crypto Rankings

The bearish on-chain metrics have also coincided with Shiba Inu’s continued decline among the largest cryptocurrencies by market capitalization. After recently falling out of the top 30, SHIB has now slipped to 33rd place. At $0.000004091, SHIB carries a market cap of $2.41 billion. 

Currently, Shiba Inu is down 3.2% over the past 24 hours, 5.65% over the last seven days, and 16.81% over the past month. The decline comes as SHIB misses a potential institutional exposure boost after T. Rowe Price’s Active Crypto ETF launched without including the meme coin among its selected assets. 

Japan Gives Shiba Inu a Major Visibility Boost

Despite the bearish on-chain signals, Shiba Inu recently received a significant boost in Japan through one of the country’s largest fintech companies.

Japanese cryptocurrency platform Rakuten Wallet introduced the first physical Shiba Inu commemorative coin as part of its “Real Coin” collectible series. Unlike previous Bitcoin, Ethereum, and XRP editions, the SHIB version features a premium sandblasted matte finish that reportedly earned unanimous approval during internal testing.

Although the commemorative coin does not include blockchain functionality, Rakuten Wallet plans to display it at live events and promotional campaigns throughout its retail ecosystem, which reaches roughly 44 million users. 

Trader Nets $535K Shorting CASHCAT in 2 Days: Is the Meme Coin Hype Over After 72% Crash?

The abrupt reversal in CASHCAT has created both winners and losers across the market.

One trader is sitting on more than $529,000 in unrealized gains from a short position. Meanwhile, others have suffered six-figure losses as the Robinhood Chain meme coin fell more than 70% from its recent high.

Notably, trader 0xc36a opened a short position on CASHCAT two days ago and has since accumulated $535,510 in unrealized profit as the token continued its steep decline.

Trader 0xc36a account. Source: https://hypurrscan.io/address/0xc36af149b64a41aab6c26ea6b71c37082d9e105b#perps
Trader 0xc36a account. Source: https://hypurrscan.io/

Long Traders Suffer Heavy Losses

While short sellers benefited from the selloff, bullish traders were caught on the wrong side of the move.

According to Lookonchain, trader 0x5fe6 spent 405 ETH, worth about $750,000, to buy 5.04 million CASHCAT tokens. After the sharp correction, the position is now worth only around $290,000. That leaves the trader with an unrealized loss of approximately $460,000, or 61%.

Another investor exited the token after holding it for just one day. On July 15, the trader sold all 6.12 million CASHCAT tokens for 383.6 ETH, worth about $735,000. The sale locked in a realized loss of 135 ETH, or roughly $259,000, as the meme coin continued to fall.

CASHCAT Market Cap Falls Over 70% in Three Days

Market data shows CASHCAT’s market capitalization dropped from roughly $230 million to around $65 million–$70 million within three days. The move represents a decline of more than 70%.

The attached DexScreener chart shows CASHCAT trading near a $70 million market cap. The token is down approximately 72% from its recent peak, highlighting the speed of the correction.

CASHCAT price crashed 72%

The sharp decline prompted crypto influencer Ronald Carter to question how a meme coin of CASHCAT’s size could lose so much value in such a short period.

“How is it possible that a large memecoin like CASHCAT drops from $230m to $65m in 72 hours,” Carter wrote on X.

He added that the move raised questions about whether whales, retail traders, and spot holders all decided to sell at the same time.

CASHCAT’s Million-Dollar Gains

The latest drop comes only days after CASHCAT generated some of the biggest meme coin profits of the year.

Earlier, TheCryptoBasic highlighted a trader who turned 0.49 ETH, worth about $838, into 580 ETH, worth approximately $1.04 million. The trade delivered a return of 1,183x.

Another wallet that turned just $86 into $1.6 million. Meanwhile, a separate trader missed out on an estimated $3.5 million after selling a CASHCAT position too early.

The latest selloff highlights the extreme volatility of newly launched meme coins. As the tokens deliver life-changing gains, those gains quickly disappear as early investors take profits and market sentiment shifts.

XRP Estimated Leverage Ratio Seeing Same Pattern That Preceded the Late-2024 Surge

0

XRP is showing deleveraging signs that resemble the conditions before its sharp rally in late 2024. 

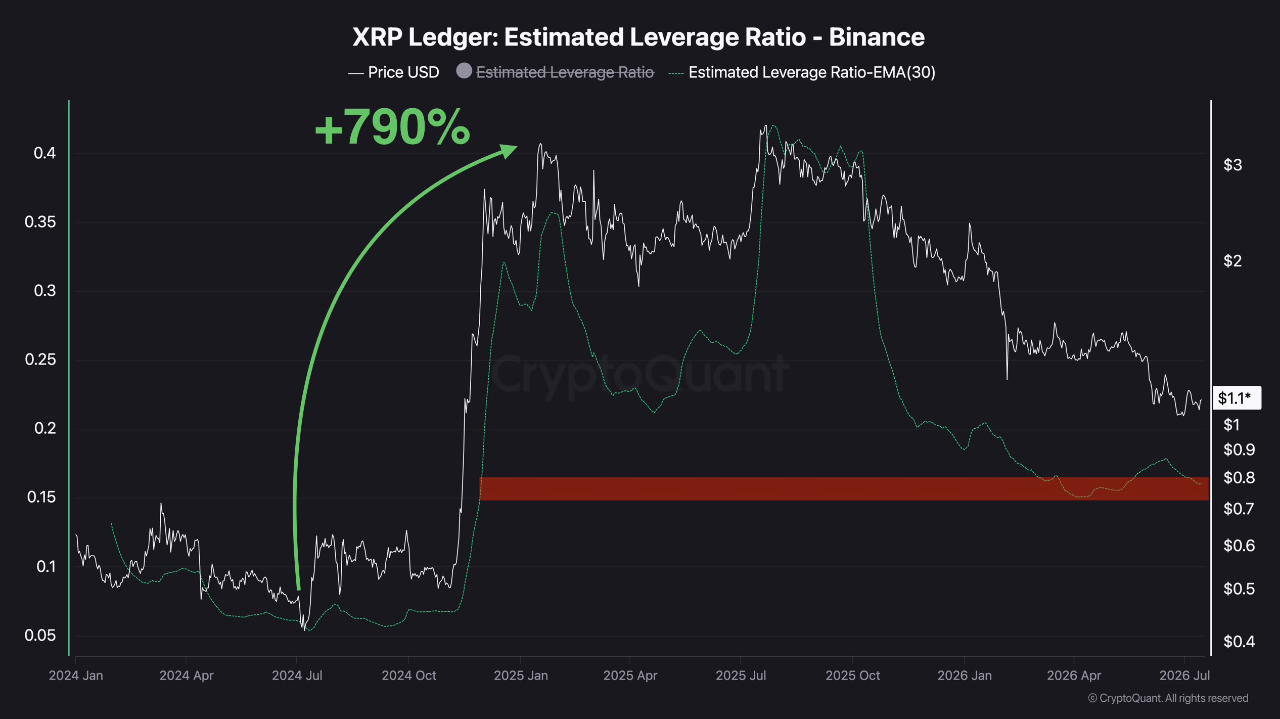
Recent market data shows a decline in speculative trading, with Binance’s estimated leverage ratio (ELR) dropping to 0.16, one of its lowest readings since November 2024.

For the uninitiated, the estimated leverage rating metric compares open interest with exchange reserves to show how much leverage traders are using.

The current figure is also close to the April 2026 low of 0.15, which appeared during XRP’s earlier correction. Meanwhile, amid these conditions, XRP has dropped about 70% from its 2025 high of $3.6 and now trades around $1.10.


What Lower Leverage Means for XRP

The decline in the ELR mainly indicates a drop in leveraged futures positions, not necessarily changes in spot holdings. 

As the market corrected, many leveraged trades were closed, causing open interest to fall. Binance’s XRP open interest now stands at about $375 million, below the highs seen over the past year.

This sort of deleveraging often leaves the market in a healthier position. Notably, high leverage increases the risk of forced liquidations, where one liquidation triggers another and causes sharp price swings. 

However, when leverage falls, that risk becomes smaller. As a result, the market tends to become more stable, giving future price moves a stronger foundation. Current derivatives data suggests speculative trading has cooled, leaving the market far less overheated than it was before.

The Current Situation Looks Similar to 2024

The present market structure shares several similarities with the period before XRP’s late-2024 rally. During the middle of 2024, XRP traded near $0.40 while the estimated leverage ratio gradually dropped to around 0.05, the lowest point of that cycle. 

While the price moved within a narrow range for months, the derivatives market quietly reset before buying momentum returned.

XRP Estimated Leverage Ratio CryptoQuant
XRP Estimated Leverage Ratio | CryptoQuant

This reset eventually led to a rally of more than 790%, lifting XRP above $3.6 as leverage gradually increased alongside the price.

If XRP were to repeat the same percentage gain from its current price of about $1.10, it would reach roughly $9.80. However, this figure only represents a mathematical comparison with the previous rally and should not be viewed as a price prediction.

Institutional forecasts remain much more cautious. Standard Chartered recently lowered its year-end 2026 XRP target from $8 to $2.8, but the bank maintained its 2030 target at $28.

XRP Sees Bullish Whale Activity

On-chain activity also points to growing confidence among large investors. Whale wallets holding between 100 million and 1 billion XRP added about 1.3 billion XRP within a 48-hour period in early March 2026.

Large amounts of XRP also continued leaving exchanges. On March 10, investors moved roughly $738 million worth of XRP into cold wallets in a single day, making it one of the largest exchange outflows of the year. 

Whale buying remained strong through April, when the biggest holders purchased more than 11 million XRP each day, marking the fastest pace of accumulation in around 10 months.

The trend continued into July. Transfers of more than 1 million XRP on Coinbase increased from about 10% of all withdrawals on June 16 to 25.7% by July 1. Data also shows that more than 90% of XRP leaving exchanges now goes into private wallets controlled by large holders instead of returning to trading platforms.

XRP Elliott Wave Pattern Has Now Entered Its Fifth Iteration: Here Are Short-Term Targets

0

XRP has entered the fifth and final stage of a multi-wave Elliott Wave pattern that started in late June, currently pointing to several short-term price targets. 

Specifically, the pattern places the first target at $1.23062, while a stronger rally could push the price as high as $1.40.

At the time of writing, XRP is trading at $1.09810, up 0.05% on the day. Meanwhile, the 14-period Relative Strength Index (RSI) stands at 47.98, showing neutral momentum and suggesting the market still has room to move either higher or lower.

This Elliott Wave structure has formed on the 4-hour timeframe since XRP reached a low of $1.012 on June 26. Since then, the market has completed the first four waves of the pattern and has now moved into the middle of the fifth and final wave.

XRP Elliott Waves One to Three

The current pattern began on June 26, when XRP dropped to $1.012 before quickly rebounding higher. The first wave lifted the price from that low to $1.07 by June 27.

Then, the second wave unfolded as an ABC correction across June 29 and June 30. During this phase, sub-wave A pulled XRP from $1.07 down to $1.03 by June 29. 

Sub-wave B followed with a rebound to $1.076 later that same day. Finally, sub-wave C completed the correction by pushing the price back to $1.02 on June 30, marking the end of the larger wave two.

From here, wave three started at the $1.02 low and produced the strongest rally in the entire sequence. Specifically, XRP climbed to $1.18 by July 4, gaining $0.16, or about 15.7%, from the bottom of the wave to its peak.

XRP 4h Elliott Wave
XRP 4h Elliott Wave

This $1.18 level remains the highest point reached during the current Elliott Wave structure and now acts as the level that the fifth wave needs to move above to reach its projected targets.

Wave Four Leads to an XRP Correction

After reaching $1.18, XRP entered wave four, which represented the most detailed correction in the entire pattern. This phase completed both a standard ABC correction and an internal five-sub-wave structure at the same time.

Within the ABC pattern, sub-wave A pulled the price from $1.18 down to $1.12. Sub-wave B then lifted XRP back to $1.16, while sub-wave C finished the correction by bringing the price down to $1.06 on July 13.

At the same time, the internal five-wave structure within wave four also ended at $1.06 on July 13, with the fifth internal sub-wave marking the end of the correction. 

Short-Term XRP Price Targets

Wave five began from the $1.06 low and now forms in five sub-waves. The first sub-wave lifted XRP from $1.06 to $1.13 by July 15 before the market entered the current second sub-wave correction. The pullback has taken the price back to around $1.09 at press time, a decline of about $0.04 from the $1.13 high.

The $1.09 area has now become an important support zone because it closely matches the horizontal reference level at $1.09957. 

As long as XRP holds above this area, the current fifth-wave structure remains valid. However, if the price falls below the wave four low of $1.06, the bullish Elliott Wave count would no longer apply, and a more bearish outlook would become the leading scenario.

If the correction around $1.09 ends as expected, the next move could take XRP to $1.17 during sub-wave three. That could be followed by a pullback to $1.14 in sub-wave four before the final fifth sub-wave targets the 1.0 Fibonacci extension at $1.23062.

If buying momentum continues after that, the next upside target sits at the 1.618 Fibonacci extension of $1.33924. Under the strongest bullish scenario, the current fifth-wave structure could extend to $1.40. 

While the bullish Elliott Wave count remains the main outlook, the same price action also supports a valid bearish interpretation without breaking any of Elliott Wave theory’s main rules. Under that view, the current structure could still lead to another move lower instead of continuing higher.

Shiba Inu Misses Historic Chance as T. Rowe Price Launches Active Crypto ETF Without SHIB

0

Shiba Inu has missed out on what could have been its first appearance in a U.S.-listed spot crypto exchange-traded fund (ETF). 

This comes after T. Rowe Price launched its long-awaited Active Crypto ETF without including the meme coin among the supported assets. For months, the Shiba Inu community anticipated SHIB’s inclusion in the fund. 

During the ETF’s initial filing in October 2025, the $1.89 trillion asset manager revealed plans to hold between five and 15 digital assets. At the time, SHIB appeared on the list of cryptocurrencies that met the fund’s eligibility standards, fueling optimism that it would become one of the first meme coins to gain exposure through a U.S.-listed spot crypto ETF.

However, that expectation did not materialize when the fund officially launched.

T. Rowe Price Debuts TKNZ on NYSE Arca

Following approval from the U.S. SEC, T. Rowe Price launched the Active Crypto ETF yesterday under the ticker TKNZ on NYSE Arca.

The actively managed fund debuted with $15 million in assets under management (AUM) and carries an expense ratio of 0.75%. Rather than including SHIB, the ETF launched with exposure to the following digital assets:

  • Bitcoin (BTC) – 40.75%
  • Ethereum (ETH) – 18.42%
  • Binance Coin (BNB) – 11.01%
  • Solana (SOL) – 9.44%
  • XRP (XRP)  – 9.37%
  • Hyperliquid (HYPE) – 6.45%
  • Stellar (XLM) – 3.00%
  • Dogecoin (DOGE) – 1.28%
  • USD Coin (USDC) – 0.16%
  • Cash equivalents – 0.11%

While Dogecoin secured a place in the portfolio, Shiba Inu was absent despite previously being identified as an eligible asset. 

Image

Why Was Shiba Inu Excluded?

T. Rowe Price did not provide an official explanation for SHIB’s exclusion. Nevertheless, several developments since the ETF’s initial filing may have influenced the final portfolio selection.

When the filing was submitted in October 2025, Shiba Inu ranked among the top 20 cryptocurrencies by market cap. Since then, the token has experienced a significant decline in market value and has slipped out of the top 30.

At press time, SHIB ranks as the 33rd-largest cryptocurrency, with a market cap of $2.43 billion and a trading price of $0.000004132.

Beyond its declining market position, the project’s public presence has also weakened. Several prominent members of the Shiba Inu ecosystem have become less active on social media. Meanwhile, the Shibtoken X account—once widely viewed as the project’s primary social media presence—has increasingly promoted other meme coin projects, raising concerns among some community members about the ecosystem’s current direction. 

Active Management Leaves the Door Open

Although SHIB was excluded from the ETF’s initial holdings, its chances of joining the fund in the future have not been completely ruled out.

Unlike passive index-tracking ETFs, the T. Rowe Price Active Crypto ETF actively adjusts its portfolio based on changing market conditions and investment opportunities. As a result, the fund manager can modify asset allocations or introduce new cryptocurrencies over time.

If Shiba Inu regains market momentum, improves its ranking, or demonstrates stronger ecosystem growth, it could potentially qualify for inclusion during a future portfolio rebalance.

For now, SHIB also lacks a standalone spot ETF application in the United States. Unlike Bitcoin, Ethereum, XRP, and several other major cryptocurrencies that have attracted ETF proposals, no asset manager has filed for a dedicated Shiba Inu ETF.

Until such a filing emerges, or SHIB is added to an actively managed crypto fund like TKNZ, the timeline for the token’s first U.S. spot ETF exposure remains uncertain. 

XRP Deleveraging Nears 2026 Lows: Can XRP Repeat Its 790% Rally From 2024?

XRP is going through another deleveraging phase on Binance.

According to CryptoQuant author Darkfost, a key derivatives metric has dropped to one of its lowest levels since late 2024. A similar reset in 2024 preceded XRP’s 790% rally.

Binance Leverage Ratio Drops Near Multi-Month Low

Darkfost said Binance’s Estimated Leverage Ratio (ELR), which measures leveraged futures positions relative to exchange reserves, has fallen to 0.16. It is now close to its April 2026 low of 0.15, making it one of the weakest leverage readings since November 2024.

Meanwhile, XRP has corrected by about 70% from its 2025 high of $3.65. This suggests traders have significantly reduced their leveraged exposure during the downturn.

The accompanying chart shows the ELR steadily moving toward the red support zone after peaking during XRP’s previous rally. At the same time, XRP’s price has retraced to around $1.10.

Lower Open Interest Points to a Healthier Market

According to Darkfost, the falling leverage ratio is primarily due to shrinking futures positions. Liquidations during the correction have also contributed to the decline. As leveraged positions are closed, open interest falls, reducing speculative activity.

The analyst said this deleveraging phase is a healthy sign. Excessive leverage often makes markets more fragile and increases the risk of sharp price swings.

Similar to the 2024 Setup

Darkfost compared the current setup to mid-2024, when XRP traded near $0.40 and spent months consolidating while Binance’s ELR dropped to around 0.05.

Following that leverage reset, XRP went on to rally more than 790% to over $3.60, with leverage gradually returning alongside rising prices. With XRP trading at $1.10 today, a repeat of this historical move would put the token’s price at approximately $9.80, close to the psychologically important double-digit level.

However, Darkfost emphasized that the current conditions do not guarantee another major rally. Instead, he said monitoring deleveraging cycles can help traders better understand changes in market structure and position themselves as speculative excess is gradually flushed from the system.

XRP Withdrawals Hit Five-Month High

Meanwhile, XRP holders are moving more tokens off major exchanges, with withdrawals now outpacing deposits on Coinbase, Binance, and Bybit. CryptoQuant data shows that Coinbase recorded its strongest seven-day withdrawal trend since February this week. Withdrawals on Binance have also returned to February levels.

Despite the increase in exchange outflows, XRP’s price has remained stable near $1.10, suggesting the withdrawal trend has not yet translated into immediate price gains.

Analyst Amr Taha added that the data measures the number of deposit and withdrawal transactions—not the amount or value of XRP moved—making it a reflection of changing user behavior rather than capital flows.