Home Blog Page 676

Cardano Founder Confirms Full XRP Package in the Works Around Glacier Airdrop, XRP DeFi, and RLUSD

0

The Cardano founder has confirmed working on a full XRP package for the Cardano ecosystem, which includes the glacier airdrop, XRP DeFi, and RLUSD integration.

Charles Hoskinson has confirmed that his team is working on a full package focused on the XRP ecosystem. This plan includes support for the upcoming Glacier Airdrop, potential XRP-powered DeFi tools, and discussions around bringing Ripple’s RLUSD stablecoin to the Cardano network.

Hoskinson shared the update during a conversation on X after a community member asked for an update on RLUSD integration on Cardano. In his response, he said the work goes beyond RLUSD and involves a larger effort to connect more closely with the XRP community.

The Glacier Airdrop and XRP Support on Lace

A major part of this plan is the Glacier Airdrop, now scheduled for the last quarter of 2025. Originally expected earlier in the year, the airdrop will distribute Midnight tokens, used in Cardano’s privacy-focused sidechain, to retail users across several blockchains, including XRP holders. 

Hoskinson has affirmed that the goal is to reward regular users, not big investors or venture capital firms. Notably, he described this as part of a “cooperative economics” model that puts the broader community first.

Roughly 37 million wallets will take part in the airdrop, including XRP holders. It is part of Cardano’s push for greater inclusion and cross-chain collaboration and also marks a major step toward healing the long-standing rift between Hoskinson and the XRP community.

Meanwhile, the full XRP package also includes XRP support in Lace. Specifically, Cardano’s Lace wallet is working toward integrating XRP support after introducing Bitcoin support with Lace version 1.22 in April. 

The upgrade will let users manage XRP alongside ADA and other assets. Notably, it is a major step toward Cardano’s goal of becoming a multi-chain platform and turning Lace into a more complete tool for managing assets across different networks.

XRP DeFi on Cardano and RLUSD Integration

The third part of this package involves integrating XRP DeFi into Cardano. Hoskinson has confirmed that his team is exploring ways to bring XRP into Cardano’s DeFi space. 

Specifically, these early-stage efforts focus on building cross-chain liquidity pools and decentralized exchanges that take advantage of XRP’s speed and low fees. However, these ideas are still in development at press time. Recently, Hoskinson confirmed that Midnight could serve as the DeFi layer on XRP, introducing better yields.

Meanwhile, as part of the fourth aspect of this full XRP package, talks are also underway between Cardano and Ripple about bringing RLUSD, Ripple’s U.S. dollar-backed stablecoin, to the Cardano network. 

Hoskinson confirmed these early discussions and said both sides see value in the idea. Although no final decisions or timelines have been set, the move could help both platforms, by growing RLUSD’s user base and boosting activity within Cardano’s DeFi ecosystem.

Overall, the relationship between Cardano and the XRP ecosystem seems to be turning into a real partnership. While the idea remains a concept at press time, Hoskinson has confirmed that work is underway.

Dogecoin Price Rebounds: Can DOGE Reclaim the $0.20 Mark?

Dogecoin bounces off the $0.17 support level with bullish RSI and MACD signals. Can DOGE reclaim $0.20 amid market optimism and rising open interest?

With the broader market recovering, meme coins are back in action. The biggest meme coin, Dogecoin, is up 1% at press time, signaling a bullish comeback as it holds ground at $0.17. Will this short-term recovery help Dogecoin reclaim the $0.20 psychological level? Let’s find out.

Dogecoin Price Reversal Targets $0.20

Dogecoin bounces off a key support trend line on the daily chart as the prevailing downtrend fades. With a lower price reaction from the $0.17 demand zone, Dogecoin prepares for a bullish comeback.

Dogecoin Price Chart

With its first bullish candle in five days, Dogecoin is aiming to test the 23.60% Fibonacci retracement level at $0.2135. Supporting the bullish outlook, the daily RSI line has turned positive in the near-oversold region, signaling a comeback.

Furthermore, the RSI shows a bullish divergence at the previous two bottoms formed near the $0.17 demand zone, hinting at a double-bottom reversal. Additionally, the close proximity of the MACD and signal lines suggests an impending bullish crossover. Hence, the technical indicators maintain a positive stance on Dogecoin.

On the downside, a close below the $0.17 demand zone could test the $0.1298 support floor.

Optimism Surges in DOGE Derivatives Despite Long Liquidation Spike

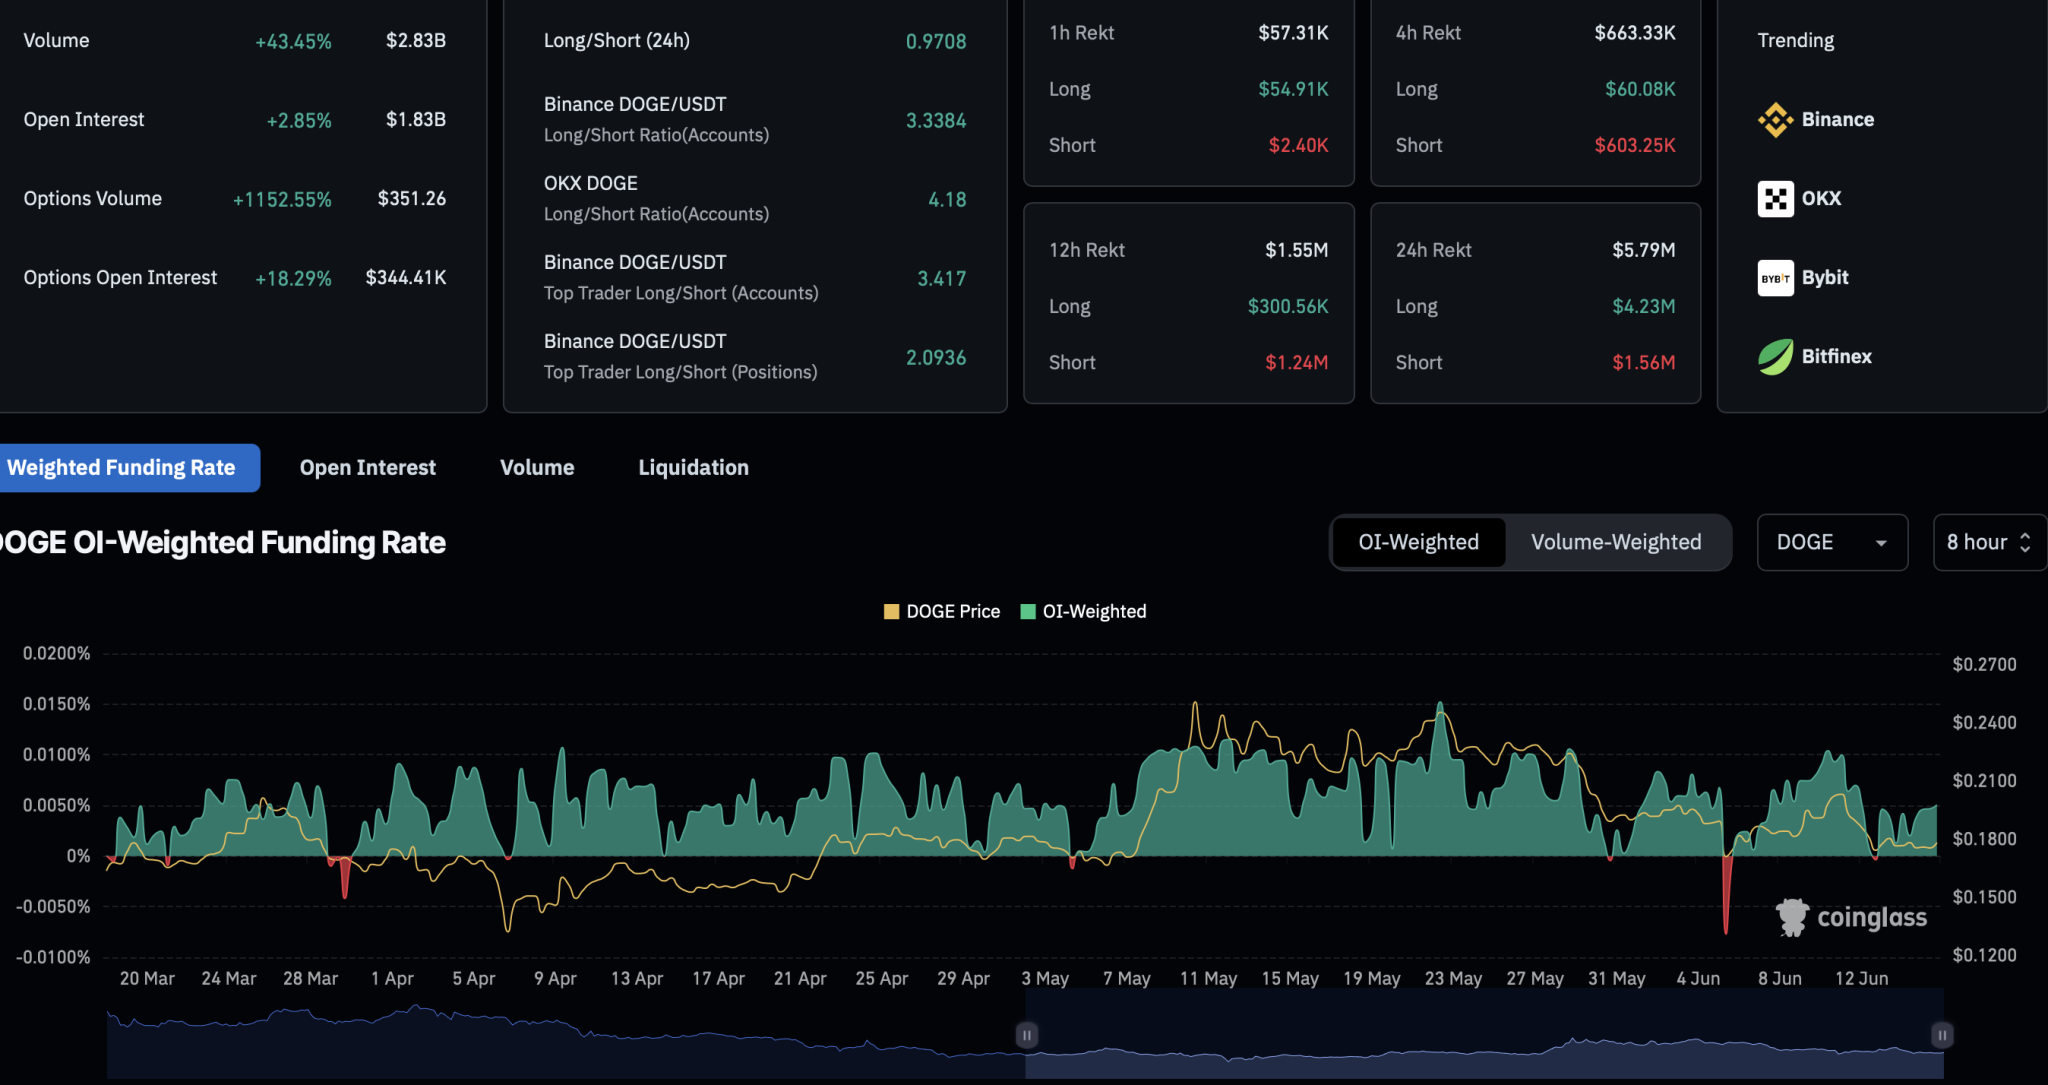
As broader market optimism grows, confidence among Dogecoin traders in the derivatives market is rising. CoinGlass data shows open interest has surged by 2.85%, reaching $1.83 billion, while the over-weighted funding rate stands at 0.0051%. With rising open interest, bullish trading activity is also increasing.

Dogecoin Derivatives

However, data from the past 24 hours reflects a massive wipeout of bullish traders, with long liquidations rising to $4.23 million. Since short liquidations remain limited at $1.56 million, the imbalance has dropped the long-to-short ratio to 0.9708 over the past 24 hours.

Bitcoin Targets $110K Amid $1B ETF Weekly Inflows

Bitcoin climbs above $106K with growing bullish momentum. Weekly ETF inflows surpass $1 billion, while derivatives data points to a potential rally toward $110K.

Starting the week on a positive note, Bitcoin has reclaimed the $106,000 level with a price surge of over 1% in the past 24 hours. Will this short-term recovery push Bitcoin toward the $110,000 mark? Let’s find out.

Bitcoin Price Analysis Eyes $110k

On the 4-hour price chart, BTC has formed three consecutive bullish candles as it bounces off a key support trendline. Maintaining momentum over the weekend with multiple long-shadow 4-hour candles, Bitcoin is now trading at $106,665.

Bitcoin Price Chart
Bitcoin Price Chart

The reversal rally is approaching the immediate resistance at $107,015 as bullish momentum builds. Technical indicators support the potential for a breakout: the MACD and signal lines have formed a positive crossover, while the RSI has crossed above the midpoint, indicating rising bullish momentum.

A breakout above $107,015 could target the $110,266 resistance level, which previously marked a double top on June 10. On the flip side, a potential pullback could see Bitcoin retesting the immediate support trendline near $105,000.

Optimism Soars in Bitcoin Derivatives

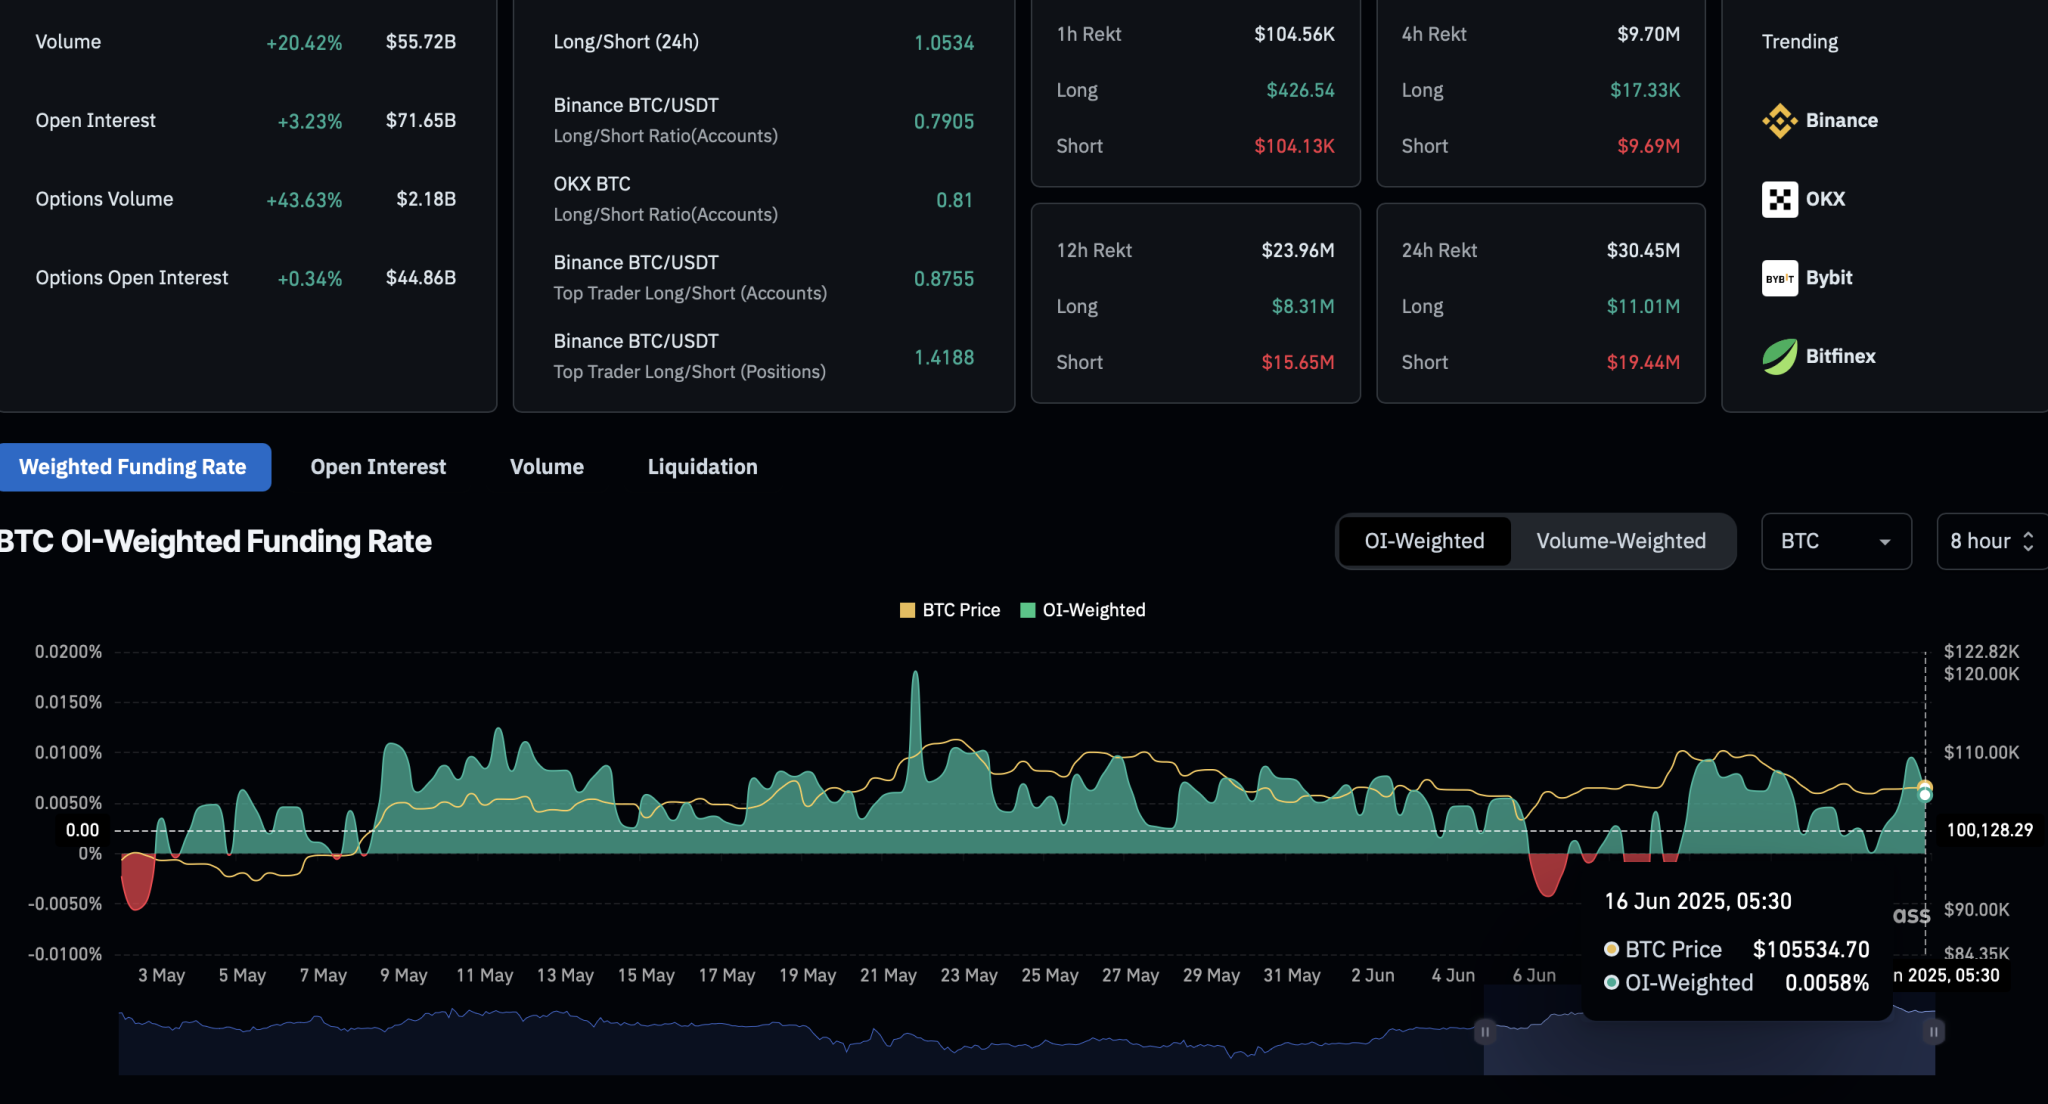
Amid the short-term recovery, optimism in the Bitcoin derivatives market has significantly improved. Increased capital inflow into Bitcoin derivatives has pushed open interest up by 3.23%, reaching $71.65 billion.

With this capital inflow, the OI-weighted funding rate remains elevated at 0.0058%, reflecting increased bullish activity. Notably, short liquidations over the past 24 hours have exceeded $19 million, while long liquidations stand at around $11 million, highlighting a greater impact on bearish positions during the rally.

Bitcoin Derivatives Data
Bitcoin Derivatives Data | Coinglass

As bullish dominance grows, the long-to-short ratio has risen above 1, signaling a higher number of long positions. Thus, CoinGlass derivatives data supports the possibility of an extended rally in Bitcoin.

Retail Investors Lag as Institutional Support Grows

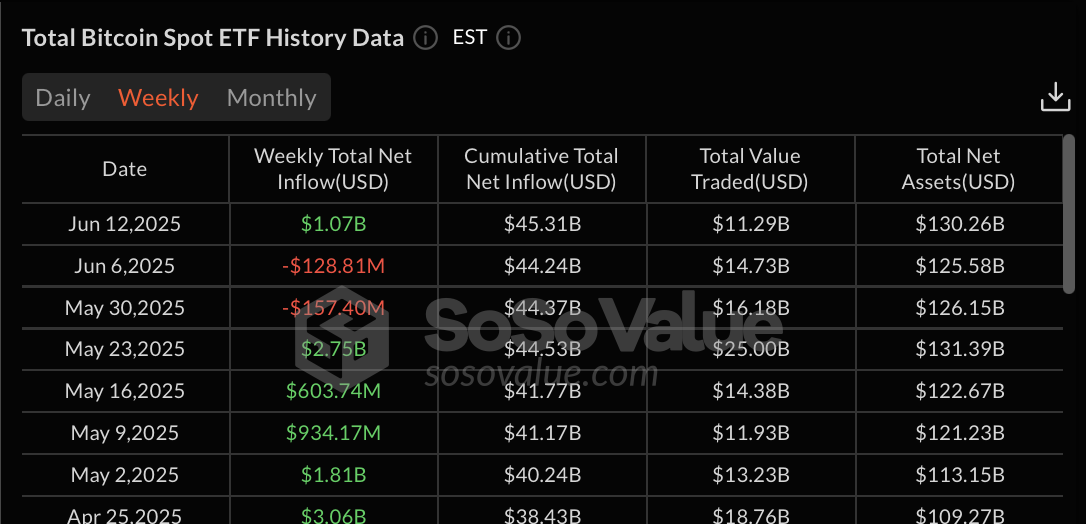
Over the past week, total net inflows into U.S. spot Bitcoin ETFs have exceeded $1 billion, reaching $1.07 billion. On June 13 alone, net inflows totaled $301.62 million, led by BlackRock’s contribution of $238.99 million.

BTC ETFs

Despite rising institutional confidence, retail participation remains low. According to a recent analysis by on-chain analyst DarkFost (CryptoQuant), BTC inflows to Binance from both whales and retail investors have dropped to their lowest levels since the beginning of this cycle. This decline suggests a strong preference for holding over selling.

Notably, both investor groups appear aligned in their approach—an encouraging signal for the broader market. Historically, there have only been two key periods during this cycle where whales and retail investors acted in sync, both coinciding with major market tops when inflows surged together.

In contrast, today’s sharp drop in inflows may imply that most participants are either awaiting clearer macroeconomic cues or are simply demonstrating high conviction in Bitcoin’s long-term trajectory. Such alignment across investor classes could reflect rising market confidence and growing expectations of further upside.

Here is Shiba Inu Price if SHIB Total Supply Reduces to 10 Trillion Tokens

0

Shiba Inu could trade with three zeros after its decimal if its total supply reduces to just 10 trillion tokens. 

Since its launch in August 2020, Shiba Inu has made significant progress across different sectors. This is evident in its evolution from a meme coin to a utility token and its dramatic reduction in supply. 

Shiba Inu’s Supply History

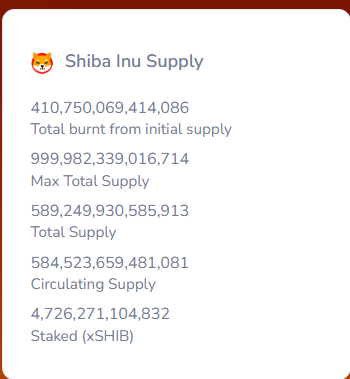
Recall that Shiba Inu launched with an enormous supply of 1 quadrillion SHIB tokens in August 2020. Interestingly, its total supply has dropped to 589.25 trillion SHIB, representing 58.95% of Shiba Inu’s initial supply, according to data from Shibburn. 

The remaining 410.75 trillion tokens were permanently removed from the supply through a series of burn campaigns, including one initiated by Ethereum co-founder Vitalik Buterin. 

Shiba Inu latest burn

Community Push for Further Burns

Even though over 41% of Shiba Inu’s initial supply has been burned, some community members call for further incineration to reduce SHIB’s supply to approximately 10 trillion. They highlighted Shiba Inu’s enormous supply of 589.25 trillion tokens as the culprit behind SHIB’s underperformance. 

For perspective, SHIB’s price has plunged 40.86% over the past year and 42.3% since 2025. At the current price of $0.00001220, SHIB has experienced a double-digit loss of 14.47% over the past month and a 1.4% decline over the past week. 

It is worth mentioning that SHIB’s recent underperformance coincides with a broader market downturn. For instance, Ethereum’s price has also dropped 21.3% since 2025 and 25.98% over the past year. 

However, some Shiba Inu community members continue to blame SHIB’s underperformance on its excessive supply. Therefore, they demand more significant incineration to reduce the supply to 10 trillion tokens. 

Shiba Inu Price if Supply Drops to 10 Trillion

To reach a 10 trillion supply target, over 579 trillion SHIB tokens would need to be burned, a monumental task. This could potentially be achieved through aggressive burn mechanisms, including Shibarium-based fees and community-driven campaigns.

Assuming the market cap remains at its current level of $7.19 billion, a 10 trillion token supply would push SHIB’s price to $0.000719. This would mark an approximate 5,793% increase from its current price of $0.00001220. 

SHIB to $0.0007 Forecast 

Meanwhile, the $0.0007 target has been featured in several predictions from market experts. For instance, major crypto prediction platform Telegaon speculated that SHIB will trade around the $0.0007 mark by 2030. According to Telegaon, Shiba Inu could reach a maximum target of $0.000712 by then, five years from now. 

Notably, Changelly experts project that SHIB will skyrocket to the $0.0007 region by December 2034. The crypto exchange initially predicted that SHIB would hit the mark by 2030. However, the platform updated the timeline following SHIB’s downturn over the past few months. 

Final Thoughts

While a supply cut to 10 trillion tokens could technically lead to a price of $0.000719 under current market cap conditions, the likelihood of burning over 579 trillion tokens remains extremely slim.

Still, the scenario underscores how pivotal tokenomics, particularly supply reduction, can be in driving price performance.

This article is intended for informational purposes only and does not constitute financial advice.

Ethereum Rebounds as Bullish Signals Point Toward $2,800

Ethereum recovers from key support levels as open interest jumps 4.75%, and short liquidations exceed $34 million. Key resistances are at $2,699 and $2,800.

At press time, Ethereum records a 3% intraday gain, mirroring Bitcoin’s bullish recovery. Amid a broader market rebound, the declining Ethereum exchange reserves, alongside growing optimism in the derivatives market, signal a potential upside.

Ethereum Price Analysis Eyes Breakout Above $2,699

On the daily chart, Ethereum exhibited a major bullish failure last week, unable to hold above the 50% Fibonacci level at $2,699. This led to a price drop to a weekly low of $2,439, followed by a bullish reversal. 

Ethereum Price Chart

With long lower shadows on recent candles, Ethereum has rebounded to a market price of $2,626, indicating a bullish turnaround. As it aims to retest the 50% Fibonacci level, the surge in bullish momentum increases the likelihood of a breakout.

The MACD and signal lines are nearing a bullish crossover, while the RSI is reversing upward from the midpoint, indicating growing buying pressure. Thus, technical indicators remain optimistic for Ethereum.

According to Fibonacci levels, a breakout above the 50% level could target the 61.8% Fibonacci level at $3,003. However, the recent peak near $2,800 could serve as intermediate resistance.

On the downside, critical support remains at the 38.2% Fibonacci level at $2,395.

Supply Pressure Eases Amid Declining Ethereum Reserves

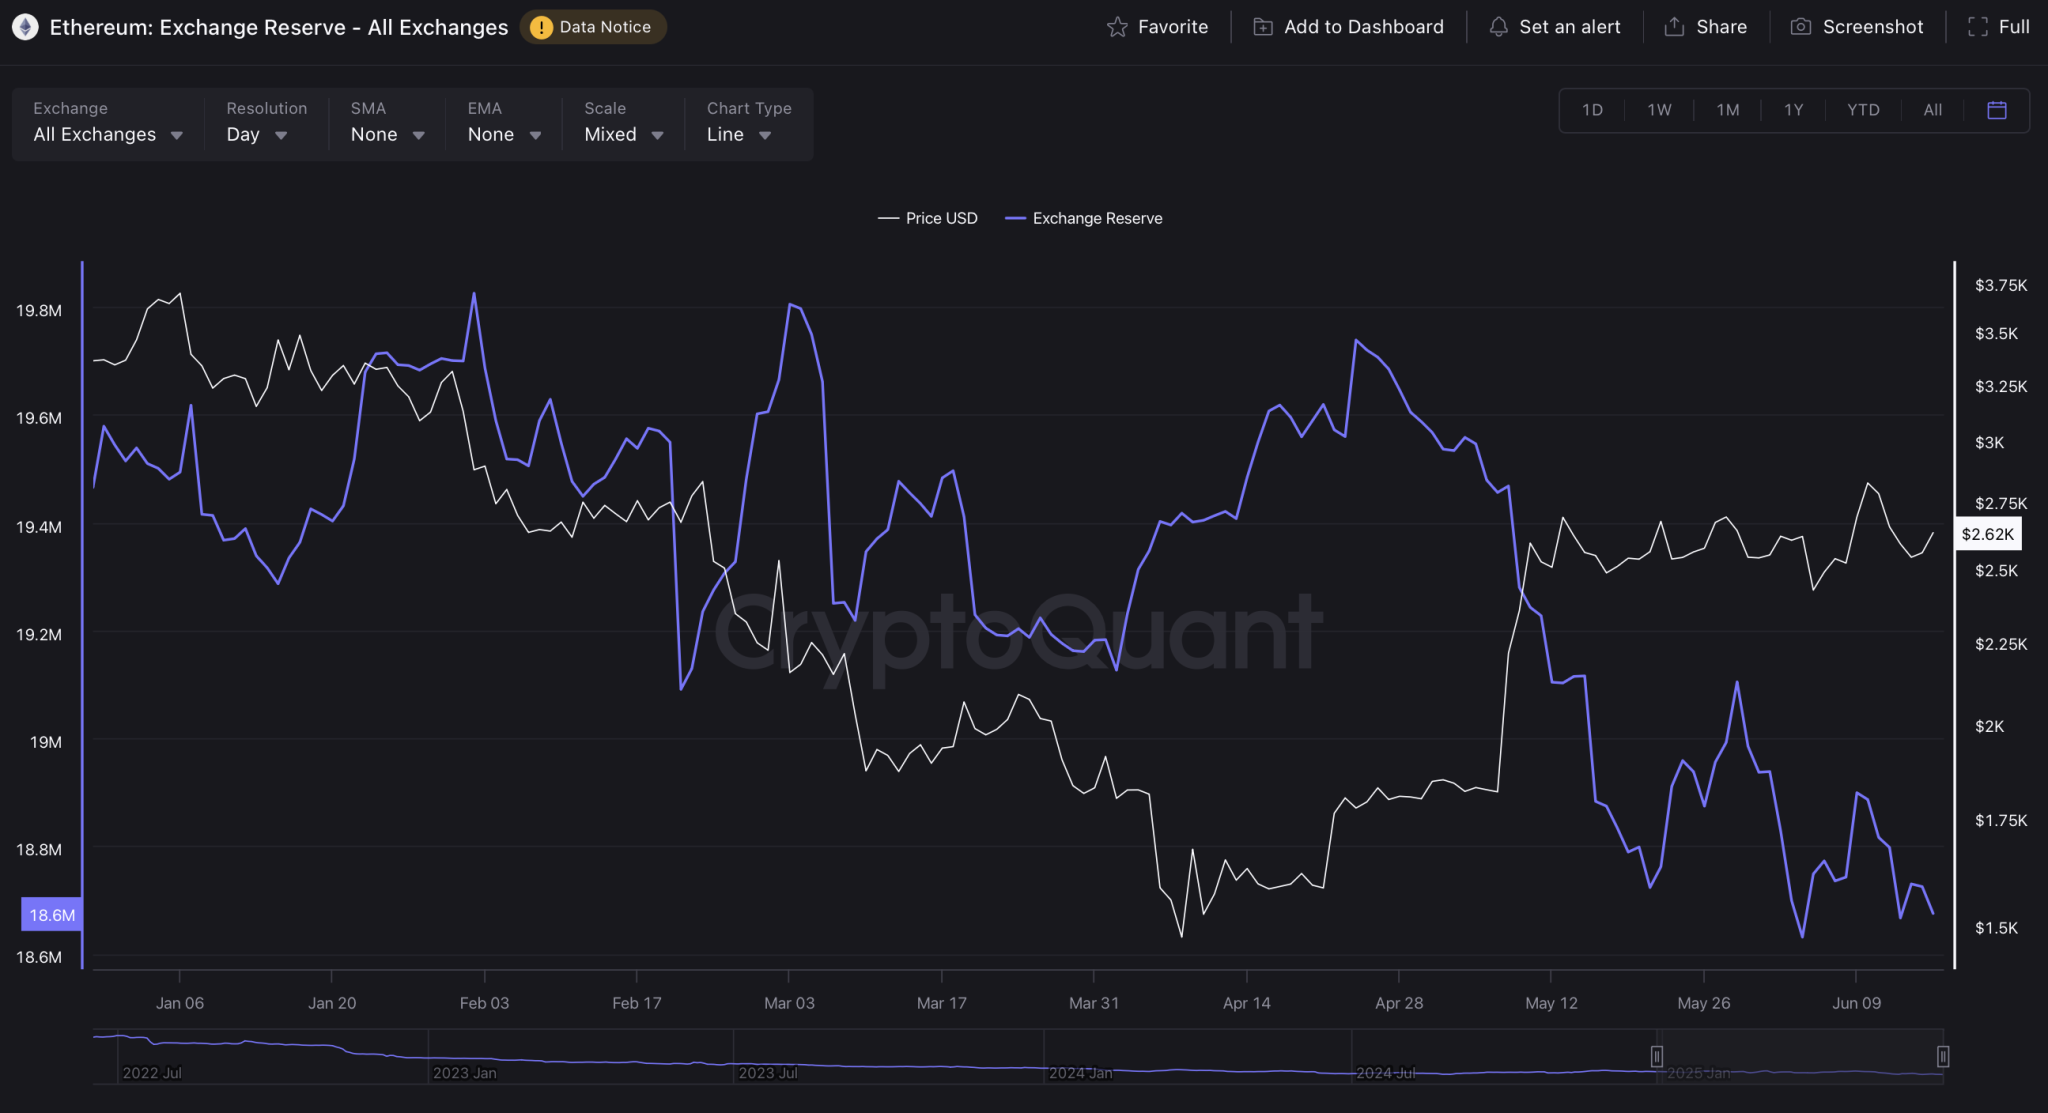
According to CryptoQuant data, last week’s bullish failure followed a brief spike in Ethereum’s exchange reserves, reaching a weekly high of 18.89 million ETH. However, as the market recovers, investors are again withdrawing ETH from centralized exchanges, reducing selling pressure. 

Currently, the exchange reserve stands at 18.67 million ETH, approaching the all-time low of 18.63 million ETH recorded on June 4

Ethereum: Exchange Reserve
Ethereum: Exchange Reserve.

Bulls Gain Ground in Ethereum Derivatives Market

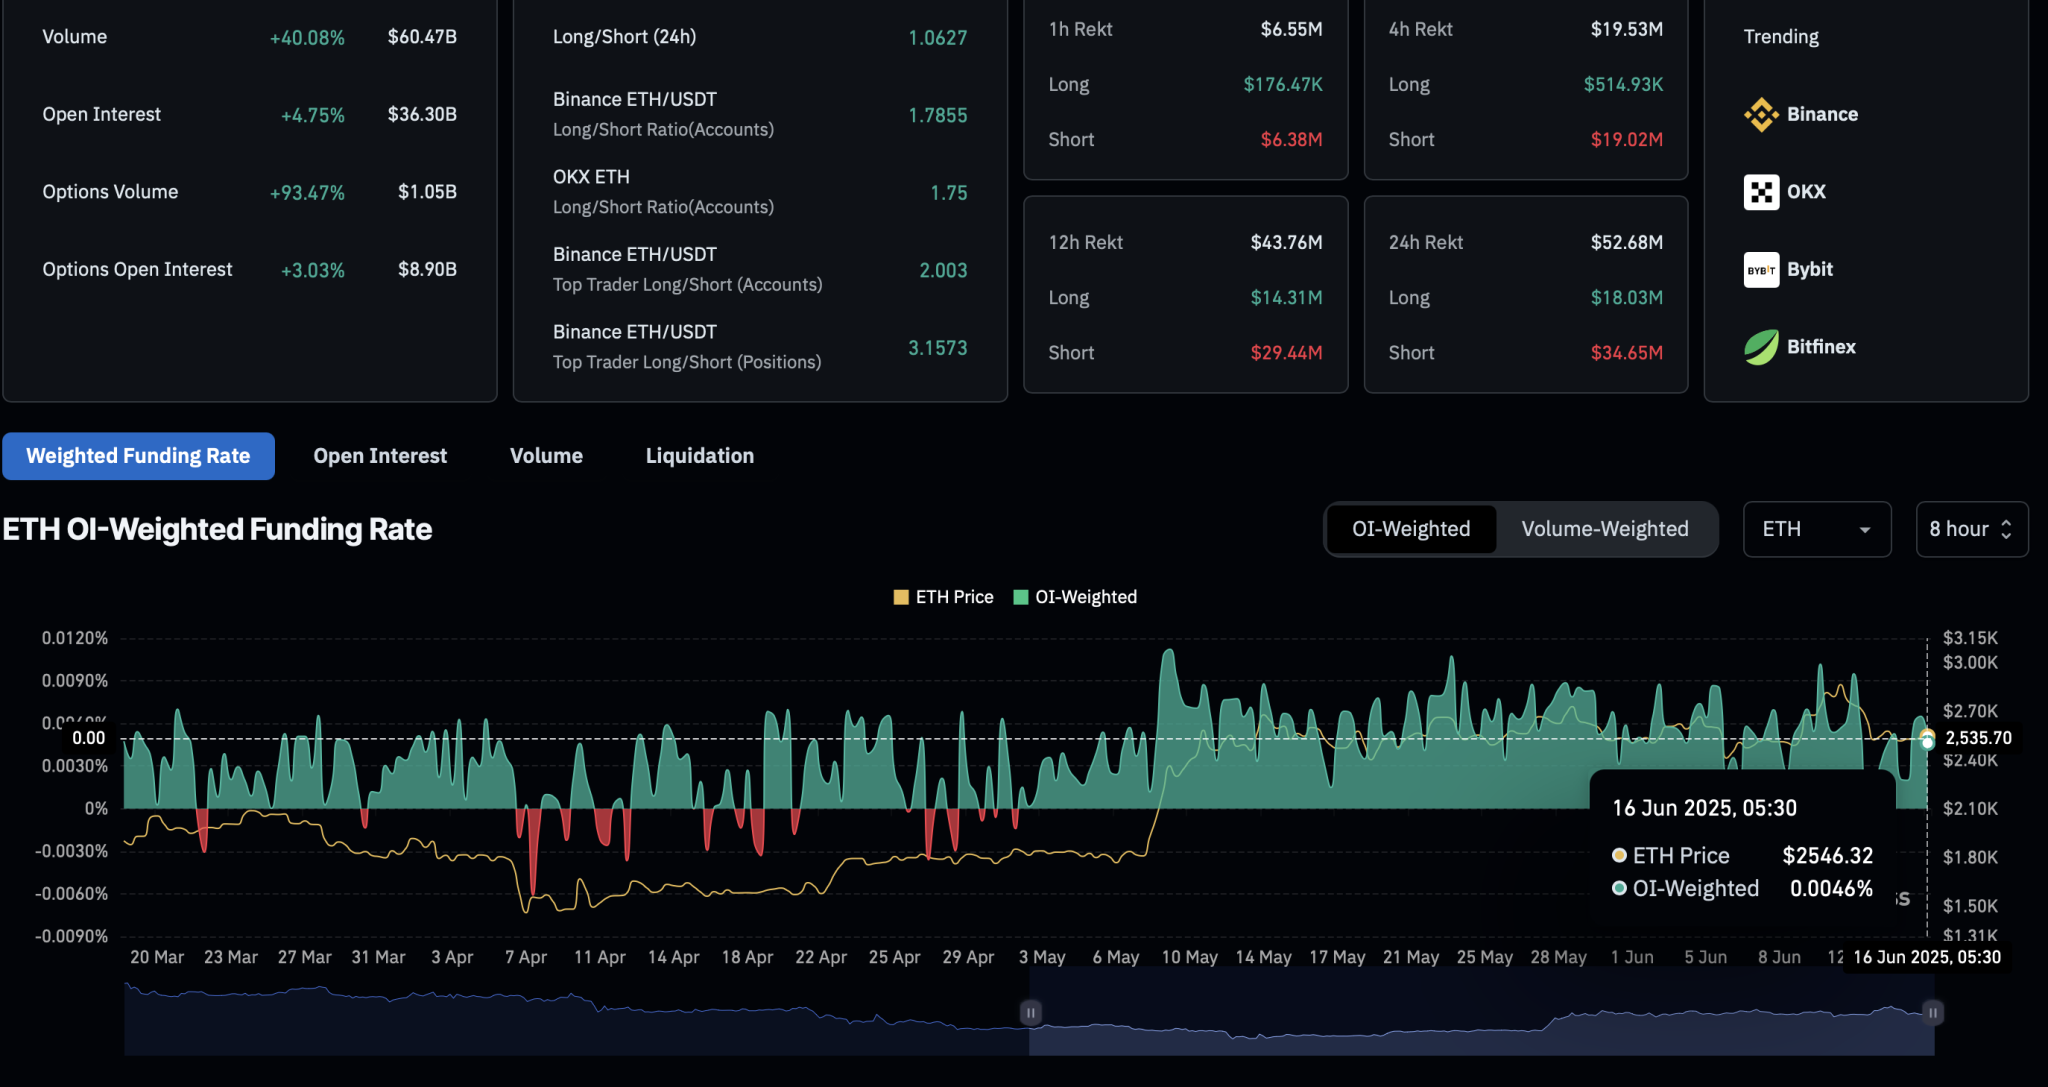
CoinGlass data indicates growing optimism in Ethereum as the broader market rebounds. Ethereum’s open interest is up 4.75%, reaching $36.30 billion, while the OI-weighted funding rate stands at 0.0046%. This reflects an increase in bullish sentiment and expectations of a sustained recovery.. 

Ethereum Derivatives

In the past 24 hours, liquidations reveal a bullish bias, with $34.65 million in short positions liquidated compared to $18.03 million in long positions.

Following the significant short squeeze, the long-to-short ratio has climbed to 1.0627, indicating a bullish imbalance in open positions.

Checking XRP Prices Ages You Three Times Faster, Says Crypto Pundit

XRP is once again in the spotlight, not for a price surge, but for the emotional toll it’s taking on steadfast holders. 

Long-time investors are growing increasingly weary as the token continues to trade around $2, showing little movement over the past six months. Despite its high-profile backing and years of media attention, XRP remains below its all-time high of $3.84, set over seven years ago.

XRP Makes You Age Faster?

XRP community voice Max Avery captured the sentiment on X with a viral post comparing the experience of holding XRP to aging. He joked that one month of watching XRP prices feels like three regular months. He added that by the time the coin hits $5, holders may feel as though they’ve lived through historic hardships.

Notably, XRP is trading at $2.19 today, up 2.2% in the last 24 hours but down 8% over the past week. Although the coin boasts an impressive one-year growth of 350%, it still sits 43% below its all-time high.

Avery’s remarks resonated with many in the community, highlighting the mental and emotional strain that accompanies long-term crypto investing, especially when price movement is minimal. Other commentators shared humorous takes.

“I Would Have Grown Gray Hairs”

One notable reply to Avery’s post came from Edoardo Farina, founder of Alpha Lions Academy. He reflected that learning this hard lesson in 2021 may have saved him from premature gray hairs.

Farina has repeatedly warned investors against obsessively checking the XRP price chart, noting that it induces anxiety and leads to emotional decisions.

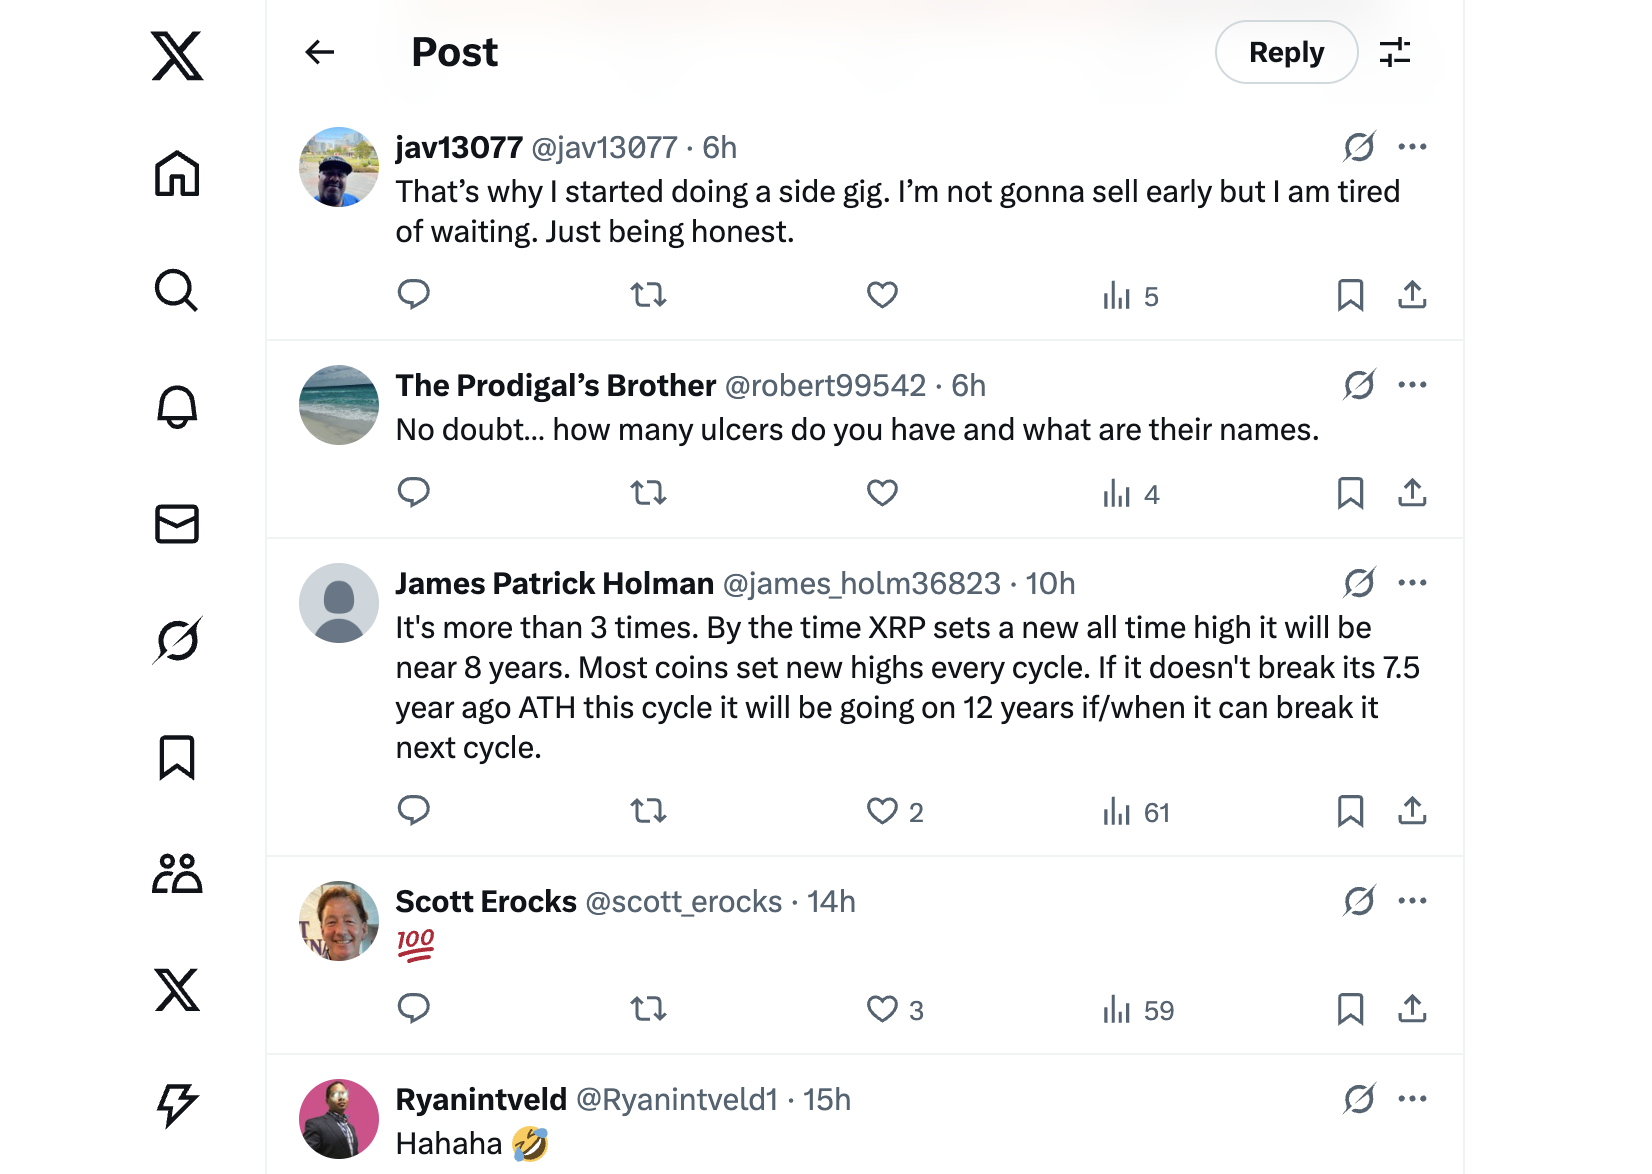
While some holders remain committed to not selling early, patience is wearing thin. One user shared that they’ve taken up a side gig just to cope with the long wait. Another jokingly asked how many ulcers fellow holders have, highlighting the coin’s long-term underperformance.

XRP Community reactions
XRP community reactions

Has XRP Peaked?

X user James Patrick Holman pointed out that XRP hasn’t reached a new high since 2018, unlike many other crypto assets that reset records with each market cycle. He warned that if it misses this cycle, it could take 12 years for XRP to revisit its previous peak.

Some market commentators have suggested XRP may have already peaked for this cycle when it reached $3.40 in January of this year. These opinions are surfacing as Bitcoin continues to break new records, while XRP lingers around the $2 mark.

However, according to analyst EGRAG, XRP could still reach up to $24 this year. Bitcoin analyst Davinci Jeremie has expressed a similar outlook.

Ultimately, despite the fatigue, the XRP community’s commitment remains strong. But as the token lags behind other major cryptocurrencies, investor pressure and emotional burnout will likely persist.

Analyst Says XRP Holders are About to Make a Lot of Money: Here’s His Target for This Cycle

0

A prominent market analyst insists XRP holders are about to make a lot of money, suggesting the market has not yet priced in XRP’s victory in the SEC lawsuit.

Crypto Beast, a notable market commentator, made this assertion in a recent disclosure amid the current market uncertainty. Despite XRP’s pullback from $3.4 and the ongoing bearish consolidation around $2, Crypto Beast insists XRP has not yet hit its top for this cycle.

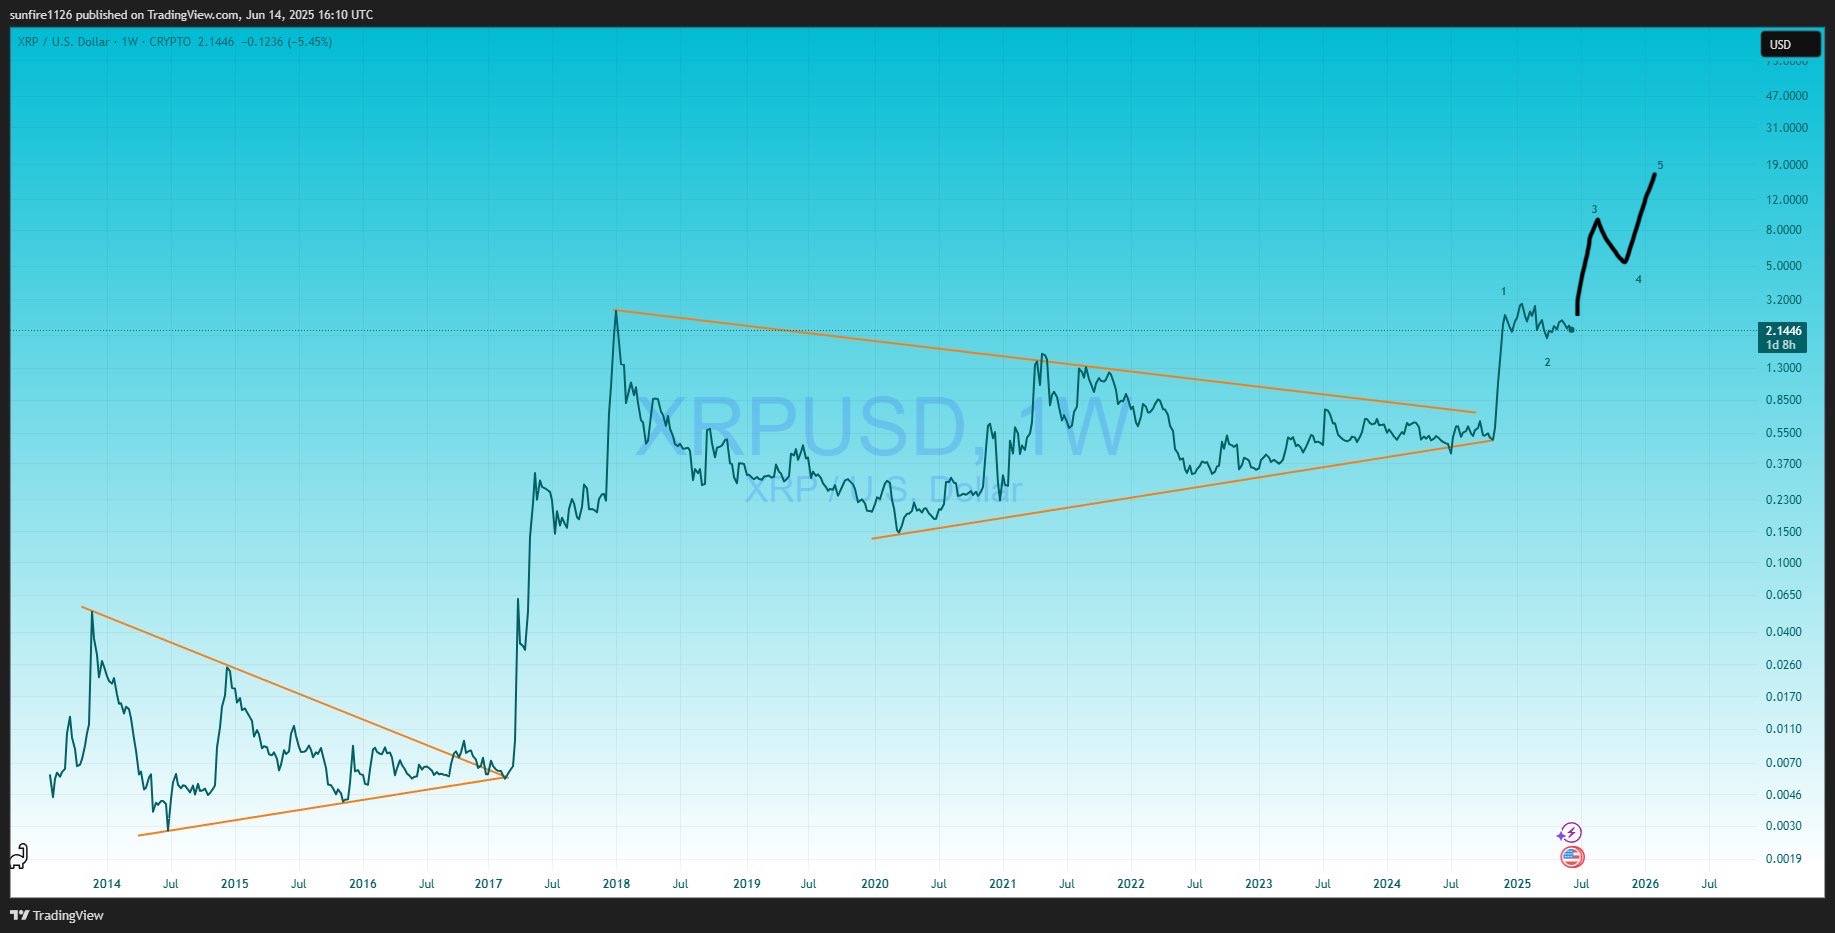
This aligns with projections from analyst EGRAG, who recently dismissed claims that the top is already in at $3.4. Specifically, Crypto Beast presented a weekly XRP chart highlighting an extensive symmetrical triangle structure that points to a more expensive uptrend for the crypto asset.

XRP Symmetrical Triangle Breakout Points to Higher Targets

Notably, data from his chart shows that XRP has observed two such symmetrical triangle structures since late 2013. For context, the first symmetrical triangle formed when XRP dropped from the $0.06 high in December 2013, and lasted for about four years, as XRP broke out in March 2017.

Meanwhile, the second symmetrical triangle formed when XRP dropped from the $3.8 peak in January 2018, and lasted for seven years, with XRP eventually breaking out in November 2024 amid the massive upsurge triggered by President Donald Trump’s election victory.

Interestingly, this upsurge faced a roadblock at $3.4, leading to the current range-bound phase. While some believe the $3.4 peak marks XRP’s top, Crypto Beast begs to differ. His chart shows that XRP witnessed a similar pattern following the previous triangle breakout in 2017.

XRP 1W Chart Crypto Beast
XRP 1W Chart | Crypto Beast

Specifically, after XRP broke out from the first symmetrical triangle in March 2017, its uptrend met a roadblock at $0.3988 in May 2017. A six-month consolidation ensued, with XRP recovering in December 2017 to a new peak of $3.8 by January 2018.

Crypto Beast expects a similar pattern to play out. Currently, XRP has consolidated for about five months. He predicts the forthcoming recovery to push prices to a minimum target of $8, with a possible upsurge to around $19, representing a fifth Elliott Wave.

XRP’s Lawsuit Victory Not Yet Fully Priced In

One of the developments boosting Crypto Beast’s optimism is Judge Analisa Torres’ July 2023 declaration that XRP is not a security. Despite XRP’s 90% rally following this ruling, Crypto Beast insists the market has not yet fully priced in this development.

He believes the upcoming second wave of the rally would yield wealth for XRP investors. “XRP holders are about to make a lot of money,” the analyst suggested. According to him, he will inform his audience when the perfect time to take profit on their investments comes.

Interestingly, while Crypto Beast’s projections point to a potential peak of $19, EGRAG, another analyst, sets this as his minimum target for XRP. According to him, XRP could soar to a price between $19 and $45. Also, community commentator Xena suggested that while $8 is an improvement, it’s still below XRP’s upsurge potential.

Currently, XRP trades for $2.2, requiring just a 263% increase to reach the $8 price. Meanwhile, for the $19 price level, XRP would need to rally by a more substantial 763%.

Analyst Reveals “Shocking Truth” About Ripple XRP Sales, Says They’re Not for Profit

0

A notable voice in the XRP community recently took to X to reveal some ‘shocking truth’ about Ripple’s continued XRP sales. 

Notably, Ripple’s XRP deals are part of its monthly release of 1 billion tokens from escrow. While Ripple relocks up to 700 million of the released funds in escrow, it keeps the remaining tokens in separate blockchain wallets, ready for sale at any time. 

Meanwhile, controversies have continued to surround Ripple’s XRP sales. Many suggest that the company is dumping the tokens for profit alone. Others believe that Ripple’s sales negatively impact the price of the token. 

“Shocking Truth” About Ripple’s XRP Sales 

However, popular community commentator “Stellar Rippler” suggested that the proceeds of Ripple’s XRP sales have primarily been used to “quietly buy the future.”

He asserted that Ripple has been using the proceeds from XRP sales to acquire pieces of the new financial system. He suggested Ripple is not selling XRP solely for profit, but strategically deploying the proceeds into significant initiatives.

According to the analyst, the proceeds have funded Ripple’s partnerships, acquisitions, and projects like RLUSD. He highlighted some of Ripple’s major partnerships over the years, including collaborations with SBI, Tranglo, and Bitstamp. In terms of acquisitions, Ripple has purchased significant companies like Hidden Road and Metaco.

SEC Lawsuit: A Blessing in Disguise 

The XRP proponent also emphasized that Ripple has achieved these feats despite its involvement in a heated legal tussle with the SEC. Interestingly, he described the SEC lawsuit as a strategic cover and a blessing in disguise.

According to him, the case kept retail investors distracted with courtroom drama. Meanwhile, Ripple quietly executed multi-million-dollar acquisitions, developed its stablecoin, and expanded its global payment network.

Stellar Rippler suggested Ripple has been quietly building its own version of ‘BlackRock,’ establishing a presence in tokenized real-world assets (RWA), remittance infrastructure, custody, and tokenized dollars.

Now that the lawsuit nears its conclusion, he believes XRP’s true purpose is becoming more apparent.

Ripple Now Competes Across Multiple Fronts 

Furthermore, Stellar Rippler described Ripple as playing ‘geopolitical chess’ over the years, noting the company is now competing across multiple fronts. 

In his view, Ripple now challenges SWIFT with its RippleNet rails, rivals BlackRock through its institutional custody ventures, and takes on stablecoin issuers like Tether and Circle via RLUSD.

In light of these developments, Stellar Rippler believes Ripple is not dumping XRP for profit. Instead, it is using the proceeds effectively to gain influence over global liquidity.

“And when the switch flips… most won’t catch up. We’re not early or late. We’re right on time,” Stellar Rippler remarked.

VanEck Warns Bitcoin Strategy Companies Face Risk as NAV Parity Looms

0

Public companies adopting a Bitcoin treasury strategy may need to reconsider the approach if stock prices begin approaching net asset value, according to VanEck’s head of digital assets research, Matthew Sigel.

The warning comes as concerns mount over the potential for shareholder dilution and value erosion in firms that aggressively raise capital to acquire Bitcoin.

Sigel emphasized that no public company holding Bitcoin in treasury has historically traded below its Bitcoin NAV for a sustained period. However, one firm is now nearing that threshold, signaling potential risks in the current strategy.

As Bitcoin continues to reach new highs in 2025, share prices for some companies have not followed suit, raising questions about the efficacy of this capital allocation model.

Dilution Risks Emerging Amid Falling Premiums

With some public companies persistently issuing equity through at-the-market (ATM) programs, Sigel noted that the traditional benefits of capital formation may be at risk. If a stock trades at or near its NAV, ongoing equity issuance may begin to dilute shareholder value rather than enhance it.

Semler Scientific, a notable example, has seen its share price decline by more than 45% this year despite Bitcoin’s upward momentum. This disconnect highlights the danger of relying on equity issuance when investor sentiment fails to reflect asset value. Sigel referred to this scenario as erosion—not capital formation—if such trends persist.

To mitigate this risk, he recommended safeguards such as pausing ATM programs for 10 trading days when share prices fall below 0.95 times NAV. He also advised prioritizing share buybacks when Bitcoin appreciates but equity prices lag. If a NAV discount continues, strategic reviews such as mergers, spin-offs, or ending the Bitcoin strategy should be considered.

Executive Compensation Under Scrutiny

Sigel also highlighted governance concerns, suggesting that executive compensation should be tied to NAV-per-share growth rather than total Bitcoin holdings or share issuance volume. He compared the current situation to earlier trends seen in the mining sector, where excessive issuance and elevated executive pay damaged long-term shareholder value.

While MicroStrategy’s Michael Saylor has stated plans to buy back shares if they fall below 1x NAV, Sigel pointed out that not all companies have preferred shares available to support such moves. Still, he said all boards can take action by halting dilution and focusing on NAV-per-share growth as premiums fade.

Metaplanet and Strategy Continue Bitcoin Accumulation

Meanwhile, firms have continued building their Bitcoin position. Metaplanet CEO Simon Gerovich confirmed a recent purchase of 1,112 Bitcoin for $117.2 million by the firm, at an average price of $105,435. 

Further, despite rising geopolitical tensions in the Middle East, Strategy, led by Michael Saylor, signaled intentions for further purchases, based on Saylor’s most recent Bitcoin chart commentary.

New Bitcoin Model Predicts $444K Milestone by June 2026 Under Supply Constraints

0

A study by Murray Rudd projects Bitcoin reaching higher levels by 2027 under all supply withdrawal scenarios, driven by constrained supply.

Bitcoin experienced moderate volatility over the past week, with a brief yet notable downturn late in the week. Prices began strong, surging to nearly $110,000 before correcting sharply on June 12–13. This correction brought Bitcoin down to slightly above $103,000. As of Monday, however, the asset had begun recovering, trading around $106,603. 

Despite the recent price fluctuation, long-term projections from a recent study suggest a dramatically different trajectory under specific market constraints.

Long-Term Price Models 

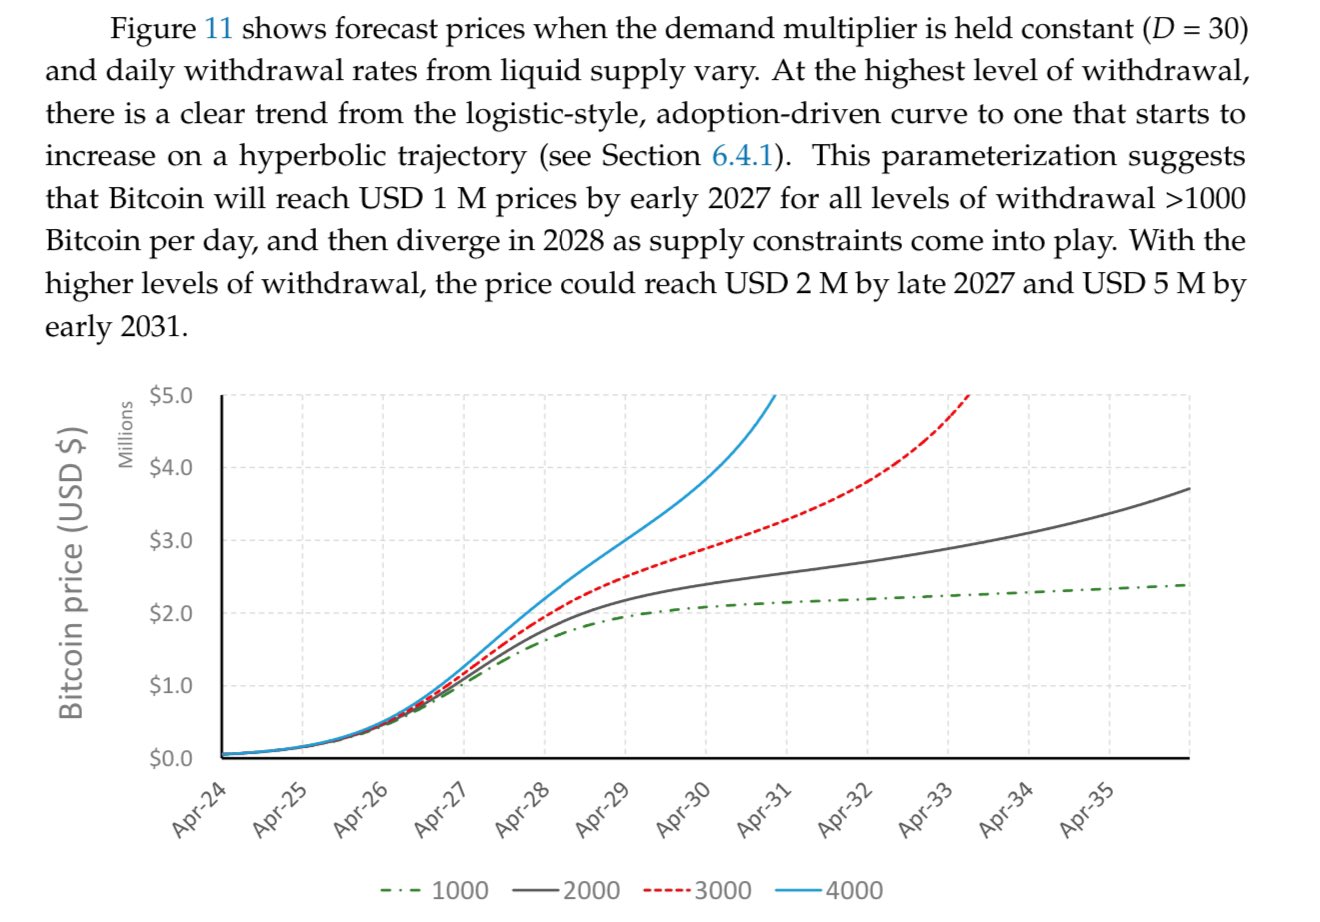
One such study is a forecast report by Murray Rudd, recently shared by Joao Paulo Mayall, founder of QR Capital, which launched the first Bitcoin ETF in Latin America. Specifically, it presents Bitcoin price projections until April 2035, based on various rates of daily withdrawals from circulating supply.

The study assumes a constant demand multiplier of 30, simulating increasing demand pressure on a declining supply. The chart outlines four withdrawal scenarios: 1,000 BTC/day, 2,000 BTC/day, 3,000 BTC/day, and 4,000 BTC/day, each showing distinct price paths.

Image

Notably, all the scenarios display an early acceleration in price growth starting in 2024. By mid-2026, prices converge across all models near $444,000. In early 2027, the projections continue this alignment, showing all scenarios reaching close to $1 million. However, by late 2027, the models diverge as higher withdrawal scenarios lead to faster price growth. 

Under a 3,000 BTC/day scenario, projections reach around $2 million. In the 4,000 BTC/day case, the price extends further to approximately $2.2 million by that same time. By 2031, the 4,000 BTC/day model shows Bitcoin surpassing $5 million.

Notably, from its current level of $106,603, Bitcoin would need to rise roughly 316.5% to reach the $444,000 milestone estimated for mid-2026.

Broader Industry Projections

Several industry leaders have echoed projections similar to those in Murray Rudd’s model. For one, Strategy’s executive chairman, Michael Saylor, recently stated in an interview with Bloomberg that Bitcoin is unlikely to revisit a bear market phase in the near term. He argued that the asset has passed its most volatile stage and is now heading toward long-term price levels between $500,000 and $1 million.

BTC Inc.’s Chief of Staff, Brandon Green, also highlighted structural shifts in Bitcoin accumulation, suggesting that this cycle may not follow the typical one-year correction seen in previous four-year patterns.

Green predicted that this ongoing cycle could continue until the end of 2026 or early 2027, with Bitcoin reaching as high as $1 million, citing accelerating institutional adoption and fiscal policy changes as key drivers.

Similarly, Binance’s former CEO, Changpeng Zhao, has projected a $1 million Bitcoin price target by the end of the current cycle.

Market Signals Suggest Lower Selling Pressure

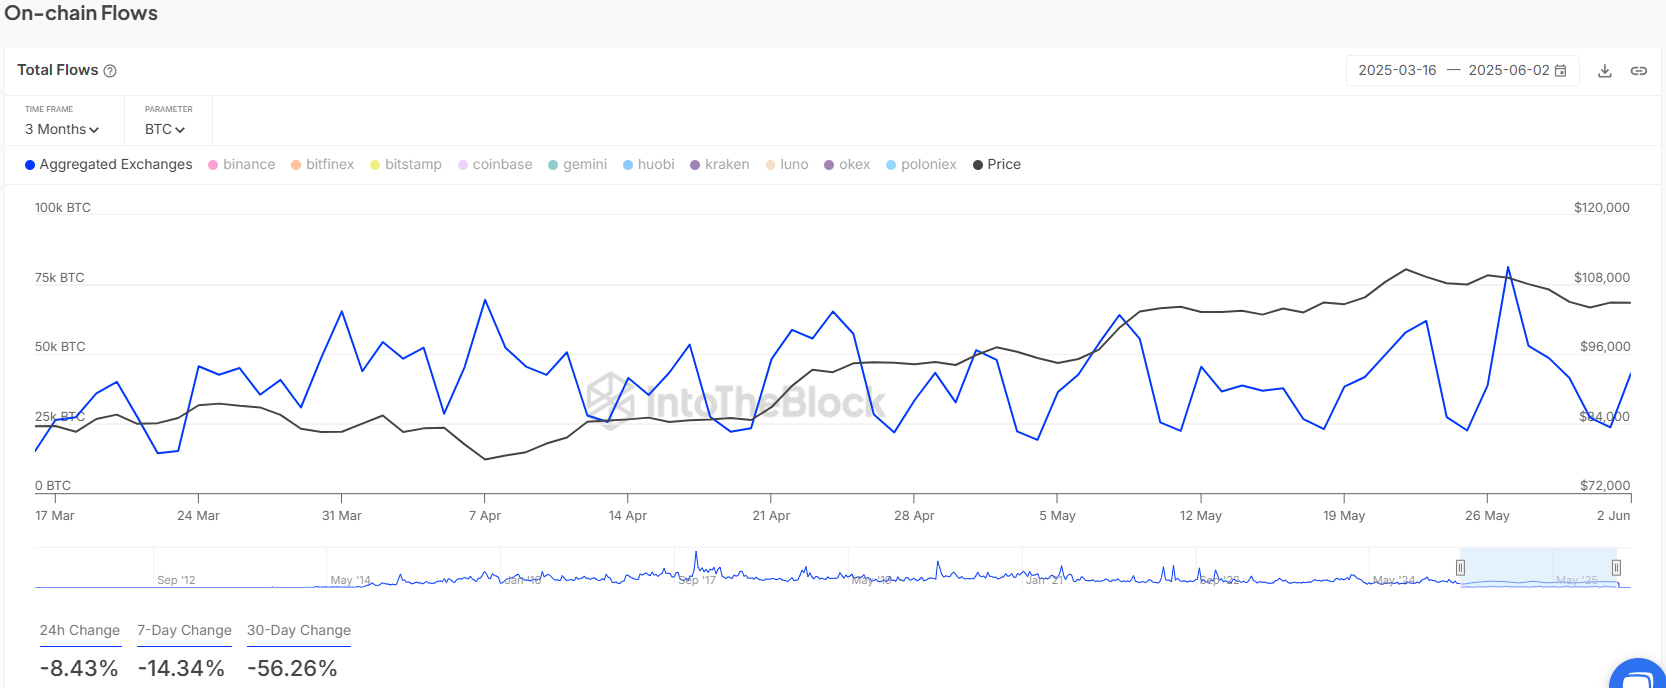
Alongside these projections, recent on-chain metrics suggest a shift in market behavior. Data from IntoTheBlock highlights a consistent reduction in Bitcoin exchange inflows over multiple timeframes. 

Screenshot 2025 06 16T085755981
Bitcoin Exchange Flows

Over the past 30 days, the net flow of Bitcoin to exchanges dropped by 56.26%. The 7-day and 24-hour periods also showed similar declines of 14.34% and 8.43% respectively.

This trend may indicate reduced selling pressure, as fewer coins are being sent to exchanges. While the study focuses on long-term models, these short-term signals provide additional context to supply dynamics and price movement.