Home Blog Page 689

Analyst Reveals His XRP Sell Targets, Says These Levels Could Upset a Lot of Maxis

Mr. Xoom, a prominent XRP analyst, has presented his bullish sell targets, but suggests they might not sit well with some proponents.

According to the analyst, this is because most of these proponents may find their targets too conservative. For context, with investors anticipating an XRP breakout since the asset’s collapse in January 2018, this seven-year wait has triggered an appetite for greater returns.

Mr. Xoom Reveals His XRP Take-Profit Targets

However, Mr. Xoom is looking to take profit on his XRP bag at lower targets. In his latest commentary, he first disclosed that he sold 15% of his XRP holdings when the asset claimed $2.8. Notably, XRP has hit $2.8 four times this bull run. This occurred in December 2024, January 2025, February 2025, and March 2025.

While Mr. Xoom failed to highlight the exact moment, he also confirmed that he re-bought XRP when the asset dropped to $2. An investor questioned the practicality of such a move, considering tax implications. However, Xoom stressed that he does not pay taxes, being a Dubai resident.

Now, the market analyst plans to sell another 15% of his holdings once XRP claims the $4.5 to $5 region. This level would mark a 102% to 124% increase from XRP’s current price of $2.23. Interestingly, trader Crypto Beast also plans to take profit of around $5, when his XRP investment grows to $10 million. 

Meanwhile, after selling 15% of his XRP investment at $4.5 to $5, Mr. Xoom revealed he would hold onto the rest of the bag until XRP claims the $7 to $8 price area, representing a 214% to 259% rise from current levels. The analyst had confirmed this in a February disclosure in which he lined up his TP targets on different assets.

However, despite planning to take profit at $8, Mr. Xoom believes XRP could reach greater heights. According to him, his XRP upside target is actually $8 to $13. Nonetheless, he is taking profit at lower regions as it is ill-advised to try to time the top, a move that could lead to one being caught up in a sudden retracement.

XRP’s Direction from Here

Notably, the recent disclosure came on the back of an analysis from the market watcher, in which he suggested that XRP could move in two ways from its level at the time. During his analysis, XRP traded for $2.17, changing hands at a delicate position just above $2.

Mr. Xoom suggested that from that level, the asset could first drop further toward the $1.9 to $2 zone to grab further liquidity due to the buy orders in this area. After grabbing liquidity, XRP would then proceed with a recovery push.

However, according to Xoom, if the asset does not take this route, it could consolidate at the level above $2 for some time before embarking on an upward push. Mr. Xoom leaned toward this scenario, and it appears it is now playing out. 

Currently trading for $2.44, XRP is up 4.3% in the past week, making it the second-largest gainer among the top 10 in this timeframe, only behind Tron (TRX), which is up 4.9% in the same period.
Analyst Says Nothing Exciting for XRP Until $3.3 is Broken

0

A market analyst has suggested that the XRP price will remain in a range-bound market until it breaks through the key resistance level. 

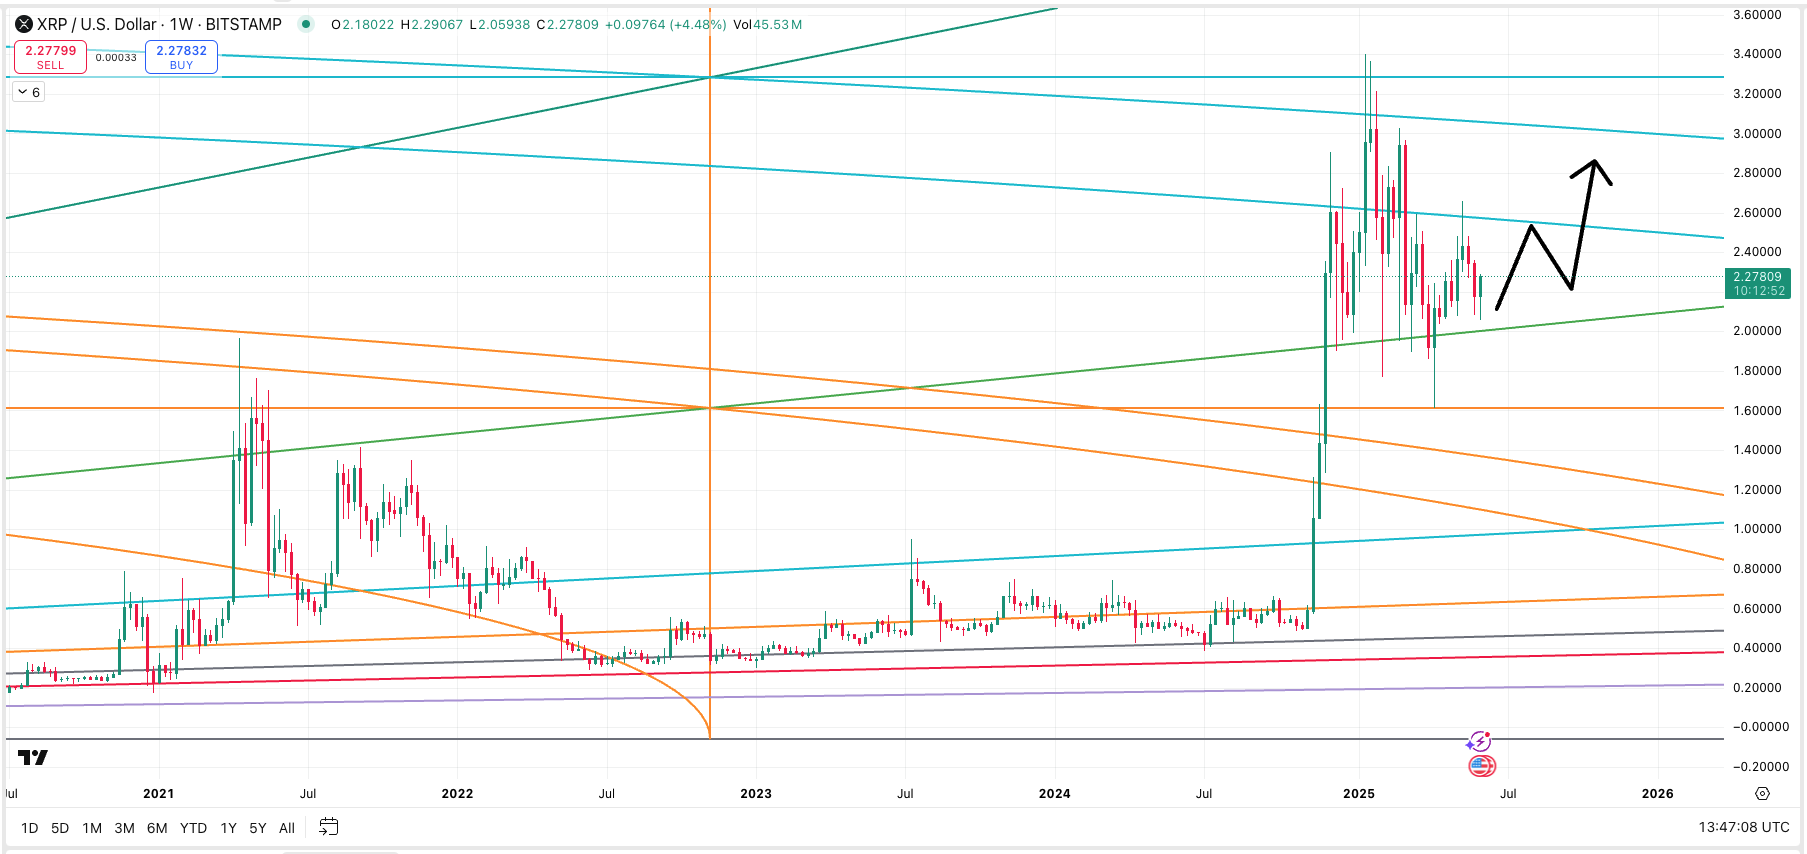
Despite some recent price movements, XRP is showing signs of consolidation between $2.00 and $2.50. This range-bound phase has been a key feature of XRP’s price action for the past several months, as it continues to face significant resistance.

XRP Price Action Consolidates Between $2.00 and $2.50

XRP price has experienced a consolidation phase that has kept its price within the $2.00 to $2.50 range for an extended period. This has been evident in the price action since mid-2023, with the asset finding support near the $2.00 level and resistance at $2.50. 

According to The Great Mattsby’s weekly chart, the inability to break above $2.50 suggests that there is a strong ceiling in place, limiting any significant upward movement.

Image

Support at $2.00 has been particularly important, as it has provided a solid foundation for price bounces. If XRP fails to maintain this support, it could revisit the $1.50 level, where a deeper retracement may occur. 

Resistance at $3.30 Remains a Key Barrier

Meanwhile, the resistance level at $3.30 has been a critical point for XRP since January. The price surged to this level before experiencing a sharp decline, and it has since struggled to break above it.

This level is seen as a strong psychological barrier, and breaking through it would likely signal the beginning of a new bullish phase for XRP. However, recent attempts to move above $2.50 have failed to gain enough momentum to test the $3.30 resistance. 

Gann Angles and Support Levels

Interestingly, Gann analysis has provided further insight into the current price action. The green Gann angle at $2.00 on the analyst’s chart has acted as an important support level, providing a cushion against further downside. 

As long as XRP remains above this level, it is expected to have the potential for upward movement. However, analysts caution that a break below this support could trigger a more bearish outlook, with a possible retracement to $1.50 or lower.

On the upside, the orange Gann lines suggest that XRP has significant room to move within the current range, but without breaking the $3.30 resistance, the cryptocurrency is unlikely to experience substantial gains.

The price could continue to test the $2.50 resistance before encountering further rejection. As long as the $3.30 resistance holds, XRP is expected to remain in a range-bound market, with no significant breakthroughs in sight.

Further Bullish Prospect

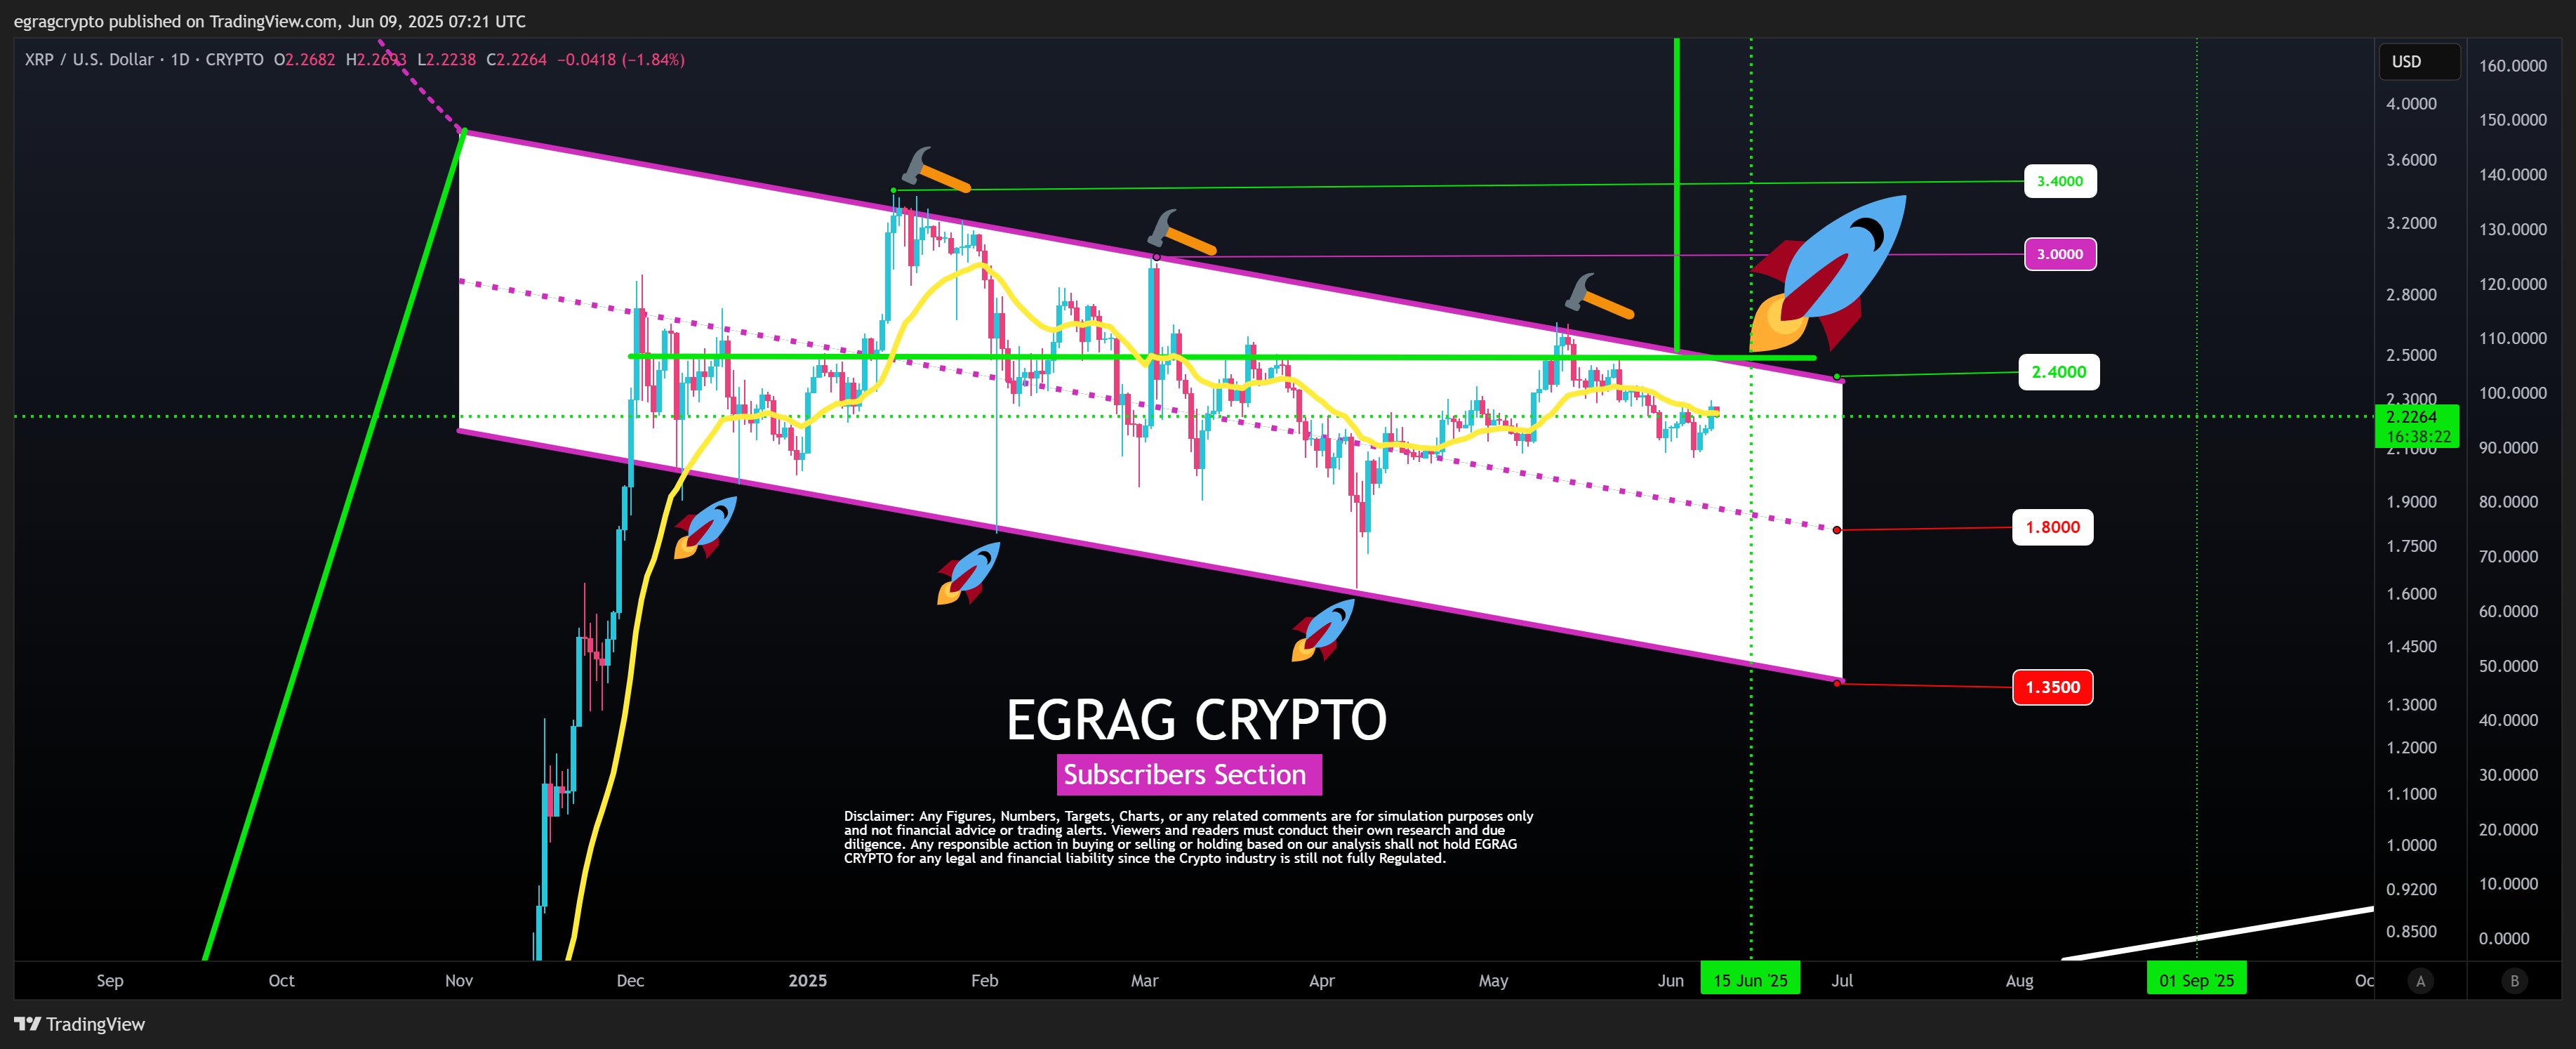
Moreover, according to Egrag Crypto, an intriguing pattern of “3 Hammers and 3 Rockets” in XRP’s recent price action is visible. This pattern suggests that the XRP price may be nearing the end of its consolidation phase. The “3 Hammers” refer to significant price lows, followed by the “3 Rockets,” which represent bullish movements.

Image

Egrag has predicted that XRP is likely to break out by mid-June 2025, with the rally potentially extending into August or September 2025. The breakout could mark the final phase of XRP’s current bull run, driving the price higher. 

Per his analysis, the descending channel within which XRP has been trading points toward the likelihood of either a breakout or a continuation of the current pattern, with a lower low possible if the breakout does not occur.

Did XRP Market Cap Surge 647x from Just $17M in Netflow? Here’s What We Know

As XRP recovers from last week’s dip, analysts are examining the significance of the small inflow that pushed XRP’s price back up.

Notably, XRP dropped to $2.0647 last week, marking a 9.4% dip from the $2.281 it traded at earlier in the week. The dip coincided with the feud between billionaire Elon Musk and U.S. President Donald Trump, which led to a massive decline in Tesla’s stock. The controversy spilled into the crypto space due to both individuals’ associations with cryptocurrencies.

Meanwhile, at press time, XRP is trading at $2.23, having fully recovered from last week’s dip. Now, market watchers within the XRP community are tracking the inflows that preceded this rebound.

XRP Records $18.6M Netflow, Price Jumps

Community figure Chad Steingraber highlighted the inflow metric in a tweet. He noted that XRP bounced from $2.08 to $2.17 on June 6 following a net inflow of just $18.6 million. Notably, this move added $10 billion to its full market cap. The inflow-to-market cap multiplier is approximately 538x, meaning every $1 of net inflow increased XRP’s market cap by about $538.

Commenting on this, XRP influencer Zach Rector stated that the figures show it takes very little inflow to push XRP’s price significantly higher. He added that market participants might regret not buying XRP at $2 if price surges become consistent due to further inflows.

647x Growth Multiplier

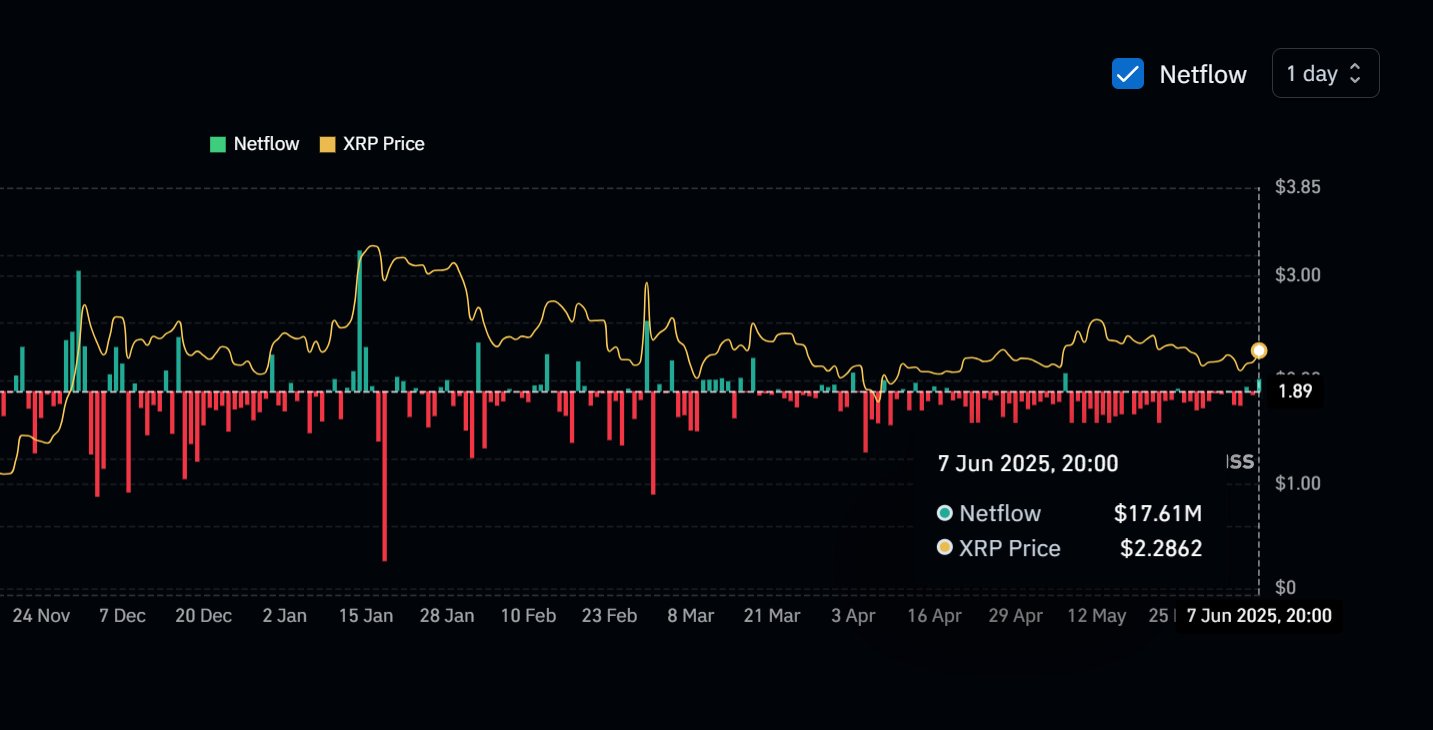
However, in a follow-up post on June 8, Steingraber pointed out that XRP soared from $2.17 to $2.28 on just $17 million in net inflows. This translates to an $11 billion increase in XRP’s market cap, based on the full 100 billion supply, on June 7.

Here, the multiplier is approximately 647x, meaning every $1 of net inflow increased XRP’s market cap by about $647 during that move.

Image

However, XRP ended the same day with a negative netflow of $5.88 million, indicating an outflow. As a result, the price retraced, closing at $2.17. The following day, XRP saw a small net inflow of $41,500, and the price closed at $2.267. As of press time, net inflow into XRP is negative $5.45 million, with the price at $2.23.

Based on this multiplier metric, community member Tomasz Wilkosz argued that XRP could potentially reach $8.64 if it were to see a $1 billion investment.

Eyes on ETFs to Drive Prices

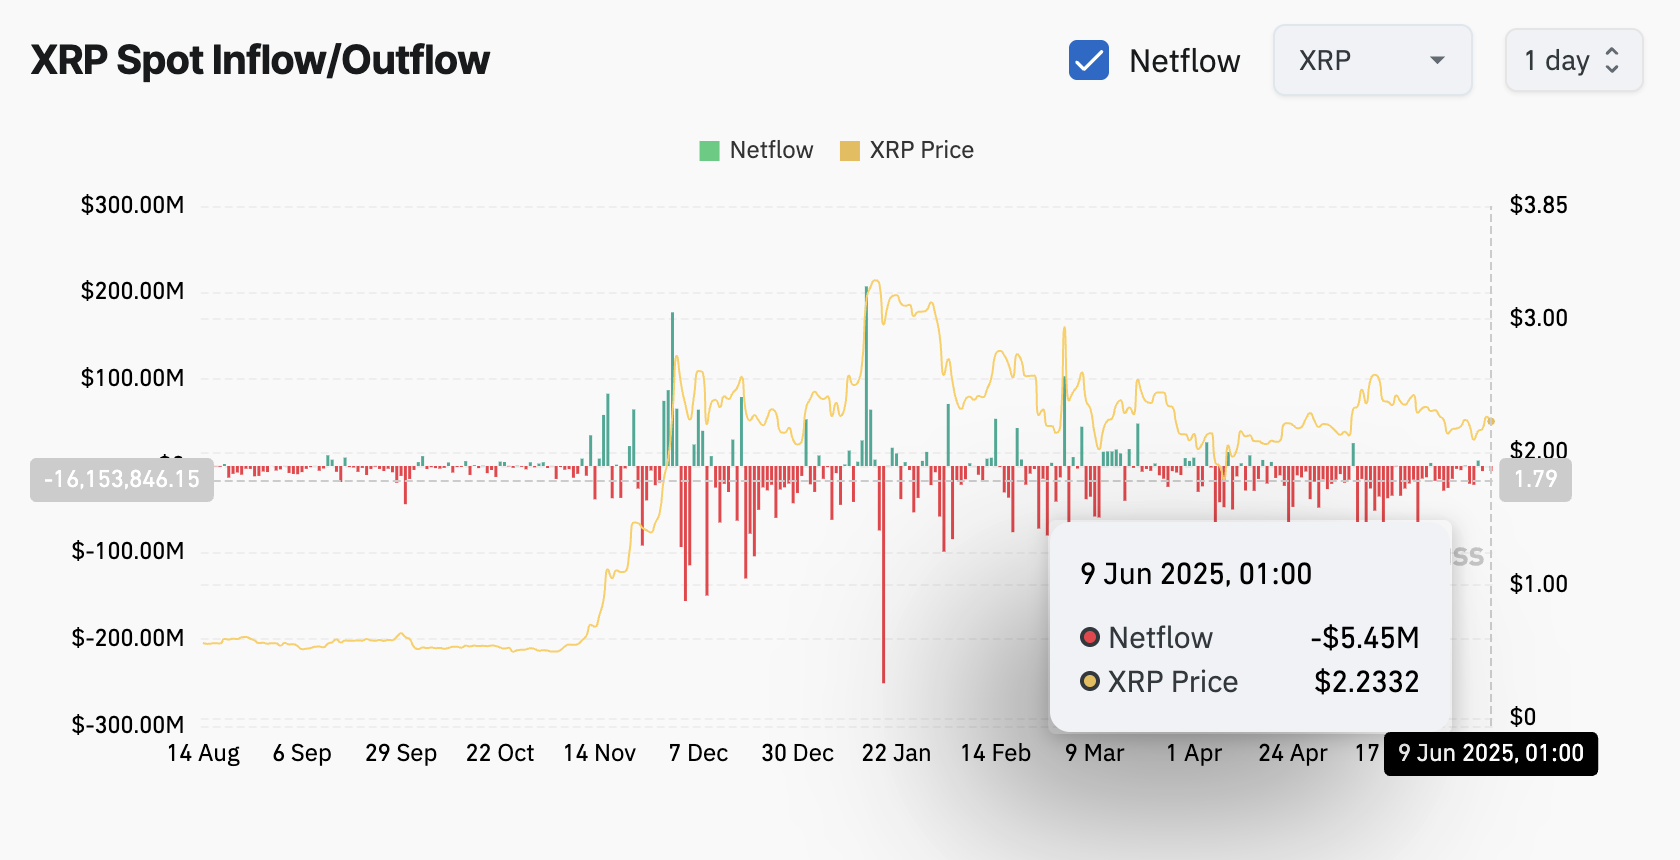
It’s worth noting that in recent months, larger negative flows have dominated XRP’s market. This could help explain XRP’s relatively flat price performance over the past six months. 

In contrast, December and January saw record-high inflows that corresponded closely with price increases. For example, on January 15, 2025, XRP recorded a $207 million positive netflow, and the price climbed above $3.20 at the time.

Chart showing outflows dominating XRP market cap | CoinGlass

These metrics highlight how inflows can directly impact XRP’s price, but sustained inflows have been challenging. As a result, all eyes are on XRP spot ETFs, which would require issuers to purchase and hold XRP as underlying assets.

As seen with Bitcoin ETFs, such products experience daily positive or negative flows. Using similar multiplier effects, some speculate that even $4 billion in ETF-related inflows could push XRP to $2

Clarification

While the netflow figures referenced in this report have sparked significant interest, it’s important to note that they primarily reflect deposits and withdrawals from exchanges. They do not reflect actual capital entering or exiting the XRP market.

True market inflows would require analyzing buy-side volume on exchange order books. As highlighted in a prior report, even a $500 million withdrawal from Kraken in May had no price impact. In other words, exchange outflows alone don’t confirm buying activity.

Dogecoin Eyes $0.20 as Falling Wedge Pattern Tightens

Dogecoin trades within a falling wedge pattern, with key resistance at $0.20.

While technical indicators remain bullish, rising liquidations and declining open interest suggest growing market caution. As major cryptocurrencies like Bitcoin and Ethereum remain uncertain, Dogecoin’s technical outlook hints at a potential breakout rally.

Can DOGE rally to reach the $0.20 psychological level in an attempt to recover from Thursday’s crash?

Dogecoin Price Analysis

On the 4-hour chart, Dogecoin is forming a falling wedge pattern amid its recent downtrend. Currently, DOGE is trading near the upper boundary of the pattern, with lower support at $0.1795.

Dogecoin price chart

Despite bullish efforts, Dogecoin is down nearly 1% today, raising the risk of a potential decline within the wedge pattern. However, technical indicators such as the RSI and MACD remain optimistic, as DOGE holds onto its weekly gains.

The RSI, currently at 44, hovers near the midpoint after bouncing from the oversold region. Meanwhile, the MACD and signal lines are trending positively toward the zero line.

That said, the MACD also warns of a potential bearish crossover as the price consolidates further.

Based on price action, a breakout above the wedge’s upper boundary could challenge the $0.20 psychological resistance, followed by the $0.22 supply zone.

Conversely, a close below the $0.1795 support on the 4-hour chart could drive Dogecoin toward the $0.1641 level.

Optimism Drops in Dogecoin Derivatives 

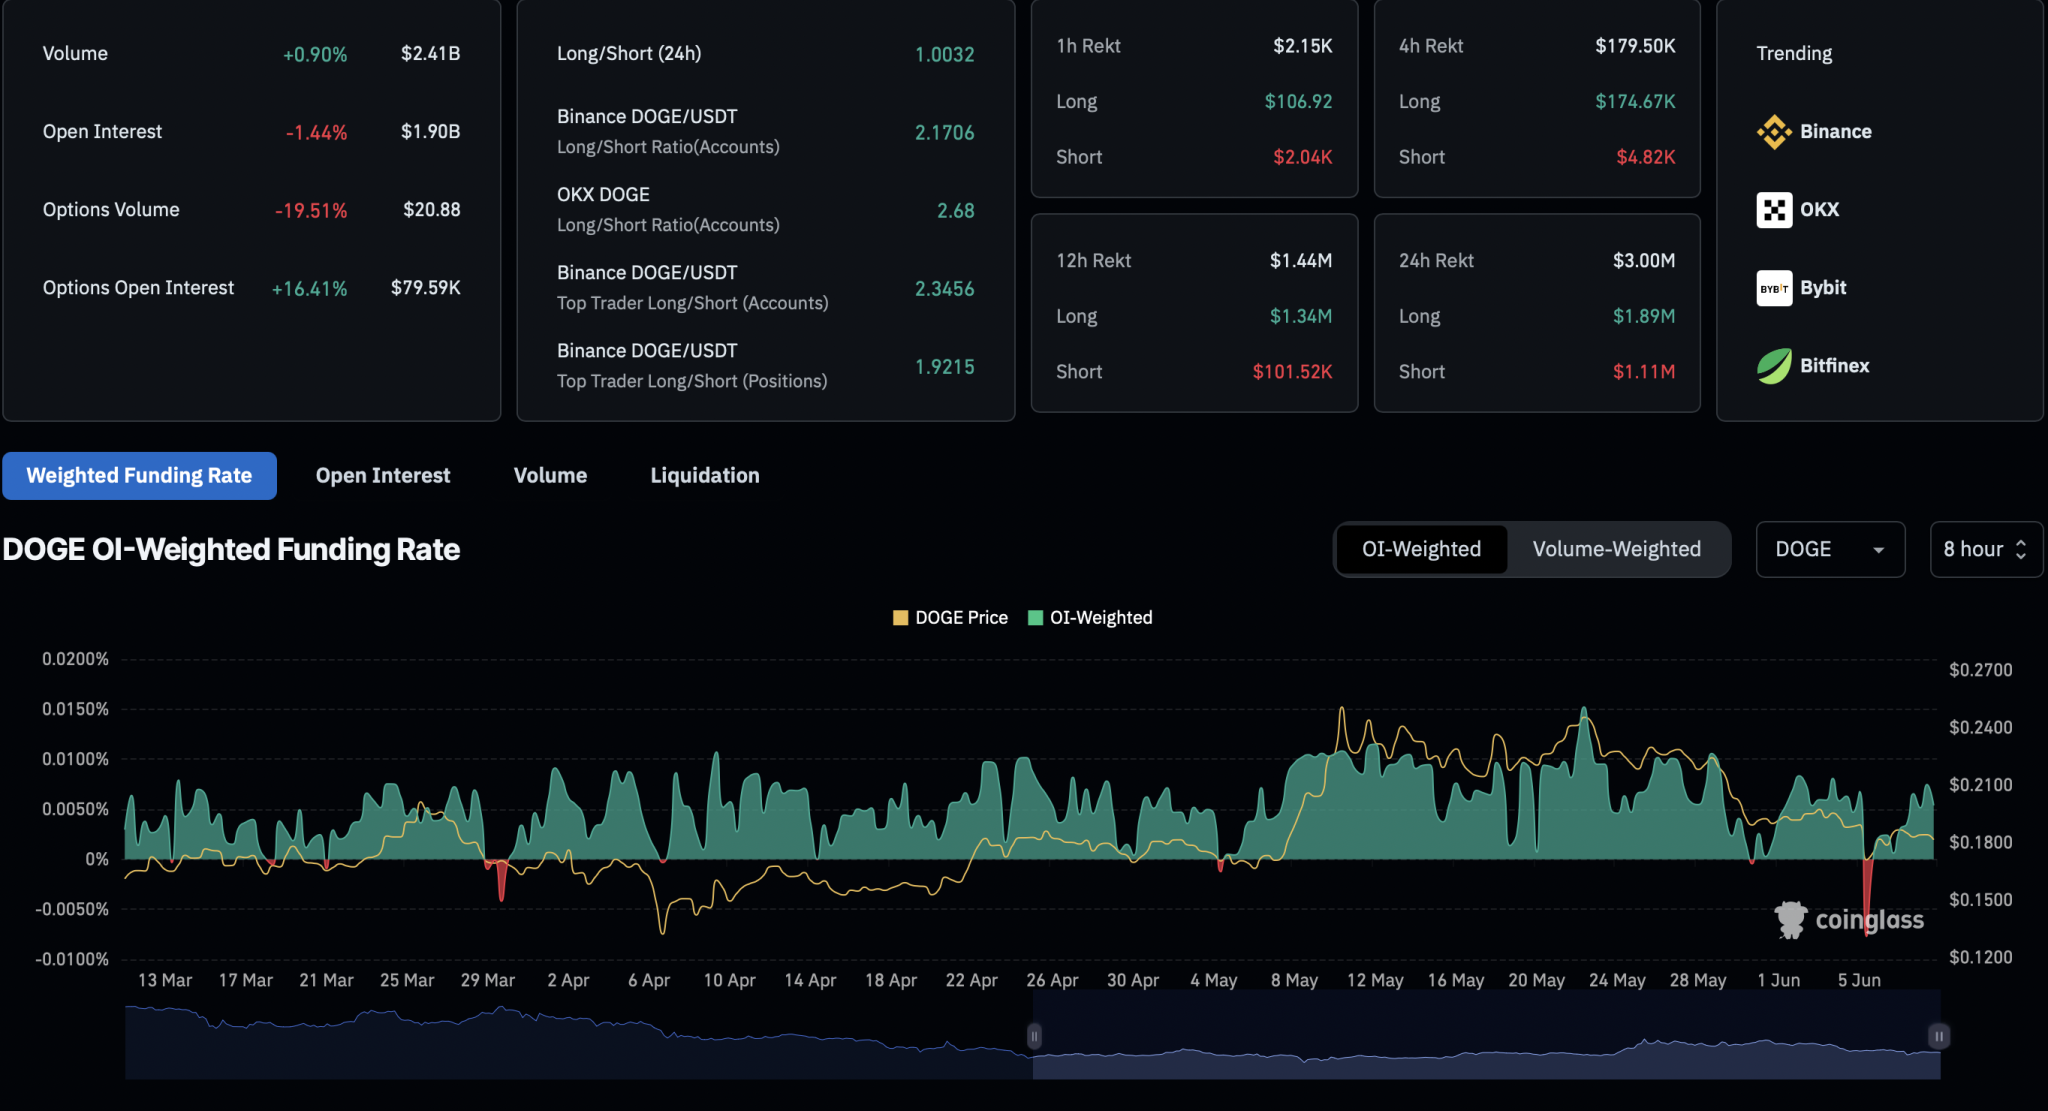
As Dogecoin sits at a critical juncture, optimism appears to be fading in the derivatives market. According to CoinGlass, open interest has declined by 1.44%, falling to $1.90 billion.

DOGE Derivatives 
DOGE Derivatives

Additionally, 24-hour liquidations have surged to $3 million, with long positions accounting for $1.89 million, indicating that more bullish traders were liquidated amid recent volatility.

Bullish sentiment continues to decline, as the OI-weighted funding rate has dropped to 0.0054%, down from a peak of 0.0075% in the past 8 hours.

However, the long-to-short ratio remains balanced at 1.0032 over the past 24 hours, signaling an equal number of bullish and bearish positions.

Will Ethereum Recover or Crash to $2K? Indicators to Watch

Ethereum has dropped below $2,500 amid rising bearish momentum. With long liquidations surging and the RSI weakening, ETH risks falling toward the $2,000 mark.

As Bitcoin risks losing the $105,000 level, Ethereum has dipped below $2,500. Facing a steeper correction and growing downside risk, can Ethereum hold above the 200-day EMA, or will it slide to $2,019?

Ethereum Price Analysis

On the daily chart, Ethereum remains in a sideways trend despite a more than 7% drop on Thursday. Following a short-term recovery, Ethereum is holding above the 38.2% Fibonacci retracement level near $2,400.

Ethereum Price Chart

With this brief rebound, Ethereum has moved back above the 200-day EMA at $2,461. However, with an intraday pullback of nearly 1% after Sunday’s Doji candle, ETH signals a possible decline toward the 38.2% Fibonacci level.

The RSI indicator suggests a bearish end to the consolidation phase, as the RSI line trends downward toward the midpoint. A bearish divergence is also emerging, indicating a gradual increase in bearish pressure and heightened downside risk.

According to Fibonacci levels, a daily close below the 38.2% retracement could lead ETH toward the psychological $2,000 level, just below the 23.6% Fibonacci level.

However, intermediate support from the 50-day and 100-day EMA lines at $2,357 and $2,319 may serve as key defenses. On the bullish side, any potential reversal would likely face resistance at the 50% Fibonacci level, around $2,699.

Long Liquidations Hit $26 Million

With the intraday pullback, sellers are gaining the upper hand in Ethereum derivatives. Over the past 24 hours, long liquidations surged to $26.89 million, while short liquidations were at $9.16 million.

ETH Derivatives
ETH Derivatives

Following this wipeout of bullish positions, the long-to-short ratio now stands at 0.97, indicating a higher number of short positions. In response, open interest has declined by 0.61% to $34.42 billion, reflecting reduced trader participation.

Bullish sentiment has also cooled, as the OI-weighted funding rate dropped from 0.0070% to 0.0026%. These metrics from CoinGlass underscore bearish dominance in Ethereum derivatives.

Institutions Expand Ethereum Holdings

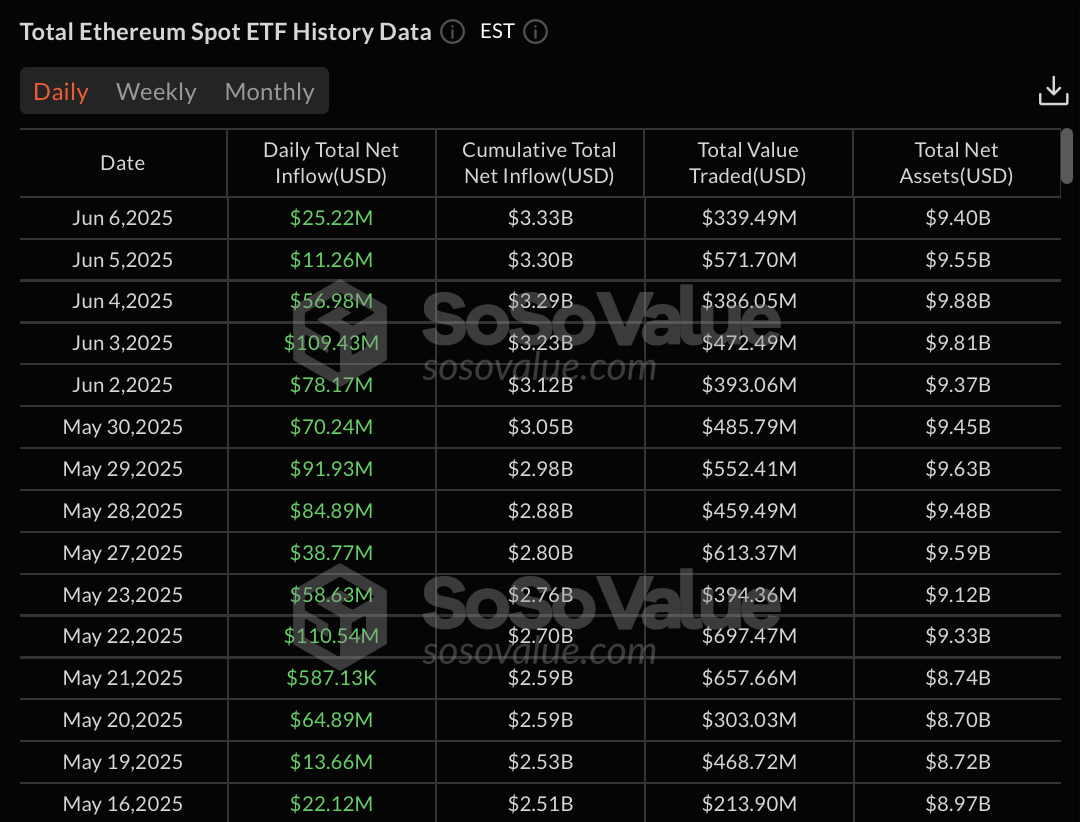
Despite retail traders showing weakness in the derivatives market, institutional support for Ethereum remains strong. ETFs appear to be rotating capital from Bitcoin ETFs into Ethereum.

U.S. spot Ethereum ETFs have recorded 15 consecutive days of inflows, totaling over $837 million. On June 6, the net daily inflow reached $25.22 million, led by $15.86 million from BlackRock and $9.37 million from Grayscale.

ETH ETFs Flow
ETH ETFs Flow

Bitcoin V-Shaped Recovery at Risk: Will BTC Dip to $102K or Pump to $112K?

Bitcoin rebounded to $105K but faces resistance at $106K. With rising institutional outflows and weakening momentum, BTC is at risk of a deeper correction.

Following a sudden recovery over the weekend, Bitcoin reclaimed the $105,000 level. However, the intraday pullback and failure to hold above $106,000 signal a potential steeper correction. The risk compounds when considering that top U.S. and Chinese officials are meeting in London to discuss tariffs.

Bitcoin Price Analysis

In the 4-hour time frame, BTC shows a bullish V-shaped recovery from the $101,763 support level. The recovery rally peaked just above $106,000 before pulling back intraday by nearly 0.5%.

Currently, BTC is trading at $105,457, with three consecutive bearish candles on the 4-hour chart, testing the 100-period exponential moving average (EMA).

Bitcoin price chart
Bitcoin price chart

Standing on fragile ground, BTC’s decline suggests a potential close below both the 50 and 100 EMA lines, as well as the crucial $105,000 support level. Supporting the downside risk, the 4-hour RSI is pulling back toward the midpoint, signaling weakening bullish momentum.

According to Fibonacci levels, immediate support lies at $102,400, corresponding to the 50% retracement level. The 200-period EMA at $103,574 could serve as intermediate support.

On the bullish side, immediate resistance is at the 23.60% Fibonacci level at $107,256, followed by the all-time high resistance at $111,980.

ETF Outflows Surge Amid Weak Institutional Support

Amid growing uncertainty in the cryptocurrency market, institutional support for Bitcoin declined at the end of last week. Weekly outflows totaled $128 million, following a $157 million outflow the previous week, highlighting short-term weakness in institutional backing for Bitcoin.

BTC ETFs Flow
BTC ETFs Flow

Optimism Drops in Bitcoin’s Derivatives Market

The short-term pullback has significantly dampened optimism in the derivatives market. Open interest has fallen by nearly 1% to $71.05 billion, while the OI-weighted funding rate has flipped negative to -0.0056%. 

BTC Derivatives
BTC Derivatives

Meanwhile, the long-to-short ratio remains relatively optimistic at 1.044, indicating a higher number of bullish positions. However, long liquidations over the past 24 hours rose to $7.49 million, though still less than short liquidations, which reached $13.37 million.

Nations Might Come to Hold More Bitcoin than Gold Over time: Coinbase CEO Brian Armstrong

0

Coinbase CEO Brian Armstrong believes Bitcoin is better than gold in several respects, predicting that nations will hold more of the premier crypto asset over time.

The Bitcoin vs. gold debate continues. Conversations about which is better between the physical and “digital gold” are now commonplace among global financial market analysts and investors.

A clip of Coinbase CEO Brian Armstrong’s thoughts on the hot debate is trending again on crypto Twitter. In the clip, he stressed Bitcoin’s superiority over the prominent traditional financial asset class.

Bitcoin: A Better Form of Money Than Gold

For context, the video is a clip of Armstrong’s response to a question from South Africa’s Lesetja Kganyago at the World Economic Forum conference in January. The Bitcoin critic questioned why governments would create strategic reserves of an asset without intrinsic value.

In response, Armstrong emphasized Bitcoin’s massive utility and its superior properties compared to gold. For perspective, he noted that while gold shares the same scarce nature as Bitcoin, the digital asset is a better form of money.

The Coinbase CEO cited Bitcoin’s better divisibility and portability as a major advantage over gold. Furthermore, he noted that the digital asset has more utility than its physical counterpart. Notably, its rapid transactional acumen and application in the growing digital payment system trounce gold’s physical and difficult-to-move nature.

Meanwhile, Armstrong also highlighted Bitcoin’s price performance, which surpasses that of gold. He noted that the largest cryptocurrency by market capitalization has been the best-performing asset of the last decade, outperforming most traditional asset classes.

For perspective, Bitcoin has increased nearly 34,000% over the last ten years. On the other hand, gold has grown 181% during the same timeframe.

Governments Would Hold More Bitcoin Soon

Furthermore, Armstrong advocated that nations quickly adopt Bitcoin. Interestingly, he suggested that governments would create a strategic reserve strategy for Bitcoin, which would soon reach or surpass their stash of gold.

“It (Bitcoin) might start with being 1% of their reserve, but I think over time it would come to be equal to or greater than gold reserves,” Armstrong said.

Interestingly, nations are beginning to adopt Bitcoin. Pakistan recently announced it would create a strategic Bitcoin reserve, inspired by the United States. Recall that, spurred by pro-Bitcoin President Donald Trump, America established a national reserve for the crypto leader.

Other nations like El Salvador, Bhutan, and China also hold a substantial amount of Bitcoin. Data from BitcoinTreasuries shows that 12 countries hold Bitcoin, with their combined stash amounting to 527,764 BTC ($55.7 billion).

Gold-holding companies are also switching their allegiance. UK-based gold mining firm Bluebird recently announced it would invest some of its revenue into a Bitcoin reserve.

Here is Next Shiba Inu Target if Bitcoin Holds Above $100K

0

An analyst has projected the next resistance level for Shiba Inu in a scenario where Bitcoin maintains its price above the psychological $100,000 level.

Shiba Inu’s price spiked notably on June 3, reaching $0.0000134 before steadily declining. As of today, it has fallen to approximately $0.0000124. Amid this volatility, recent analysis shows that SHIB’s price movement remains within a longer-term bearish trend. 

Shiba Inu Facing Resistance at Key Trendline

A TradingView analysis by MMBTtrader shows that Shiba Inu’s price remains under significant bearish pressure due to a descending trendline. Notably, this trendline has acted as consistent resistance since early 2024.

Screenshot 2025 06 09T122201516
Shiba Inu Price Prediction

After the asset dropped from $0.000045, this trendline has rejected rally attempts, preventing SHIB from establishing higher highs. Most recently, SHIB attempted to surpass the resistance around $0.000033 but failed, retracing to a local support zone at $0.000010083.

The technical analysis suggests that SHIB’s price must break above this dynamic resistance to initiate a sustained bullish rally. A breakout above the trendline, now around $0.00002013, could lead to larger bullish candles. 

Bitcoin Price Action Could Support SHIB Movement

According to the analyst, Shiba Inu could experience a pump from daily support levels around $0.000010 and $0.000007. The initial target for this potential move is $0.000020, representing an approximately 80% increase from current levels.

However, this potential rally is contingent on broader market conditions, particularly Bitcoin (BTC). The analyst stressed that if Bitcoin maintains its position above the $100,000 threshold, it could provide the necessary momentum for a bullish reversal in SHIB’s price.

At press time, Bitcoin is trading at above $105,000.

Rising Address Activity Signals Potential for Growth

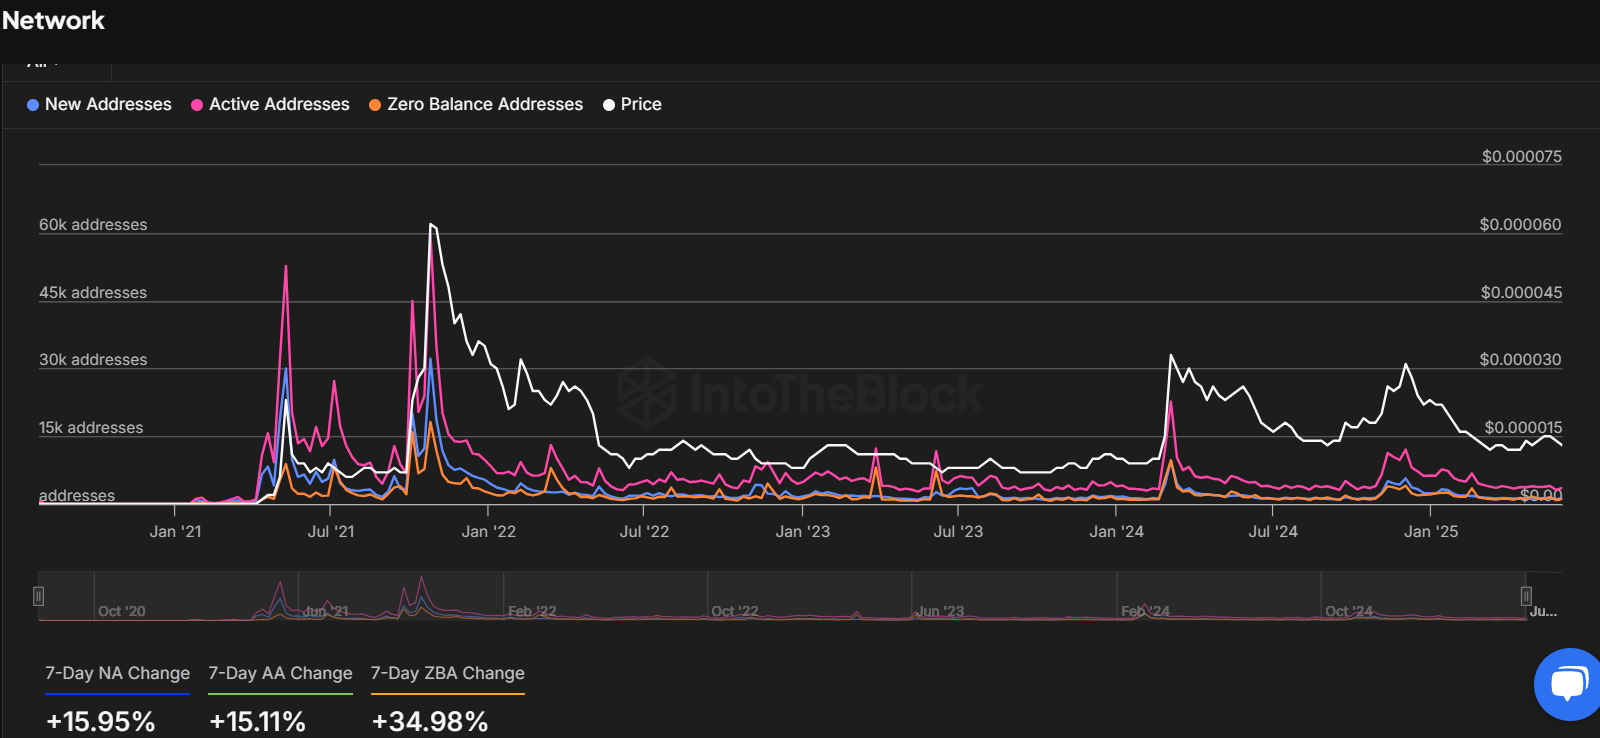
In parallel with price movement, address activity on the Shiba Inu network has shown encouraging signs. Recent 7-day changes indicate a surge in engagement, with new addresses increasing by 15.95%, active addresses rising by 15.11%, and zero balance addresses growing by 34.98%. 

Screenshot 2025 06 09T115304078
Shiba Inu Daily Active Addresses

This uptick in activity suggests greater adoption and network participation, which are positive indicators for long-term price movement. If this trend continues, it could drive more adoption and transaction volume.

SHIB Price Forecast for 2026, 2035, and 2040

Elsewhere, forecasts for Shiba Inu’s price in the coming years show a range of predictions. A ChatGPT-backed analysis anticipates steady growth due to regular token burns and stronger demand in the broader crypto market.

By 2026, SHIB could reach $0.000045. Looking further ahead, ChatGPT projects that by 2035, SHIB could climb to $0.00038. If the project sees widespread use as a digital payment option and successfully reduces its supply, it may hit $0.0031 by 2050.

Meanwhile, Google Gemini offers a similar outlook for the short term, with a price target of $0.000045 by 2026. However, Gemini is more bullish in its long-term predictions, forecasting SHIB to reach $0.00085 by 2035. For 2050, Gemini’s most ambitious projection places the price at $0.047.

Cardano Founder Predicts Timeline for Bitcoin to Hit $1 Million

0

Charles Hoskinson, the founder of Cardano, recently reiterated his prediction for Bitcoin price and provided a bold timeline for realization.

In an interview hosted by Bitcoin Magazine, Hoskinson highlighted key technological advancements and institutional involvement in driving Bitcoin’s growth. He particularly cited the recent focus on integrating Bitcoin within decentralized finance (DeFi). 

His remarks come as other prominent figures, such as Cathie Wood of Ark Invest, have also expressed their optimistic outlook for Bitcoin’s future.

Bitcoin’s DeFi Future 

Hoskinson emphasized Bitcoin’s growing significance in the DeFi space, largely due to its upgrade via Taproot, which enables greater programmability. He explained that Cardano’s close technological alignment with Bitcoin, particularly through its extended UTXO model, positions it as a key player in Bitcoin’s future DeFi ecosystem. 

Hoskinson noted that Cardano’s proof-of-stake consensus is based on Bitcoin’s proof-of-work design, but it also offers unique advantages over Ethereum’s proof-of-stake. This alignment allows Bitcoin users to interact with the Cardano network while retaining their Bitcoin holdings for transaction fees and yield, setting it apart from other blockchain ecosystems.

Timeline for BTC to Hit $1M Amid Institutional Interest

Institutional involvement is another key factor driving Bitcoin’s growth. Hoskinson pointed out the increasing interest from major financial entities such as BlackRock and the U.S. government. Notably, BlackRock holds over 600,000 BTC tokens. 

He noted that as Fortune 500 companies start to adopt Bitcoin, the cryptocurrency’s value could rise significantly. Hoskinson predicts that Bitcoin could see a price increase of between $250,000 and $500,000 within the next two years.

He also predicted that Bitcoin could surge to $1 million by the end of the decade. To rise from its current price of $105,605 to $1,000,000, Bitcoin would need to increase by approximately 846.5%.

Cathie Wood’s Long-Term Forecast for Bitcoin

Meanwhile, other industry leaders like Ark Invest founder Cathie Wood also agree with Cardano’s bold outlook. Wood projected that Bitcoin could see a 15-fold increase in value over the next five years to as high as $2.4 million.

Her perspective aligns with the notion that Bitcoin has emerged as a new asset class, providing diversification for institutional portfolios. 

Wood believes that Bitcoin’s market potential is vast, as institutions continue to increase their exposure to the cryptocurrency, particularly following the approval of a Bitcoin spot ETF in 2024. This institutional surge could further bolster Bitcoin’s value, with Ark Invest predicting a price of $1.5 million by 2030 in a moderate case.

Bitcoin is currently $105,611, reflecting a 0.17% increase in the last 24 hours and a 30% rise over the past 90 days.

If XRP Secures Three Consecutive Closes Above This Level, a Major Surge May Follow: Analyst

0

Analyst predicts a strong move if XRP sees three consecutive daily closes above a key level, signaling potential for significant upward momentum.

As of press time, the XRP price was at $2.23, a 1.20% surge from the intraday low of $2.20. Amid the current price action, crypto analyst Egrag Crypto has identified a critical moment for XRP, with the key micro signal being just three daily closes above the $2.22 mark. Once this happens, the analyst suggests it could mark the beginning of a major upward move for XRP. 

Key Resistance to Watch

Per the analyst’s chart, XRP price has faced significant resistance in recent months, with a descending trendline serving as a key barrier. Despite a number of attempts, the price has failed to sustain a position above this level, leading to a period of consolidation.

In the past, XRP saw strong rallies, but each time it approached the trendline, the price action struggled to break through, signaling the presence of strong selling pressure.

XRP 3D Chart EGRAG Crypto
XRP 3D Chart | EGRAG Crypto

The current market trend has seen XRP experiencing a series of lower highs and lower lows. This suggests that the upward momentum has stalled, and the bears may be in control.

However, if XRP manages to close above $2.22, it would indicate a shift in market sentiment, as this level has proven to be a strong point of resistance in recent trading sessions.

Should this close occur, the next challenge for XRP will be to break through the $2.36 level, which could act as the first barrier after surpassing $2.22. If this level is overcome, the price may make its way towards the $2.50 and $2.65 levels, which are the next key resistance points. 

The analyst also identifies a higher target of $3.1, a 39.04% rise from the current price.

XRP Open Interest Jumps 6%

Meanwhile, the current market sentiment surrounding XRP shows some promising signs, particularly in terms of volume and open interest. XRP’s derivatives data has been improving, with derivatives volume rising by 138% and open interest climbing by 6%. 

Screenshot 2025 06 09T105604984
XRP Derivatives Data | Coinglass

This uptick in market activity suggests that traders are positioning themselves for a potential price movement. 

Additionally, the options volume has seen a notable increase of 20.48%, indicating that market participants are preparing for volatility.