Home Blog Page 715

XRP History of Bull Flags Since 2015 Suggests Largest Rally Is Yet to Come

0

Market analyst Dark Defender says XRP bull flags since 2015 signal a major breakout ahead, arguing that the market has not seen anything yet.

Notably, between May 21 and May 27, XRP’s price fluctuated within a narrow range, moving from about $2.33 to a high near $2.47. The asset experienced a notable mid-week drop, falling sharply from just below $2.45 to a low around $2.30. 

Following this decline, XRP attempted a rebound but settled at $2.31 by the end of the week. This price action highlights ongoing volatility within a broader consolidation phase.

Bull Flag Pattern Indicates Potential for Breakout

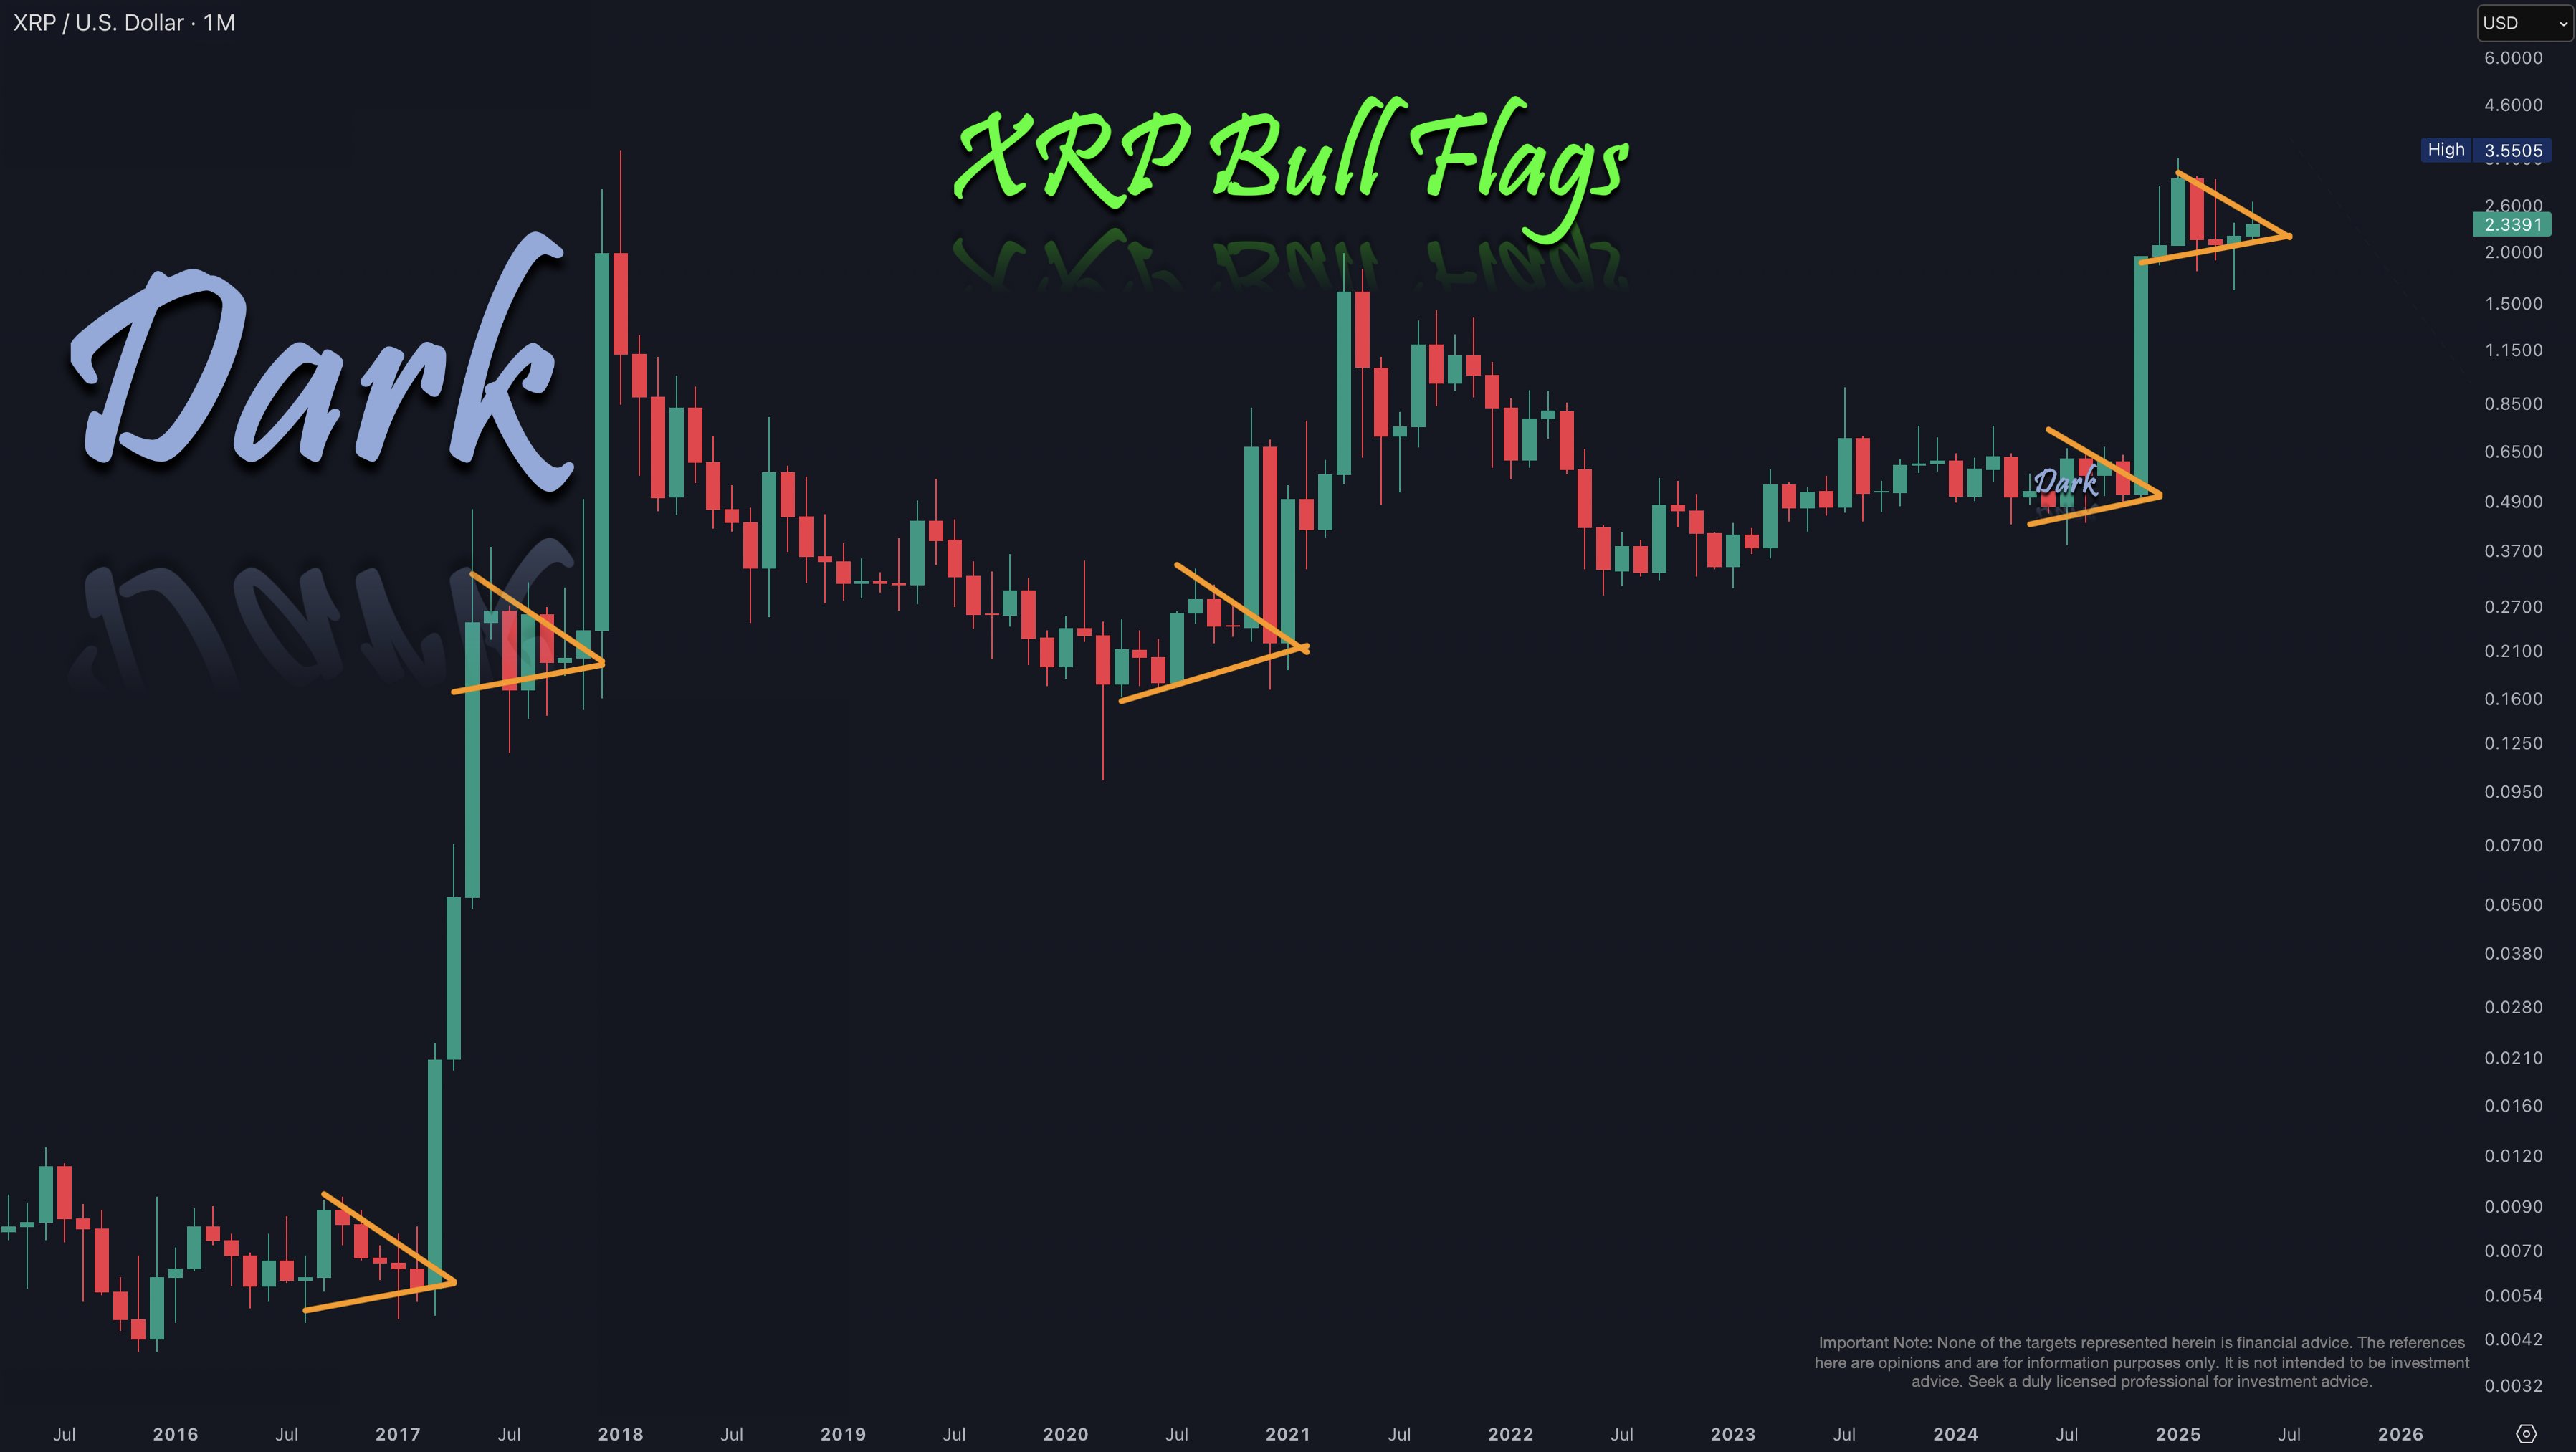
Amid the consolidation, renowned analyst Dark Defender recently highlighted a significant long-term technical pattern on XRP’s chart—a bull flag that has been developed several times since 2015.

The pattern begins with a strong upward price movement, known as the flagpole, followed by an extended period of consolidation resembling a downward or sideways-sloping flag. Notably, the pattern suggests a potential continuation of the upward trend once a breakout occurs.
Image

Historically, XRP formed its first major bull flag starting in 2017. At that time, the price consolidated near $0.0054 before surging above $0.2 to complete the flag formation. The breakout that followed propelled XRP to an all-time high of $3.5 in January 2018. After this, a prolonged consolidation phase confirmed the pattern through 2020.

XRP Gearing For Further Upside

More recently, XRP established a second flagpole after consolidating below $0.6 and then surging to $3.3 in January 2025. After this high, the bull flag formed and has persisted amid the ongoing consolidation. Although the breakout hasn’t happened yet, it suggests that XRP may be gearing up for a substantial upward surge. 

Dark Defender’s view indicates that XRP’s market potential remains largely untapped. This technical formation signals a buildup of momentum, often leading to rapid and significant price surges once resolved. Essentially, XRP could be gearing up for a move that many current investors have yet to experience.

Breakout Signs Emphasized by Analyst Poseidon

Meanwhile, market analyst Poseidon has shared insights into XRP’s price behavior amid ongoing consolidation. Data from Poseidon’s chart shows that XRP has traded primarily between $2 and $3 during this phase.

The $3 level has acted as resistance, while the $2 mark serves as support. XRP has occasionally pushed beyond these levels but faced swift price corrections that returned it to the range.

Poseidon identifies three technical signals supporting a possible bullish breakout: a failed breakdown below support, reclaiming the 200 Exponential Moving Average (EMA) on the 12-hour chart, and a recent higher high formed when XRP reached $2.36 on May 26.

Additionally, Poseidon points to a descending trendline restricting price action since the May 12 high of $2.6. For a confirmed breakout, XRP must surpass $2.4 to break this trendline.

If the breakout occurs, Poseidon’s price target is $4, which would require about a 73% increase from XRP’s current $2.31 level.

Expert Identifies XRP Support Level with Massive Liquidity, Plans to Buy with All His Cash If XRP Drops

0

An analyst has identified an XRP support level boasting deep liquidity, suggesting a drop to this mark could lead to massive buy pressure.

XRP’s price has retraced lately, with earlier bullish momentum temporarily losing steam. A few weeks back, the fourth-largest cryptocurrency by market cap was rejected at $2.65 and has failed to find its footing since then.

At the current price, XRP has retraced 13.5% from the three-month price high, with bearish trends mirroring a broader altcoin market underperformance. Meanwhile, a market expert has identified a price mark backed with strong liquidity that XRP may not trade below again.

Whales Place Large Buy Order at This Price

In a May 26 tweet, analyst “Cryptoinsightuk” shared XRP’s short-term liquidity heatmap on Binance, the largest crypto exchange by trading volume. The chart shows large volumes of buy and sell orders around different XRP lower timeframe price levels, indicating keen interest among market users in the asset.

However, a particular price mark stands out. The expert market watcher highlighted that the liquidity around the $2 mark is too deep, suggesting that whales see XRP at that price as a massive discount and a good buy opportunity.

Liquidity Heatmap on XRP/USDT on Binance/Cryptoinsightuk

Notably, Cryptoinsightuk envisions a massive price bounce if XRP ever reaches the $2 mark and revealed he will go all in if the market offers this price. In his words, he will back up the XRP truck at $2 with whatever cash he has left.

Liquidity at a price level suggests large buy orders around the area. If prices drop to an area of deep liquidity, these orders are filled, steering intense buying pressure and excessive demand, which will likely push XRP higher.

Cryptoinsightuk understands this narrative; hence, he revealed that he would massively stack XRP if it ever reaches $2 support. The deep liquidity would almost certainly ensure a quick rebound to higher prices, profiting those who bought around the price level.

Is $2 the New $0.5?

XRP’s price has failed to replicate the feat from November to January, when the asset skyrocketed 578% from around $0.5 to a seven-year high of $3.39. However, the crucial $2 support, a former resistance close to the level where XRP peaked in 2021, has proven solid each time XRP dumps to that level.

For perspective, XRP retraced to support in early and mid-December after a massive rejection at $2.90 but bounced from there at each instance. The $2 support again proved solid following the famous February 3 capsize and also provided solace for XRP during the several attempts between then and April, when bears pushed prices lower.

Interestingly, the rigidity of the $2 support has sparked speculations among the XRP community that the price mark could be the new $0.5, an area where the XRPL native token consolidated for years before the recent breakout.

For context, Edward Farina, the founder of Alpha Lions Academy, suggested in April that $2 could be the new $0.5, citing the support’s resilience in cushioning downward momentum. The strength of the support area also drew the attention of Francisco Almedia, who further championed the narrative that it has now become for XRP what $0.5 was a few months back.

This sentiment reflects in the massive liquidity seen at the price mark, as whales grow confident that XRP may never lose the $2 support again.

Meanwhile, analysts remain confident that XRP will shake off the recent sideways trend and rally to higher prices in the mid and long term. Speculations of an uptrend to $8, $10, and even $100 are on the cards, reflecting strong bullish sentiments around the asset.

At the time of writing, XRP trades at $2.30.

If You Bought Shiba Inu at $0.00001454, Here’s Your Profit if Price Hits $0.0001

0

With Shiba Inu projected to reach an ambitious target of $0.0001, individuals who invest in SHIB today could record significant gains if the prediction materializes. 

Shiba Inu prices have not moved significantly since May 24. During this period, SHIB hovered around the $0.000014 mark, sparking mixed reactions from community members. 

Many investors expressed disappointment with Shiba Inu’s recent performance, which has fallen short of their expectations of a bull cycle this year. Instead of a rally, Shiba Inu’s price has dipped by 31.1% year-to-date. 

However, others have capitalized on the dip to increase their Shiba Inu holdings. Although Shiba Inu has experienced a double-digit loss YTD, these proponents still believe SHIB is on track for a significant rally that could take its price to the highly anticipated $0.0001 mark. 

Based on this projection, The Crypto Basic estimates the potential returns for individuals who invest $1,000, $5,000, or $10,000 in SHIB today, assuming the coin ultimately rallies to $0.0001.

How Much $1K, $5K, or $10K Investment in SHIB Will Be Worth at $0.0001 

Shiba Inu was trading at $0.00001454 in the hours leading up to press time. At its current price, $1,000 invested in Shiba Inu can procure 68.77 million SHIB tokens. However, individuals who invest $5,000 or $10,000 in Shiba Inu today would acquire 343.87 million SHIB or 687.75 million tokens. 

These investments in Shiba Inu could bring substantial returns for early investors if SHIB’s price skyrockets to $0.0001. 

Notably, this 68.77 million SHIB portfolio, currently worth $1,000, would be valued at $6,877 if the $0.0001 prediction plays out, representing a return of $5,877. 

Similarly, a holding of 343.87 million tokens, valued at $5,000 at press time, would be worth $34,387. This translates to a return of $29,387 for early investors. 

Moreover, a $10,000 investment in SHIB today, equivalent to roughly 687.75 million tokens, would be worth $68,775 if the price reaches $0.0001, representing a return of around $59,000. 

Can SHIB Reach $0.0001? 

There is a growing consensus within the Shiba Inu community that the $0.0001 price is a realistic target. Notably, most enthusiasts believe Shiba Inu will achieve the milestone in this bull cycle.

As reported earlier, popular community expert Oscar Ramos expressed confidence in the $0.0001 prediction, declaring that the forecast would eventually materialize. 

Gem Sheriff, another famous analyst in the community, also suggested that SHIB is capable of clinching the target. According to his analysis, the price of Shiba Inu would surge beyond the $0.0001 mark to a lofty height of $0.00011. 

While most experts believe the $0.0001 target will be reached by this bull season, Changelly analysts indicate that this prediction will take longer to materialize. According to them, SHIB will hit $0.0001 by June 2029. 

Shiba Inu 2029 Prediction l Changelly

For perspective, hitting the $0.0001 demands a surge of 587% from the current price. If the projection plays out, Shiba Inu’s valuation will skyrocket from $8.57 billion to $58.92 billion, assuming the circulating supply remains constant. 

SUI Bulls Defend $3.30 Zone: Is $6 Target Next?

SUI price holds above $3.30 amid a bullish wedge breakout. Derivatives data shows rising interest. Can SUI reach $4.63 or even $6 in the next leg up?

As the crypto market remained quiet on Tuesday, SUI witnessed a minor gain of 0.19%, maintaining dominance over the $3.30 demand zone. With SUI rejecting lower prices near the 50-day EMA and this demand zone, is a bullish reversal possible this week?

SUI Price Analysis

On the daily chart, SUI’s price action reflects a bullish effort to sustain a falling wedge breakout rally. The rally surpassed the 23.60% trend-based Fibonacci level at $3.30 but is struggling to maintain a higher-high trend.

SUI Price Chart
SUI Price Chart

After a secondary test of the $3.30 demand zone, SUI now tests the 50-day EMA at $3.38. The intraday candle shows a lower price rejection near the 24-hour low of $3.40, with the current market price at $3.57.

Short-term price action reflects a resistance trendline formed after rejection near $4.29. As SUI struggles to prolong its uptrend, the daily RSI indicates a loss of momentum.

The daily RSI has dropped below the midpoint of the overbought region, signaling weakening strength.

Despite this short-term struggle, a potential bounce from the 23.60% Fibonacci level could test the 38.20% level at $4.63 if SUI breaches the local support trendline.

The bullish trend may extend to the 50% Fibonacci level near the $6 psychological mark, aiming for a new all-time high. On the downside, the 200-day EMA near the $3 psychological level serves as crucial support in case of a breakdown.

Derivatives Traders Remain Hopeful on SUI

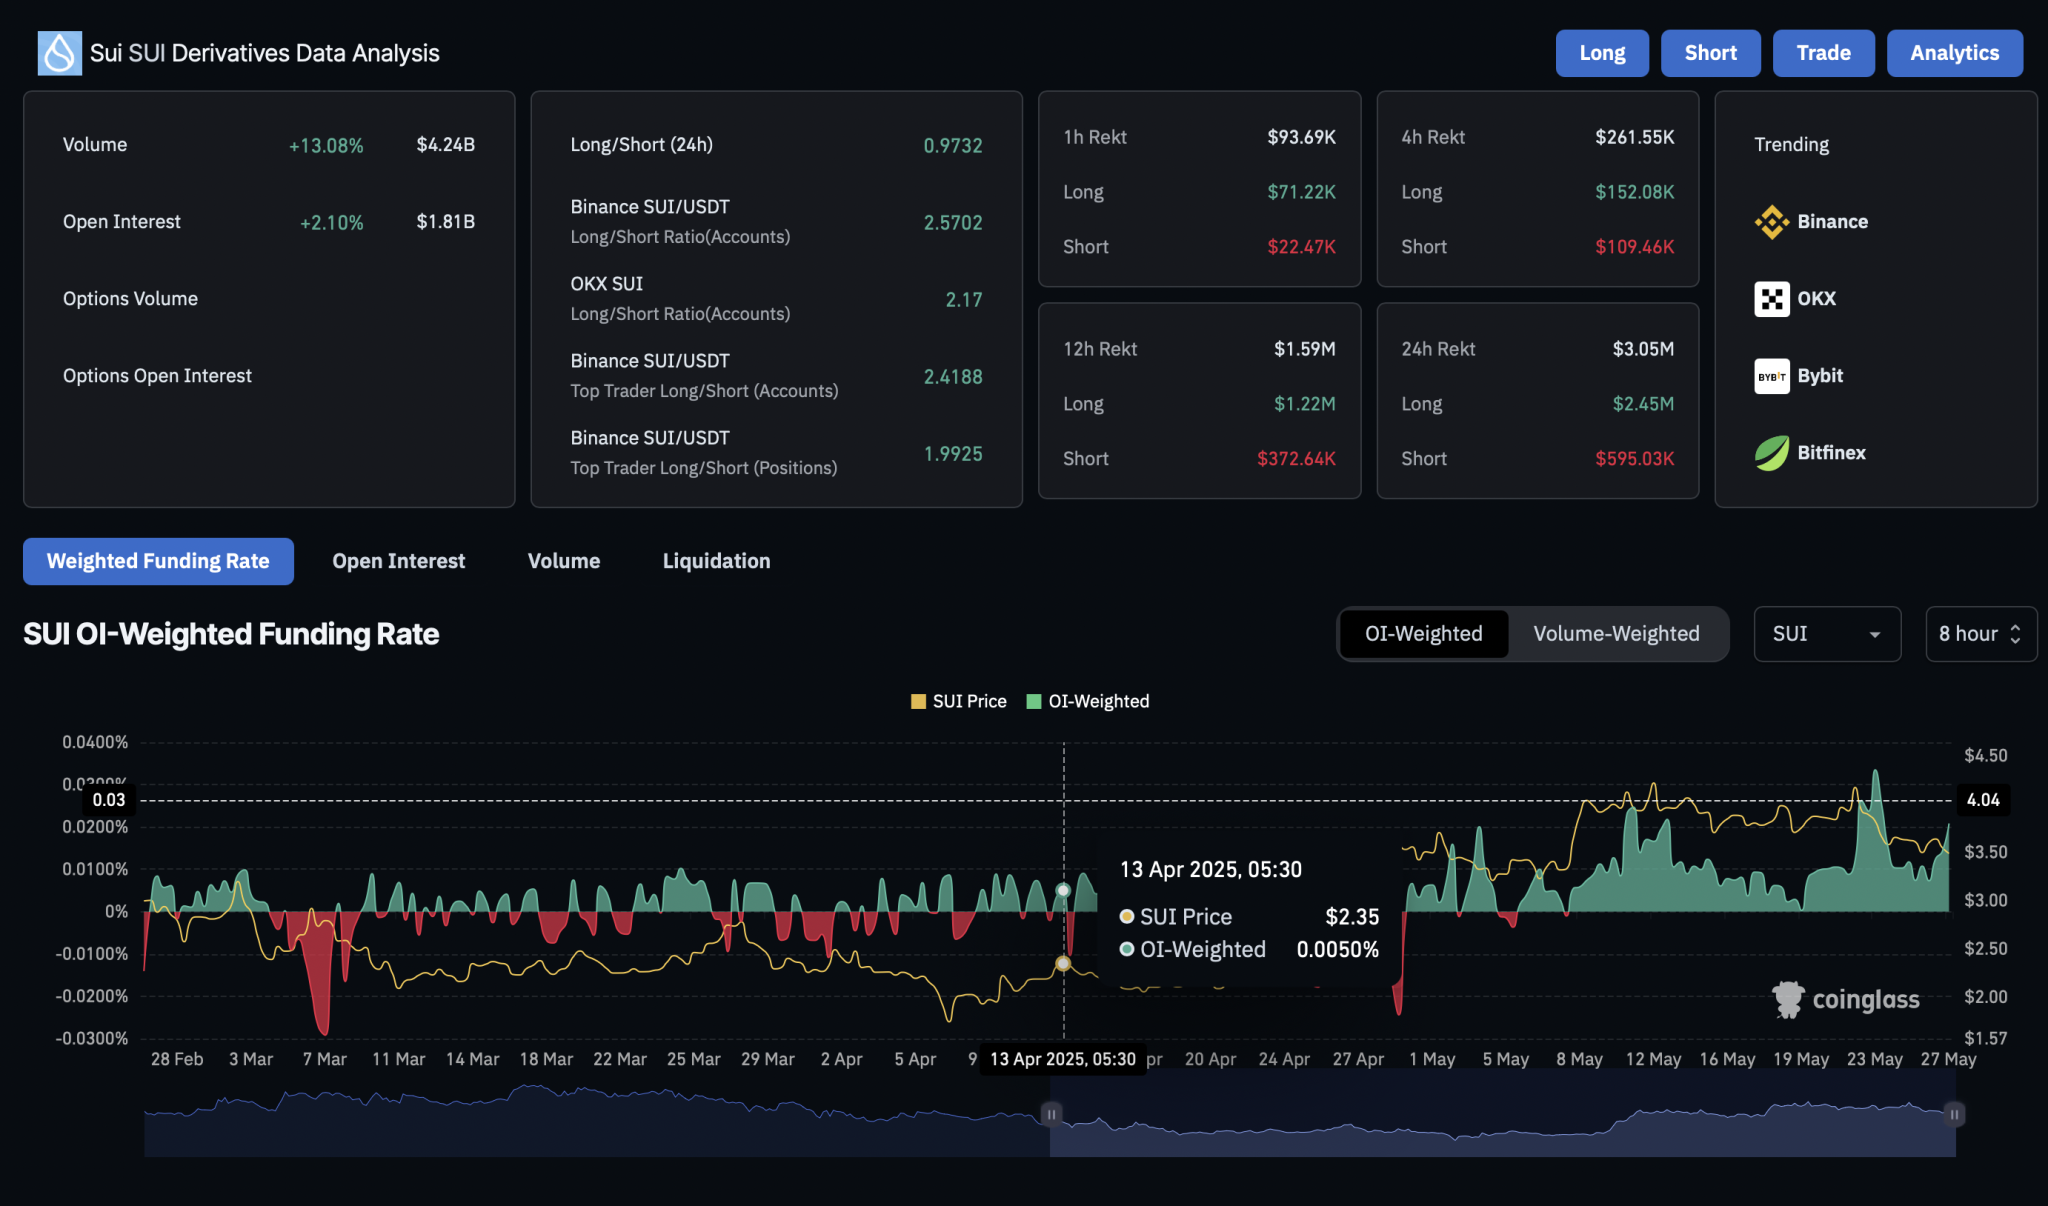
Over the past 24 hours, the bullish narrative in the SUI derivatives market has strengthened significantly. Open interest increased by 2.10%, reaching $1.81 billion, while the funding rate rose by 20.02%. This reflects a surge in bullish trading activity despite a recent wipeout of bullish players.

This is highlighted by $2.45 million in long liquidations compared to $595K in short liquidations over the last 24 hours. With bullish sentiment largely unaffected in SUI derivatives, traders anticipate a potential reversal.

SUI Derivatives
SUI Derivatives

Solana Sideways Trend Sparks Double Top Risks: Can Bulls Drive SOL to $215?

Solana holds firm above $165, with bullish technicals pointing to a potential breakout at $215. Can bulls overcome resistance at $184 and continue the rally?

After an 18% surge this month, Solana is taking a breather, maintaining a sideways trend above $165. While this short-term consolidation raises the risk of a double top reversal, the prevailing uptrend targets a breakout above $180.

Solana Price Analysis

On the daily chart, Solana’s sideways movement suggests a potential double top formation near the 61.80% Fibonacci retracement level at $184.52. Facing resistance from the $180 supply zone, Solana continues its sideways shift.

Solana Price Chart
Solana Price Chart

The 50% Fibonacci level at $165 acts as the lower boundary, while a close positioning of the 200-day EMA at $163 provides additional support. Moreover, a positive crossover between the 50-day and 100-day EMAs signals a possible trend reversal.

However, the MACD and signal lines have yet to achieve a bullish crossover, despite moving closely together. As the consolidation continues, the risk of a bearish reversal from a falling wedge breakout increases.

According to Fibonacci levels, a potential upside breakout could reach $215, marked by the 78.60% retracement, with an extended price target near $261.

On the downside, failure to hold bullish support above $165 could test the 50-day EMA at $158, followed by the 38.20% Fibonacci level at $148. Consequently, a breakdown may threaten the $150 psychological level.

Analyst Targets $200 With Bullish Pennant.

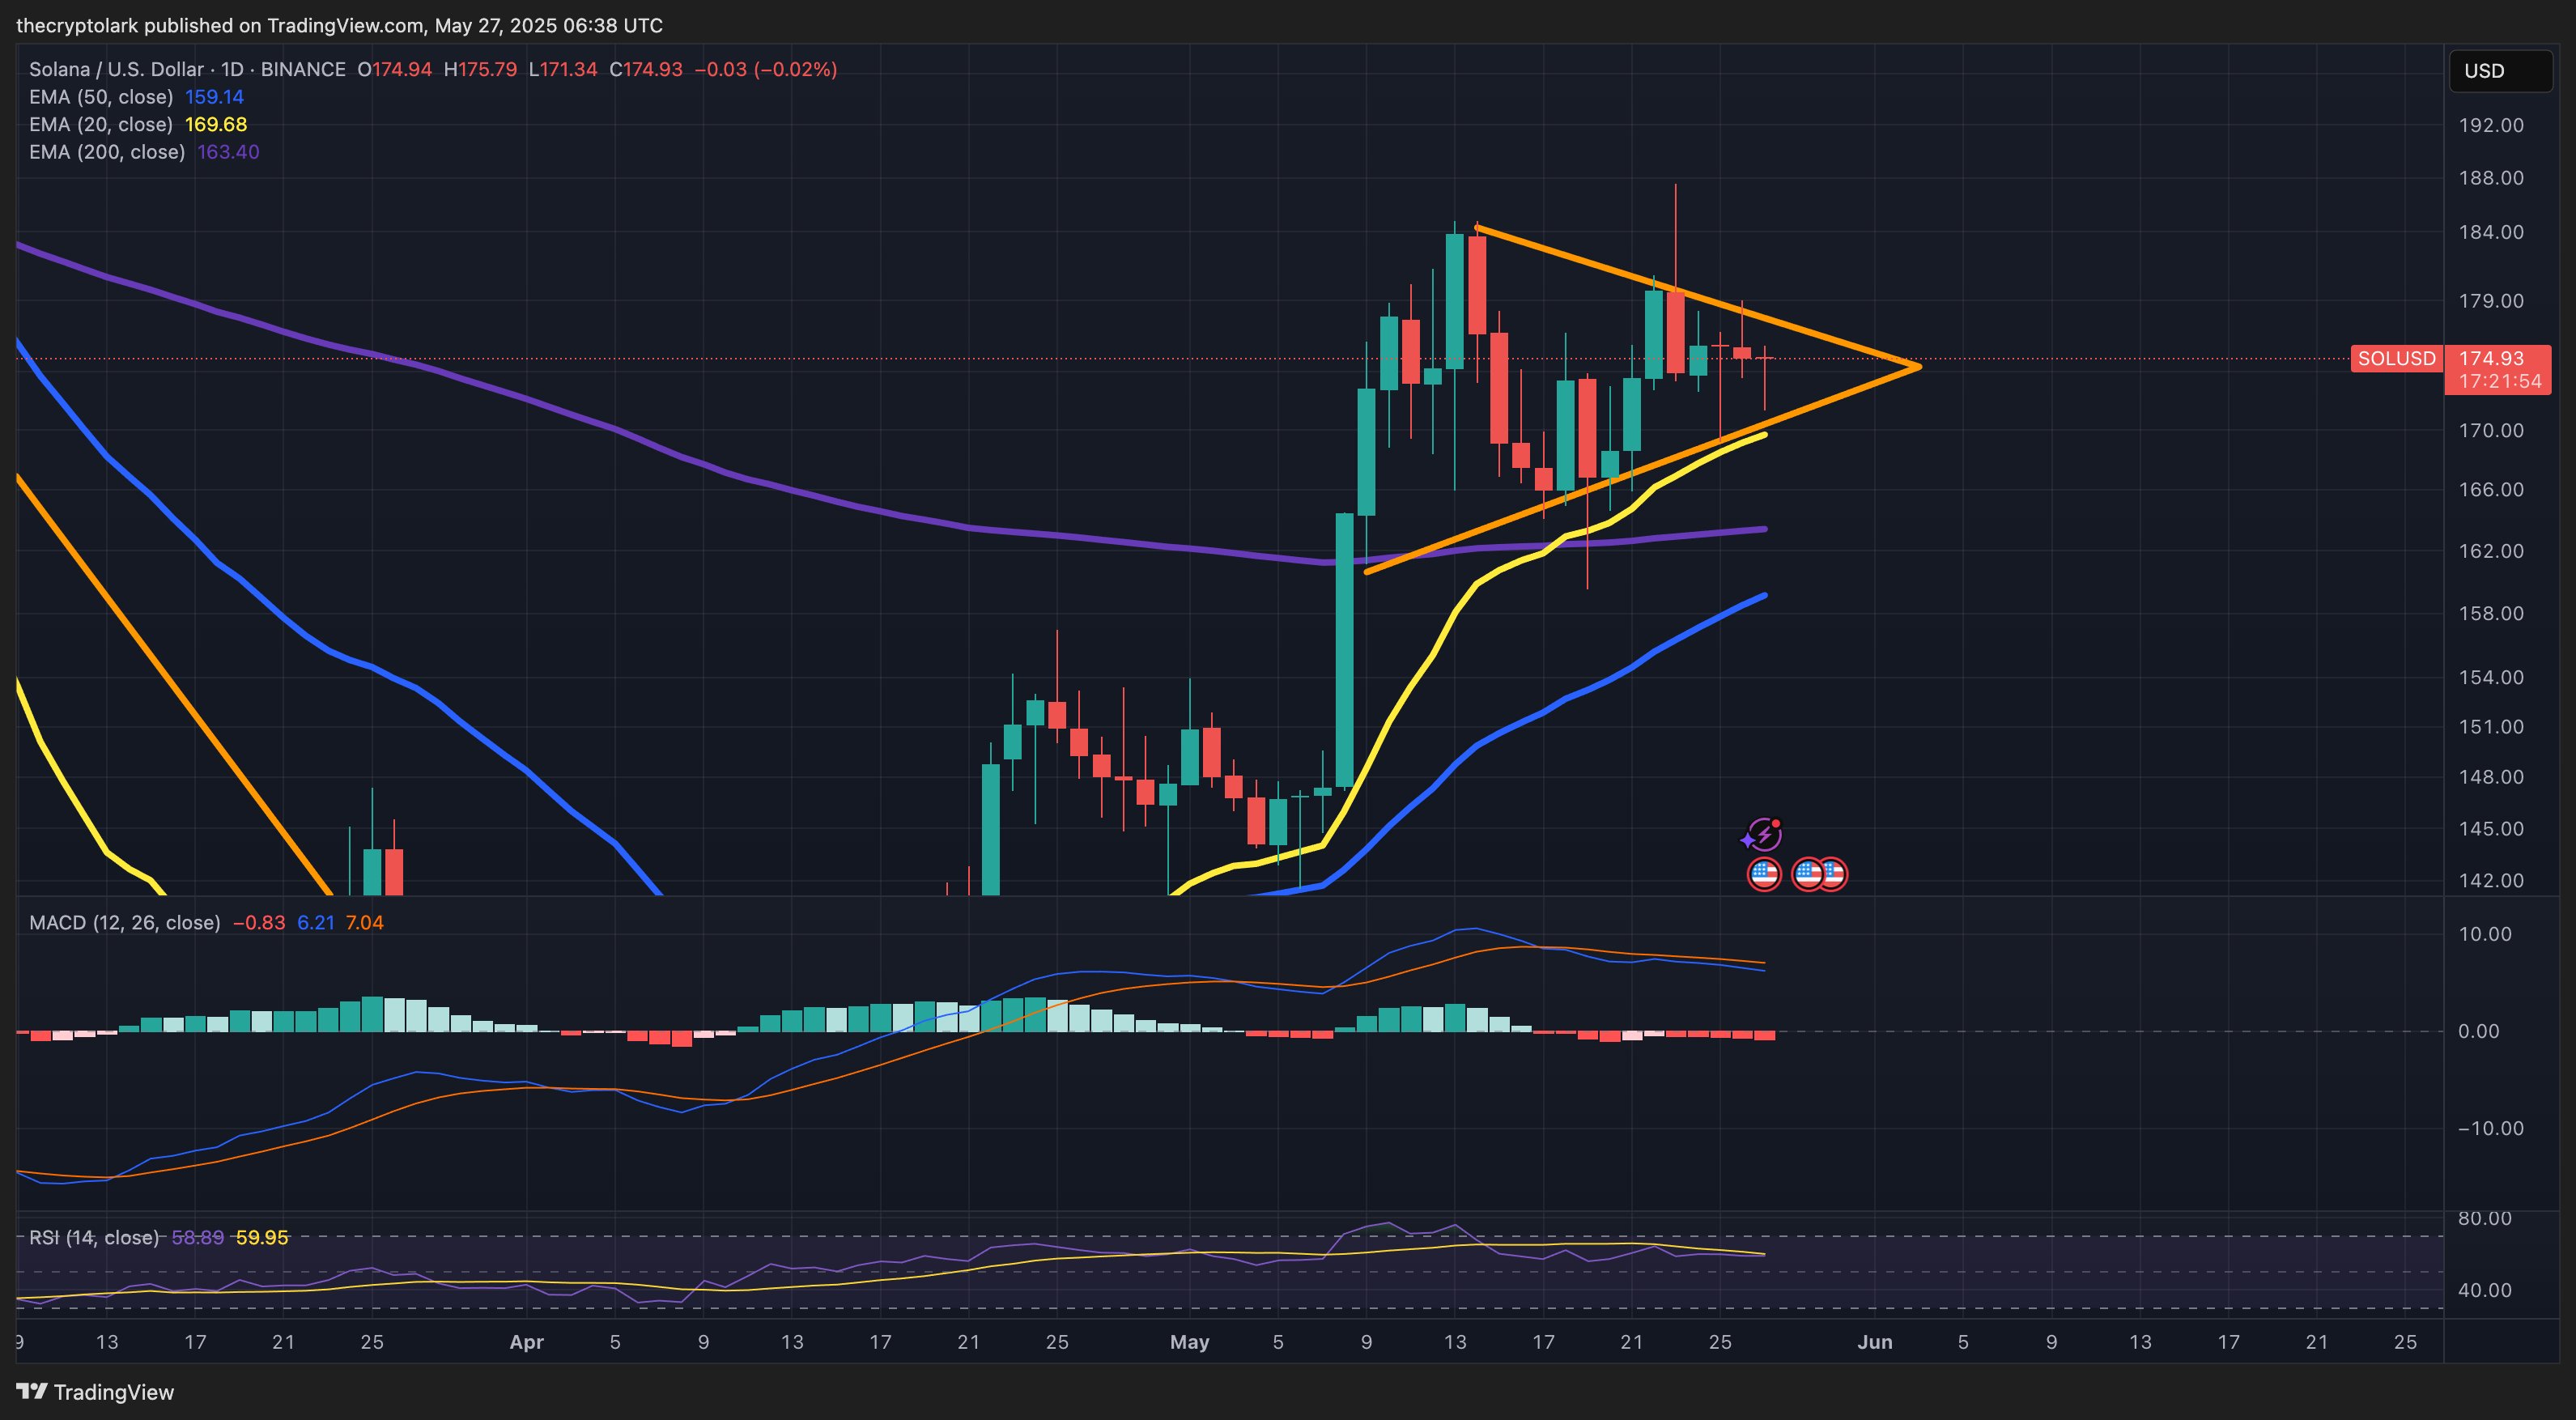
As Solana consolidates, crypto analyst Lark Davis identifies a bullish pennant forming on the daily chart. Following the bull run in early May, the symmetrical triangle pattern suggests a potential breakout rally to $200 if bulls maintain control.

The analyst noted critical support levels, including the 20-day EMA at $169 and the 200-day EMA at $163.

Image

Derivatives Data Signals Bearish Warning

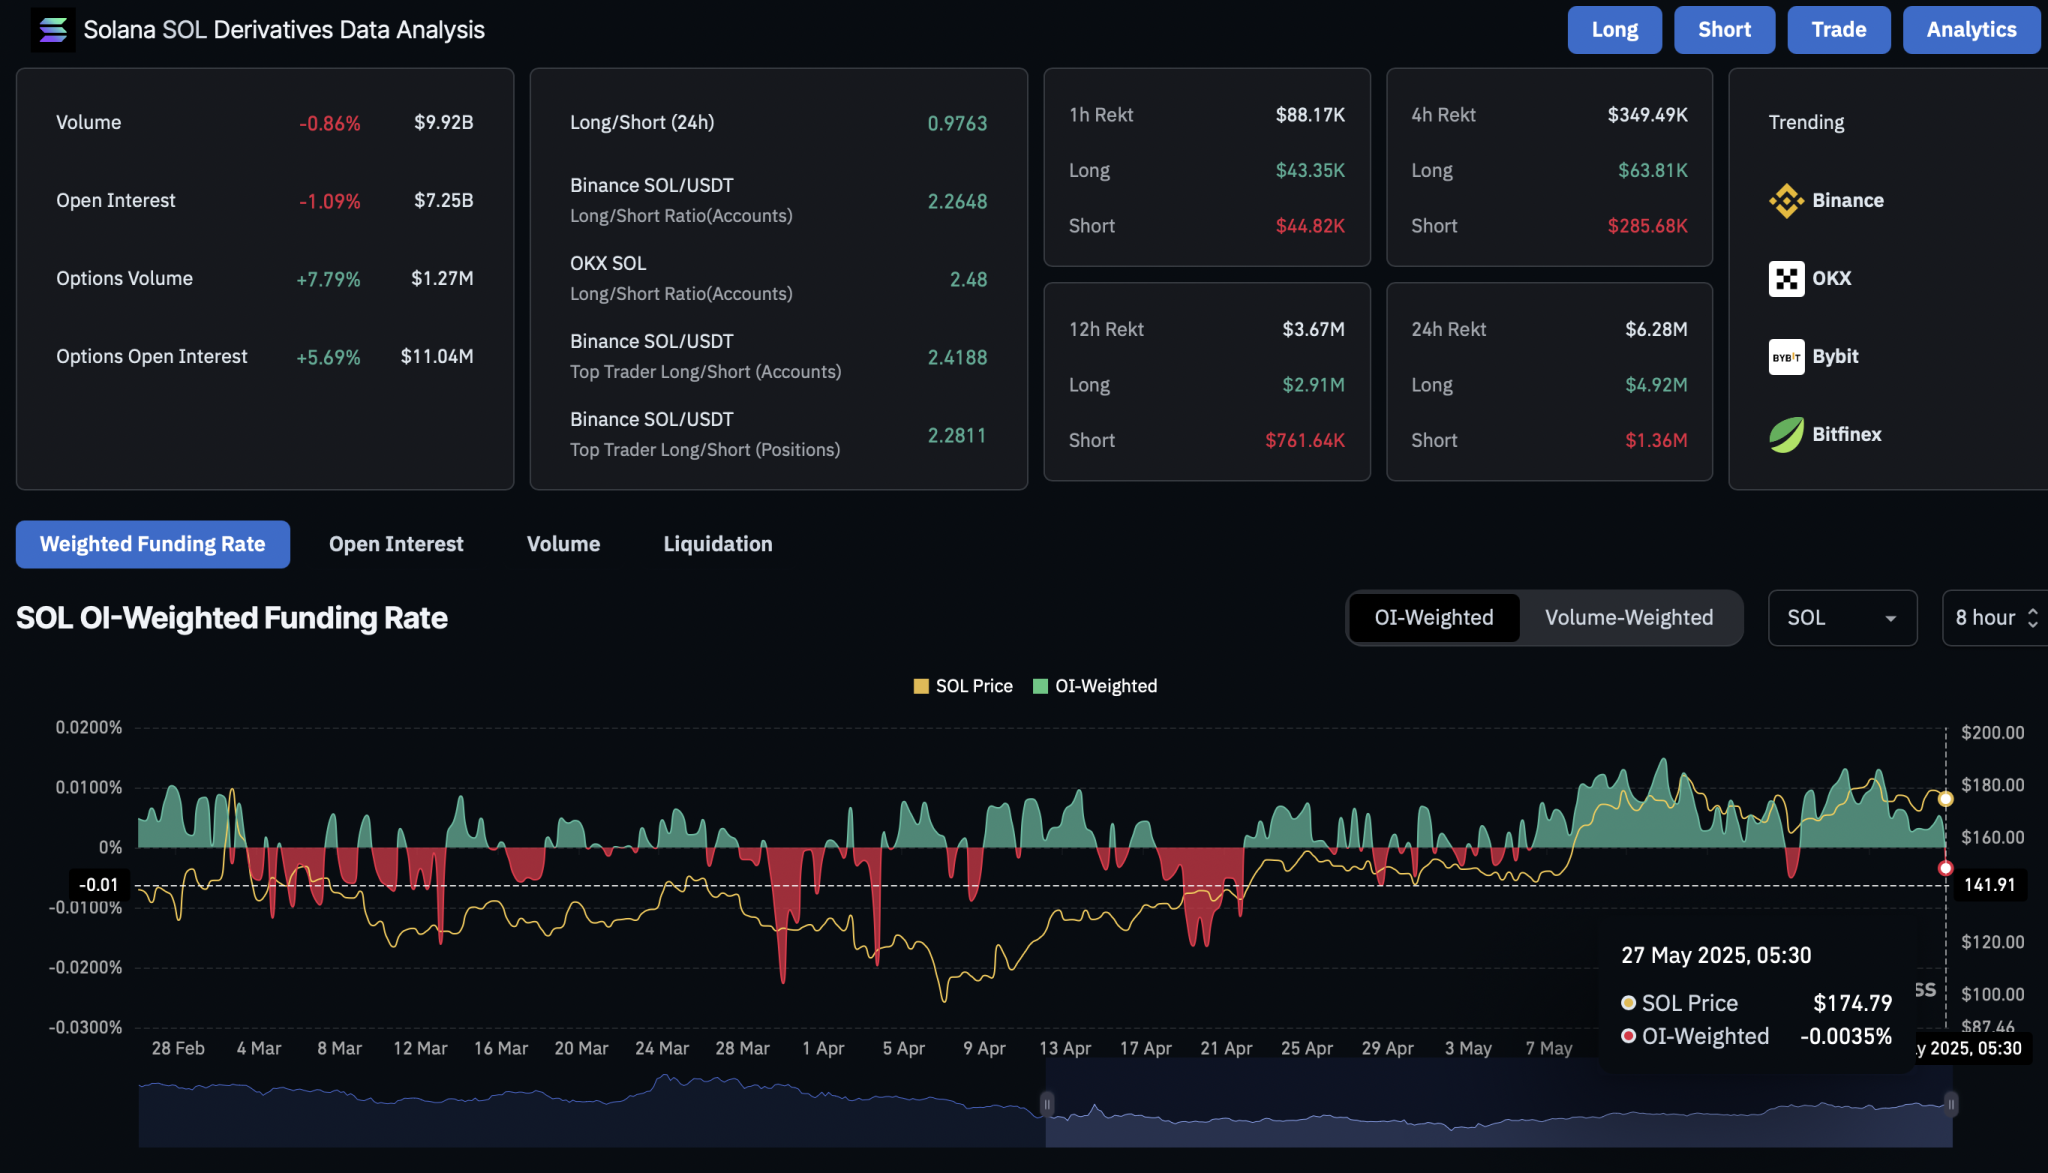
Despite the optimistic price outlook, derivatives data show a surge in bearish activity. Open interest has declined by 1.09% to $7.25 billion, indicating a slowdown in trader activity.

Furthermore, the recent flip in the OI-weighted funding rate to -0.0035% reflects bearish sentiment. Overall, 24-hour-long liquidations of $4.92 million significantly outnumber short liquidations of $1.36 million. This larger shakeout of bullish players suggests a bearish bias in the derivatives market.

SOL Derivatives
SOL Derivatives

Dogecoin History Is Repeating: Top Analyst Highlights Possible 5,163% Rally to Above $12

0

Dogecoin could be up for an explosive rally to double digits as a recurring bullish pattern seems to be developing on the asset’s higher timeframe.

Top analyst Trader Tardigrade highlighted this pattern in a May 26 tweet amid Dogecoin’s recent resurgence. For perspective, the doggy-themed meme coin seems to rebound from recent shake-offs, up 4% from its intra-week low of $0.219.

Also, a recent analysis has shown a string of positive developments, including a successful retest of a key support area and an early higher-low formation on the weekly timeframe. This further fuels optimism that Dogecoin could be on the cusp of a rebound to higher prices.

History Repeating for Dogecoin

Trader Tardigrade noted that a recurring bullish pattern has emerged on the DOGE/USDT 1M timeframe. The X analysis highlighted that Dogecoin could hit unprecedented prices if this comes to fruition.

An accompanying chart shows that Dogecoin has followed a pattern of price development in the last two cycles, leading to a parabolic expansion in both cases.

For perspective, the token formed a triangle between January and August 2014 and entered a rising channel with its 300% rally to $0.0005. DOGE maintained its trend within the wedge until March 2017, when it rallied 2,900% from $0.0002 to $0.0060.

Dogecoin Repeating Historical Price Action/Trader Tardigrade

Dogecoin entered another triangle from the January 2018 high and continued to March 2020. Again, it formed an ascending channel afterwards and remained within the range until November 2020. The token broke out again, rallying 29,130% to its all-time high of $0.76 before retracing to $0.32.

Interestingly, DOGE has repeated the exact pattern this bull cycle. It broke out from a descending triangle in October 2023 and from the wedge this month. With the development, Trader Tardigrade has predicted that a price surge is on the horizon.

Specifically, he predicts an over 5,163% rally from the current price to a new all-time high above $12. Notably, the ambitious target would take DOGE’s market cap to $1.79 trillion, trouncing Ethereum’s current $317 million valuation by over fourfold.

Other Bullish Dogecoin Targets

Interestingly, the Monday analysis comes on the heels of a parallel commentary from Trader Tardigrade predicting a rally to $6. The market watcher highlighted another recurring pattern on Dogecoin’s 6-month chart that would warrant a rally to the new price high.

Moreover, Trader Tardigrade’s forecast follows a trend of bullish positions on Dogecoin. For instance, TradingView analyst Akbar Karimzsfeh called a breakout from a symmetrical triangle, with his target set at $3.

Nonetheless, Dogecoin would have to defy crucial resistance if it wants to target higher prices. Expert Ali Martinez highlighted the supply zone around $0.25 and $0.26 as critical, noting that its reaction around the area will determine its next course of action in the near term.

Cardano Eyes $0.84 After Sharp Rebound from $0.72 Support

Cardano has rebounded from the $0.72 support level, but weak derivatives data clouds the outlook. Can ADA break past $0.77 to re-test $0.84?

As Bitcoin holds firm at $109,000, Cardano maintains its position above the $0.72 support zone. With the recent bounce, could Cardano re-challenge its $0.84 resistance ceiling?

Cardano Price Analysis

Cardano is up 11% this month despite volatile price movements on lower timeframes. On the 4-hour chart, ADA shows a bullish rebound from the 200-period exponential moving average (EMA) at $0.74. This marks an early reversal from the $0.72 demand zone, pushing the price toward the short-term resistance at $0.7745.

Cardano Price Chart
Cardano Price Chart

Currently, ADA is consolidating between the 200-day EMA and the upper resistance at $0.77. Despite choppy price action, the MACD and signal lines have formed a bullish crossover, supported by a new wave of positive histogram bars.

However, even with the positive alignment of the 50-, 100-, and 200-period EMAs, there is a risk of a bearish crossover between the 50- and 100-day EMAs. If ADA falls below the 200-day EMA, it may trigger a “death cross,” signaling potential downside.

For now, as major cryptocurrencies consolidate, Cardano remains stuck in a no-trade zone between $0.72 and $0.77. A potential breakout above this range could spark a rally toward $0.84, which was last seen on May 13 and May 23.

Conversely, a breakdown below the $0.72 demand zone could test the long-term support trendline near $0.70.

Gloomy ADA Derivatives Warns of Bearish Move

Amid heightened volatility, Cardano’s derivatives market shows signs of weakness. According to CoinGlass, open interest has dropped 4.42% to $897 million. Meanwhile, options volume has plunged 92% to 6.59K, with open interest in options falling to $374K

ADA Derivatives
ADA Derivatives

Overall, bullish sentiment among traders has weakened, with the funding rate dropping to 0.0067% from a peak of 0.019% on May 22.

Notably, long liquidations in the past 24 hours totaled $863K, compared to just $191K in short liquidations. This brings the total 24-hour liquidations to over $1 million, with significantly more long positions being wiped out.

Here is Why Dubai Selected XRP Over Bitcoin for Its $16B Real Estate Tokenization Project

0

A popular crypto expert has revealed why the Dubai government chose XRPL instead of Bitcoin for its real estate tokenization project. 

Earlier this week, the Dubai Land Department (DLD) announced the launch of its first-ever tokenized real estate platform, Prypco Mint. The initiative follows a partnership with multiple entities, including Prypco, the Dubai Future Foundation, Ctrl Alt, and the Virtual Assets Regulatory Authority. 

Under the initiative, investors can obtain fractional ownership in Dubai properties by purchasing tokenized shares tied to those properties. The minimum offer for the tokenized shares was pegged at 2,000 dirhams (approximately $540). 

Interestingly, Ctrl Alt selected the XRP Ledger (XRPL) as the blockchain infrastructure for tokenizing title deeds. Notably, XRPL will support the formation of Dubai’s tokenized property market, which is expected to hit $16 billion by 2033. 

Expectedly, XRPL’s role in the project ignited intense debate in the crypto community, with some questioning why it was chosen over other leading blockchains like Bitcoin. 

Why the Dubai Government Chose XRPL Over Bitcoin for Its Real Estate Tokenization Project 

Amid this query, popular social media influencer John Squire emphasized that the Dubai government’s decision to use XRPL instead of Bitcoin in its inaugural real estate tokenization project boils down to “brutal efficiency” across six major dimensions. 

Transaction Speed

Squire noted that the speed at which the XRP Ledger settles transactions played a crucial role in its selection. According to him, while XRPL settles transactions within 3 – 5 seconds, a similar task takes Bitcoin between 10 minutes and an hour. 

Low-Cost Transaction 

Another factor that influenced XRPL’s selection in Dubai’s real estate tokenization project is its low transaction cost. Squire emphasized that, compared to Bitcoin, transactions on the XRP Ledger take a fraction of a cent.

Scalability 

Per the social media influencer, XRPL’s ability to process thousands of transactions within seconds was instrumental in the selection. He emphasized that XRPL could process up to 1,500 transactions within a second. However, Bitcoin only handles seven transactions within the same period. 

Consequently, Squire noted XRPL’s scalability prowess aligns with the Dubai government’s long-term thinking of supporting large-scale real estate platforms. 

Sustainability 

The expert suggested that the XRP Ledger is more sustainable than Bitcoin. XRPL uses a consensus algorithm that is free of mining for transaction processing, supporting Dubai’s green and sustainable vision. 

On the other hand, Bitcoin is known for its proof-of-work algorithm, which requires energy-intensive mining. This activity has attracted criticism from governments worldwide, with some countries, including China, banning Bitcoin mining. 

Institutional Friendliness 

In addition, Squire suggested that Ripple has partnered with multiple banks, regulators, and governments over the years, and many of these entities have been onboarded to XRPL. 

However, he characterized Bitcoin as unsuitable for major initiatives like Dubai’s real estate tokenization project. 

Widespread Use Case 

Finally, the commentator highlighted XRPL’s proven utility across multiple sectors, such as cross-border settlements, stablecoins, CBDCs, and tokenization. However, he indicated that Bitcoin only serves as a store of value with no tokenization use case. 

Notably, Squire emphasized that billion-dollar initiatives, like the Dubai government project, usually prefer utility-based blockchains over those driven by ideology. 

“Dubai chose XRP because it’s fast, cheap, scalable, energy-efficient, and institution-ready,” the expert remarked. 

Expert Predicts How High Bitcoin Could Go by Weekend

0

Widely followed commentator “The Bitcoin Therapist” has predicted a strong move for Bitcoin by the end of the week, prompting mixed reactions due to the lack of clear analysis.

After surging to a peak above $111,900 on May 22, Bitcoin entered a volatile phase, experiencing a sharp decline to a local low of around $106,683 on May 25. Despite the dip, Bitcoin has staged a partial recovery and is now trading at $109,060—reflecting a 0.74% drop over the past 24 hours but still showing a 3.30% gain over the past seven days.

Market Reactions and Community Commentary

Following this consolidation, some market participants continue to predict higher prices. One such forecast came from The Bitcoin Therapist on X, who projected a $120,000 Bitcoin price by the end of the week. 

At the current price of $109,060, this implies an approximate 10.03% increase is required. However, the post did not provide any technical or fundamental basis for the forecast.

The reaction among community members was mixed. One comment noted that price predictions lacked value without supporting context, pointing out that Bitcoin had already risen 8% in the current week. 

The watcher highlighted the “greedy” market sentiment score of 68 and suggested a preference for fundamentals over speculative posts. Another commenter tied potential price moves to upcoming weekly and monthly candle closings. Others engaged more lightheartedly, acknowledging the bullish sentiment as a welcome distraction during market uncertainty.

Technical Analysis Confirms Potential Upside

However, technical insights provided by Titan of Crypto suggest a bullish longer-term structure. The chart analysis outlines a classic Inverse Head and Shoulders formation on the monthly timeframe.

This pattern is typically seen as a reversal indicator, with the structure completed by three troughs.

Notably, the left shoulder formed during Bitcoin’s mid-2021 correction from its $60,000 highs. The head, forming the lowest point, developed in late 2022 when prices touched the $15,000–$17,000 range. By early to mid-2024, the right shoulder had formed as the asset revisited resistance levels. 

The breakout above the neckline pushed prices past the $100,000 level. Meanwhile, Bitcoin later pulled back to retest the neckline, a move considered typical and strengthening for this technical pattern.

Image

Current Setup and Remaining Upside

At present, Bitcoin remains above the neckline level that had acted as resistance. According to Titan of Crypto’s analysis, the pattern’s breakout has activated a technical price target near $125,000. 

Given the current price of $109,060, this suggests potential upside in the range of 14% to 15%.

Bitcoin Would Be at $10M Now If the World Understood the Asset: Samson Mow

0

Samson Mow, also known as Asia’s Michael Saylor, has stressed that the world is yet to understand Bitcoin and its uniqueness among other asset classes.

Bitcoin recently surged to a new all-time high of $112,000, pushing its market cap to $2.2 trillion. While the asset has retraced slightly, it remains atop the $109,000 price mark.

Meanwhile, the flagship cryptocurrency’s bullish momentum has seen it surpass Amazon to become the fifth-largest asset in the world by market cap. Yet Samson Mow, the CEO of JAN3 and a popular Bitcoin advocate, still feels the asset is undervalued.

The World Does Not Understand Bitcoin: Mow

In a tweet today, the maximalist noted that people are still in the dark about Bitcoin’s underlying technology and potential impact on the global financial system.

Several enthusiasts have termed the pioneering cryptocurrency the hardest money in existence and the most reliable store of value. Furthermore, Bitcoin’s scarce nature and pre-programmed issuance reduction model through periodical halving events make it even more valuable.

Mow understands these unique qualities but stresses that they are still obscure to many. He noted that if the world understood Bitcoin’s potential, it would be worth $10 million per coin in the current market.

The maximalist insinuated that the asset’s adoption rate would have been higher than it currently is, driving further scarcity and, consequently, explosive upward price actions.

Remarkably, Mow has been ever vocal about Bitcoin and its potential to create generational wealth. Earlier, he noted that Bitcoin has no top, calling its current $100,000 price undervalued. The market commentator had also predicted that Bitcoin would hit $1 million this year, as he believes the asset will replicate its 2017 feat.

Mass Adoption Slowly Emerging, Regardless

Meanwhile, corporate institutions and nation-states are slowly coming around, although not on the scale the JAN3 CEO expects. Public and private firms are increasingly gaining exposure to Bitcoin, with countries also creating reserves to store the largest cryptocurrency by market cap.

Data from BitcoinTreasury shows that 210 entities currently hold Bitcoin, up by 13 in the last 30 days. About 113 public firms, including MicroStrategy and Tesla, 30 private corporations like Block.one and Tether, and 12 governments hold Bitcoin as adoption swells.

The launch of Bitcoin spot ETFs has also hastened Bitcoin’s adoption rate. Recent Form 13F filings reveal that several institutions, like Goldman Sachs and Abu Dhabi’s sovereign wealth fund, Mubadala, have bought Bitcoin.

Is $10M Bitcoin Possible?

Notably, predictions of a Bitcoin rally to $1 million are now commonplace in crypto. However, some believe an ambitious $10 million price is still attainable.

For instance, Larry Lepard, the founder of Equity Management Associates, predicted that Bitcoin would hit $10 million in the long term, citing the US dollar’s decay. Adam Black, co-founder of Blockstream, also believes the price mark is attainable, asserting it would happen after the next two Bitcoin halvings in 2032.

Meanwhile, Michael Saylor finds the ambitious $10 million prediction a bit meager in comparison to Bitcoin’s trajectory. The Strategy co-founder predicted a rally to $13 million by 2045.

Bitcoin trades at $109,564 at press time.