Home Blog Page 721

Bitcoin Open Interest Hits New ATH Above $80B

Bitcoin open interest has claimed a new all-time high amid bullish bets on higher prices despite the recent pullback.

The correction comes on the back of a renewed escalation of the trade war, as President Donald Trump recently threatened to impose a 50% tariff on all EU imports and a 25% tariff on Apple products unless iPhones are produced domestically. 

Bitcoin Open Interest Hits ATH Despite Fresh Pullback

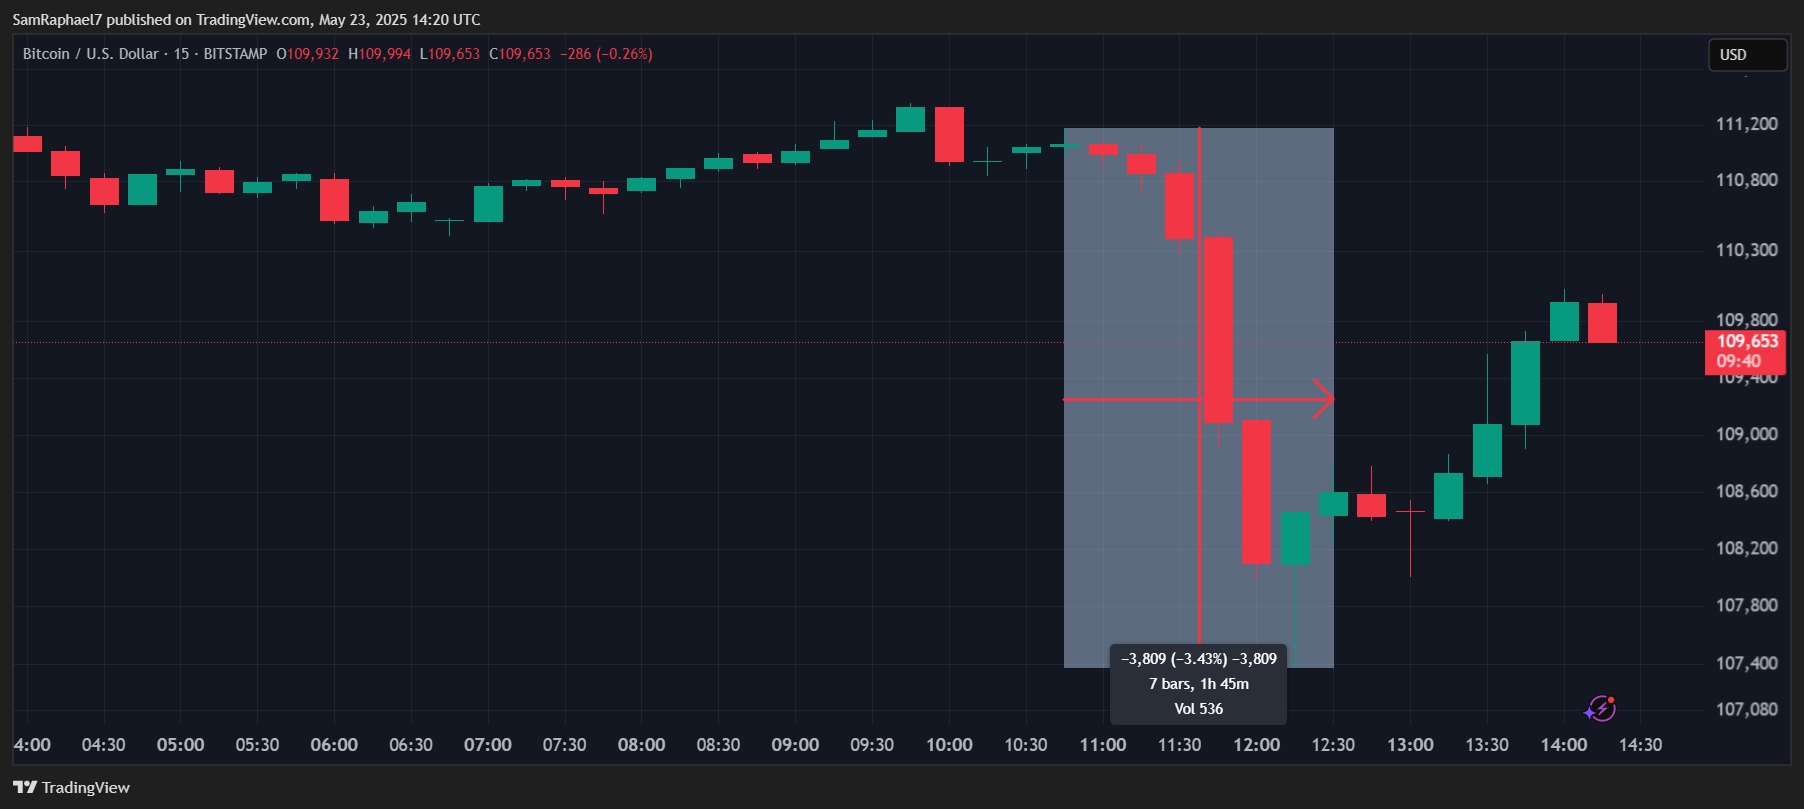
In response, Bitcoin dropped drastically after recently hitting a new all-time high close to $112,000. Notably, from a peak of $111,176 earlier today, the crypto firstborn collapsed to an intraday low of $107,367, marking a sharp 3.43% drop in under two hours. This represented one of Bitcoin’s sharpest slumps in recent times. 
Bitcoin 15m Chart
Bitcoin 15m Chart

However, it saw an immediate recovery shortly after. Despite the rebound effort, the asset is still suffering from the recent crash, posting a 1.83% loss on the day, as the bears threaten to trigger Bitcoin’s largest losing day since April 13.

Also, the broader crypto market reacted bearishly, with the global crypto market cap losing a whopping $107.61 billion within three hours today. Nonetheless, despite the fresh bearishness, reports from Bloomberg confirm that bulls remain unbothered, as Bitcoin open interest has continued to spike today. 

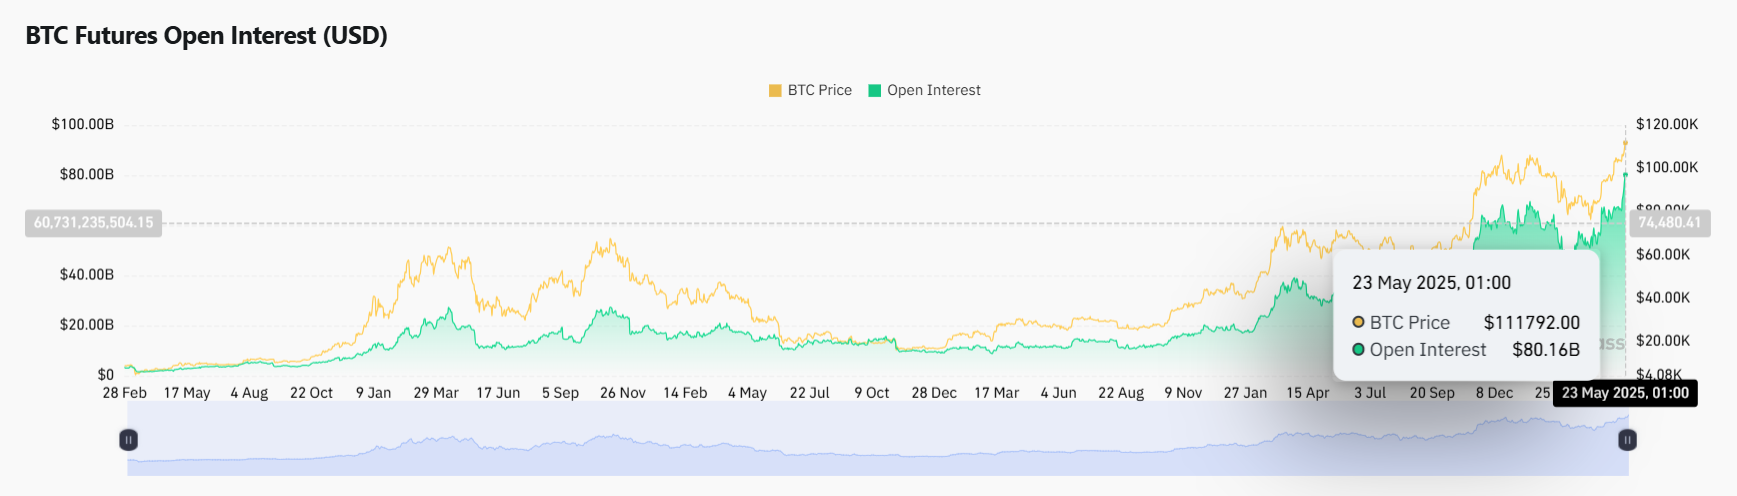
Interestingly, data from Coinglass indicates that Bitcoin open interest hit $80.16 billion today. This represents an increase of over $2 billion from the figure recorded yesterday, May 22, and marks a new all-time high for Bitcoin open interest in the futures market.
Bitcoin Open Interest Coinglass
Bitcoin Open Interest | Coinglass

Bitcoin Open Interest Skews Bullish

The Bloomberg report also highlighted data from Deribit suggesting that this surge in Bitcoin’s open interest skews mainly toward bullish sentiment.

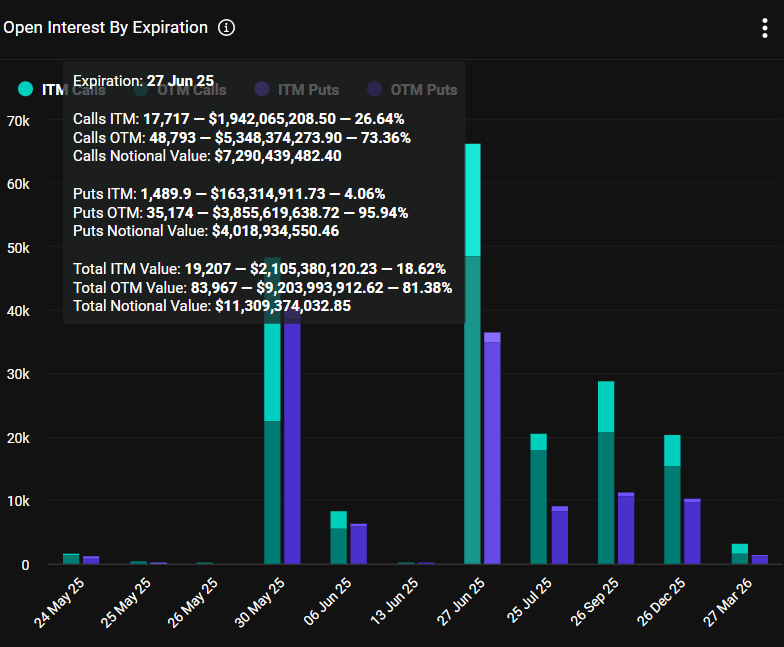
Notably, an investigation carried out by The Crypto Basic confirmed this. Specifically, for the June 27 expiration data, the total call open interest is 66,510 contracts, out of which 17,717 are ITM (in-the-money) and 48,793 are OTM (out-of-the-money). This corresponds to a notional value of about $7.29 billion for calls, with OTM calls representing over 73% of that. 

On the put side, the total open interest is 36,663 contracts, with only 1,489 ITM and 35,174 OTM, making nearly 96% of puts OTM. Essentially, the notional value for puts is $4.02 billion.
Bitcoin Options Deribit
Bitcoin Options | Deribit

Combined, the puts and calls give a total notional value of $11.31 billion, with most of it, over 81%, in out-of-the-money contracts. 

This means most of the capital is betting on large moves that have not yet materialized. Importantly, calls make up the larger portion of both open interest and notional value, suggesting a skew toward bullish positioning.

From a sentiment standpoint, this data leans bullish. The dominance of call options over puts, especially with the large number of OTM calls, indicates that more market participants are expecting higher Bitcoin prices by late June.

Other Bullish Metrics

In addition, institutional interest in Bitcoin through the ETF products is through the roof. Yesterday, total net inflows into Bitcoin ETFs hit a high of $934.74 million, according to data from Sosovalue. This represented the highest intraday net flow this month, bringing total assets in these products to $134.3 billion.
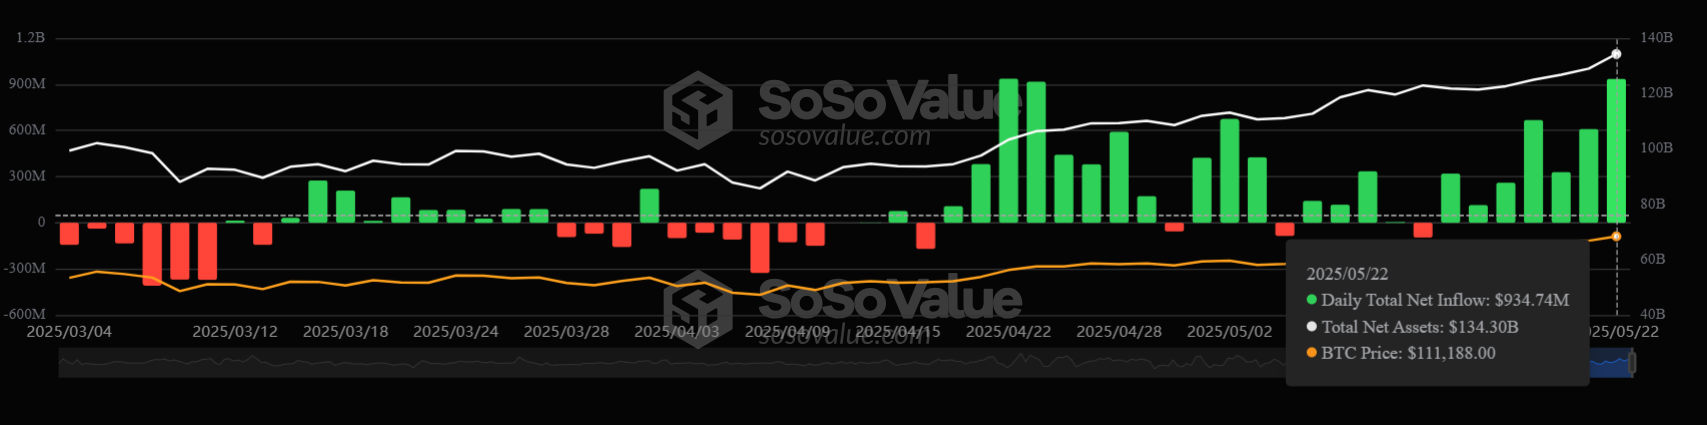
Bitcoin ETF Netflows Sosovalue
Bitcoin ETF Netflows | Sosovalue

Notably, the bullish sentiment is expected, considering these metrics as well as recent reports suggesting that despite BTC claiming new ATHs, retail investors are yet to decisively enter the market. Currently, Bitcoin changes hands at $109,653.

Expert Says Trump’s 50% Tariff on EU Imports Presents Dip Opportunity for Bitcoin and Altcoins

0

Popular market veteran Michaël Van de Poppe remains unshaken by the recent market correction, predicting that this panic moment would soon provide massive returns. 

The broader crypto market experienced a major dip after President Donald Trump slapped a 50% tariff on all imports from the European Union. 

Earlier this week, the prices of major crypto assets surged tremendously thanks to a Bitcoin-led relief rally. Following the recent surge, Bitcoin set a new all-time high (ATH) record of $111,970 yesterday, May 22. Altcoins followed suit and also saw slight gains. 

Trump Announces 50% Tariffs on EU Imports 

However, the rally was short-lived. The broader financial markets, including crypto, tanked after Trump floated a plan to impose a 50% tariff on imports from the EU region. 

In a Truth Social post, President Trump disclosed that dealing with the EU has been challenging lately. According to him, the region’s policy, including its VAT taxes, trade barriers, monetary manipulations, and unfair lawsuits against American companies, have caused the U.S. an annual deficit of $250 million. 

He emphasized that this $250 million deficit is unacceptable, adding that recent discussions with the EU have ended in futility. As a result, he imposed a 50% tariff on all imports from the EU starting June 1, 2025. Notably, he clarified that the 50% tariff would not apply to goods manufactured by EU companies in the U.S. 

Cryptos React 

As expected, Trump’s 50% tariffs on EU imports spooked the financial markets, including crypto and stocks. Investors feared the move could result in a trade war between the EU and the U.S. 

This prompted many investors to sell their crypto holdings, leading to a broader market crash. Specifically, Bitcoin, which traded around the $110,000 mark earlier today, slumped to around $107,400 in reaction to the tariff news. 

Although Bitcoin rebounded almost immediately to $109,500, the premier crypto is still down 2.2% from its new ATH. 

Van de Poppe Remains Unfazed

Meanwhile, many stakeholders remain unfazed by the Trump-driven bloodbath across the crypto market. Interestingly, veteran market analyst Michaël Van de Poppe is one of those who do not seem troubled by the latest crash. 

The crypto expert emphasized that the recent market crash allows investors to scoop Bitcoin and altcoins at lower prices. He recounted how the crypto market rebounded sharply in the past sell-offs experienced a few months ago. 

For context, Trump’s trade war started on his first day in office, January 20, 2025. It initially started as a threat after he was sworn in as the 47th President of the United States. However, he followed through by issuing executive orders on February 1, slapping high tariffs on goods imported from several countries, including China, Canada, and Mexico. 

These countries retaliated by also imposing tariffs on U.S. goods. However, Trump continued to raise duties and eventually imposed a 145% tariff on China imports, while the latter reciprocated with a 125% tariff on goods from the United States. 

This trade war crashed the prices of major financial instruments, including Bitcoin. The premier crypto, which hit $109,114 on January 20, eventually crashed to $74,000 three months later, specifically on April 9, 2025.  

Interestingly, crypto prices have soared ever since Trump announced a 90-day pause on all reciprocal tariffs in April. Amid this favorable market condition, Bitcoin reached a new all-time high of $111,970 yesterday. 

Although the top crypto has slumped to around $109,500 due to Trump’s latest tariff on EU goods, Poppe sees this dip as an opportunity to buy BTC at low prices in anticipation of an imminent rally. 

PEPE Eyes $0.000030 Amid Flag Breakout and $3 Million in Short Liquidations

Pepe is leading the meme coin rally with a strong breakout, gaining 12% in just 24 hours. Is $0.000030 the next big target?

As the altcoin rally gains momentum, meme coins are at the forefront, with a 4.56% increase in total market cap, now nearing $70 billion. Among the top performers, Pepe has surged nearly 12% in the past 24 hours, breaking through the key resistance at $0.000015. Will this breakout rally push the Solana-based, frog-themed meme coin toward a new all-time high?

PEPE Price Analysis

On the 4-hour chart, Pepe displays a consolidation range between $0.00001274 and the upper ceiling near the psychological level of $0.000015. The meme coin has formed a bullish flag, combining a 100% surge in early May with the subsequent consolidation.

PEPE Price Chart
PEPE Price Chart

On Thursday, Pepe jumped nearly 14%, closing bullishly above the upper boundary of the flag. This breakout signals a strong upward move. The initial price target is the 50% Fibonacci level at $0.00001792, calculated by adding the flag’s height to the breakout point.

A more optimistic target is derived by adding the full length of the flagpole to the breakout point, aiming for the $0.000030 psychological level. This represents an upside potential of nearly 100% from the breakout point.

Surprisingly, this indicates the potential formation of a new all-time high for the meme coin, provided the broader market uptrend continues. Supporting the bullish case, the MACD and signal lines remain in a positive trend following a recent crossover. However, the RSI is approaching overbought territory, signaling possible pullback risks.

Currently, Pepe is trading at $0.00001538, down 4% over the past four hours. This decline appears to be a retest of the breakout level and could set the stage for a post-retest reversal.

Short Liquidations Cross $3 Million in 24 hours

Amid the bullish trend, short liquidations on Pepe have surged to approximately $3 million over the past 24 hours. As bulls take control of the spot price, the derivatives market is seeing a sharp increase in anticipation.

PEPE Derivatives
PEPE Derivatives

Open interest in Pepe has jumped nearly 20%, reaching $697 million, indicating heightened trading activity. Notably, the funding rate has climbed to 0.0227%, signaling strong bullish sentiment behind the increased activity.

This surge reflects a robust bullish narrative, one likely to fuel the next leg of Pepe’s breakout rally.

Dogecoin Targets $0.50 as Open Interest Crosses $3 Billion

Dogecoin has rallied 5% this week, testing a key resistance level amid rising bullish momentum. Will a breakout above $0.25 propel DOGE toward the $0.50 mark?

With Bitcoin trading near its all-time high, meme coins are exhibiting a bullish trend. Dogecoin, in particular, has surged more than 5% this week as part of the ongoing market recovery. The coin now hints at a potential breakout from a bullish pattern and a key resistance trendline. Could this breakout trigger a 2x rally in DOGE?

Dogecoin Price Analysis

On the daily chart, Dogecoin has rebounded from the 200-day EMA at $0.2177 this week. Currently, the price is forming its fourth consecutive bullish candle, challenging a long-standing resistance trendline that has been in place since December 2024.

Dogecoin price chart

The ongoing recovery is also testing the $0.25 supply zone, which acts as the neckline of an inverted head-and-shoulders pattern. This multi-month pattern suggests a potential 95% surge upon breakout, calculated by adding the depth of the pattern to the breakout point.

Notably, the 50% Fibonacci retracement level at $0.2566 closely aligns with the neckline, strengthening the case for a bullish breakout. The 50-day and 100-day EMAs are converging, suggesting a possible bullish crossover. The proximity of the 200-day EMA also hints at a potential golden crossover. Moreover, the daily RSI is approaching the overbought zone, indicating strong bullish momentum.

DOGE Price Targets

Based on Fibonacci levels, the triangle breakout rally will likely surpass the 100% extension at $0.4679 and target the psychological $0.50 level. The uptrend could further extend to $0.64, as projected by the 1.272 Fibonacci extension level.

Conversely, failure to break above the neckline could lead to a retest of the 38.2% Fibonacci level at $0.2227. This would likely invalidate the bullish pattern and could extend the pullback toward the 50-day EMA near $0.20.

Bulls Dominate Dogecoin Derivatives

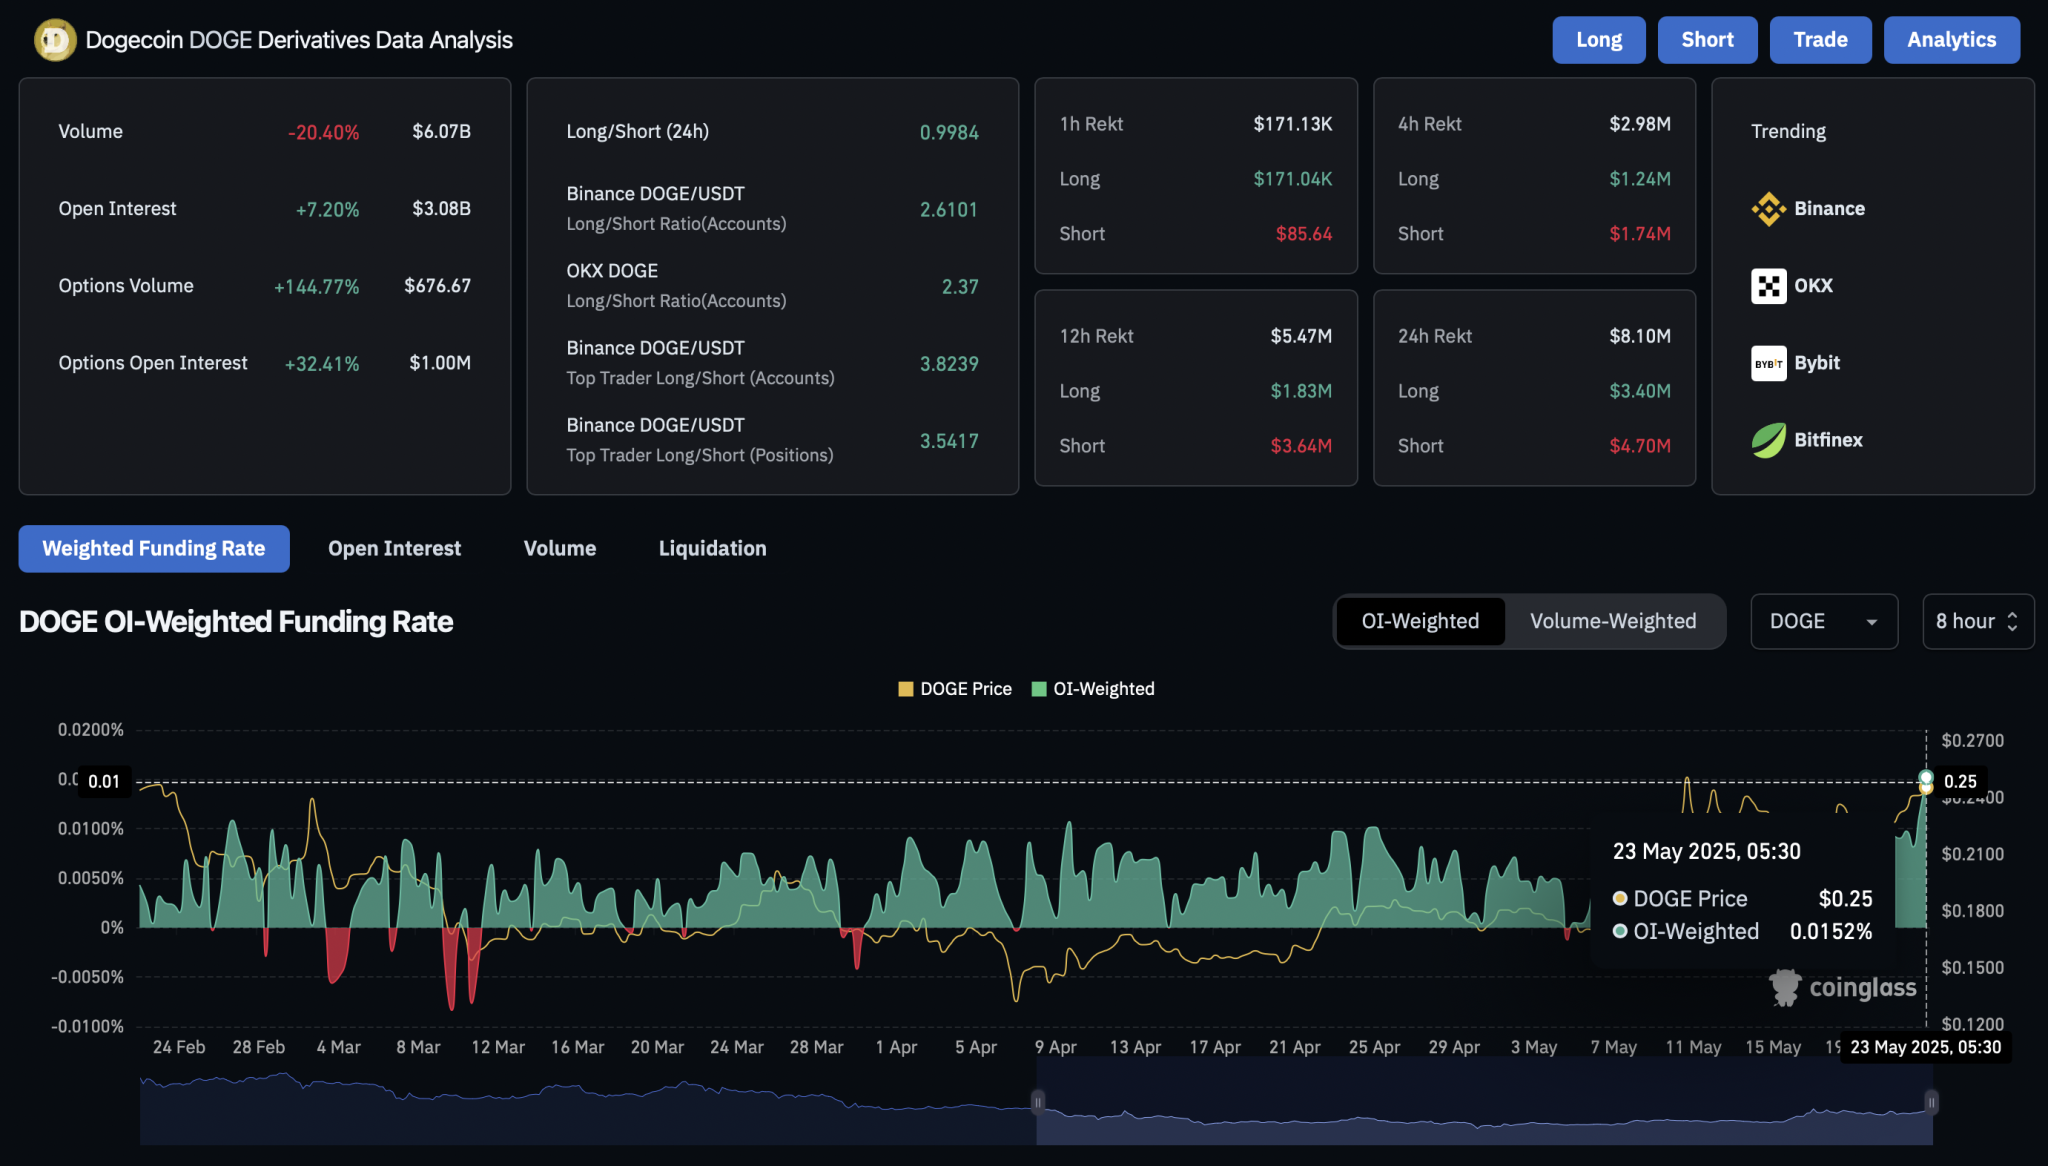
As Dogecoin stands at a critical juncture with the potential for a 2x rally, anticipation in the derivatives market has surged. The Dogecoin funding rate has risen to 0.0152%, indicating strong bullish activity.

DOGE Derivatives
DOGE Derivatives

Open interest in Dogecoin has increased by over 7%, surpassing the $3 billion mark. This highlights robust trader participation amid growing bullish sentiment.

Finally, the 12-hour liquidation data shows a $5.47 million loss, with short liquidations accounting for $3.6 million, further suggesting a bullish bias. A similar figure is visible on the 24-hour timeframe. This data indicates a strong possibility of a new, leverage-driven rally in the meme coin.

Pundit Says XRP Is Entering One of the Most Important Moments in Its History: Here’s How

XRP is stepping into what some analysts are calling a defining moment in its journey, from years of legal pushback to institutional breakout.

According to XRP community analyst “J4b1,” a convergence of critical events could soon reshape XRP’s future. Notably, at the center of the speculation is the recently launched XRP futures by the CME Group.

The CME Group’s long-awaited XRP futures went live on Monday and attracted notable volume on their first day. However, some critics point out that only 1,380 contracts of the new XRP futures have been traded over the past week, totaling $35.8 million. They view this as underwhelming given XRP’s $138 billion market capitalization.

Meanwhile, XRP proponents are interpreting the launch positively, noting that the product introduces new institutional participation to the XRP market. They believe the impact will become more apparent over time, particularly in the spot market.

In his commentary, J4b1 noted that the launch of futures for Bitcoin and Ethereum paved the way for spot ETF approvals. He believes XRP could follow a similar path.

Friendlier SEC is Green Lights Ahead

Fueling further optimism is the appointment of Paul Atkins as the new chairman of the U.S. Securities and Exchange Commission (SEC).

Atkins presents a sharp contrast to former Chair Gary Gensler. Many in the crypto industry view Atkins as more favorable toward innovation and digital asset integration. He is already acting on this vision by hosting a roundtable with crypto industry leaders to discuss regulatory pathways.

This leadership shift is critical, especially with more than 70 crypto ETF applications now at the SEC’s table. At present, the SEC is delaying its decision on XRP spot ETFs, with a new outlook now in June.

Ripple Case on the Verge of Resolution

One of the largest barriers to XRP’s growth, the Ripple vs. SEC lawsuit, is nearing final resolution. Many commentators emphasize that the case’s conclusion could open the doors for major institutions to engage more freely with XRP. Some even argue that BlackRock might file for an XRP ETF at that point.

Currently, Ripple and the SEC are working toward a resolution, hoping their revised settlement terms will receive approval from Judge Analisa Torres.

Global Momentum Building for XRP

Outside the U.S., global markets are already advancing. In Brazil, asset manager Hashdex launched the XRP H11, which has become the world’s first spot XRP ETF. The product’s success shows growing international demand and highlights XRP’s increasing presence on the global financial stage.

Political and Macro Tailwinds Strengthen the Case

J4b1 also explained that the momentum for XRP isn’t limited to regulatory developments. Political dynamics are playing a role as well.

Specifically, President Donald Trump has signed executive orders emphasizing crypto innovation and the exploration of digital assets as potential reserves. He has even explicitly referenced XRP’s potential inclusion. Such endorsements further legitimize XRP as a possible strategic reserve asset.

Additionally, hopes for geopolitical de-escalation, such as a potential peace deal between Russia and Ukraine, could reduce macroeconomic risk and drive renewed capital into risk assets like crypto.

Ultimately, J4b1 emphasized that XRP’s transformation from a speculative retail asset to an institutional-grade investment vehicle is already underway.

With futures now live, Ripple’s legal encumbrance nearing resolution, global ETFs launching, and political support mounting, J4b1 believes XRP holders are on the cusp of what could be a historic wave of price appreciation and adoption.

Here are Predicted Timelines for Shiba Inu to Reach $0.0023 or $0.047 

0

Following Shiba Inu recent gains, top entities like ChatGPT and Grok have projected when SHIB could hit loftier targets like $0.0023 or $0.047.

It has been nearly four years since Shiba Inu recorded one of the biggest rallies in crypto history. The rally, which occurred in the 2020/2021 cycle, saw the price of Shiba Inu spike over 150 million percent to $0.00008845. 

While Shiba Inu’s price has retraced heavily from that peak, several proponents remained optimistic about SHIB’s prospects. Referencing its 2021 performance, some experts argue SHIB might someday stage a rally to ambitious targets like $0.0023 and $0.047. 

This anticipation has gained momentum within the Shiba Inu community. At the time of writing, SHIB is trading at $0.00001539, representing a daily increase of 4.2%. The token’s price has also jumped by 2.3% in the past seven days and 12.31% in the past 30 days. 

It boasts a market cap of $9.06 billion, making it the 16th biggest cryptocurrency on CoinMarketCap. 

Shiba Inu Road to $0.0023 or $0.047 

Given Shiba Inu’s current price, the targets of $0.0023 or $0.047 are highly ambitious. To hit these lofty targets, the price of Shiba Inu must spike by 14,844% and 305,293%, respectively. 

If SHIB eventually hits the $0.0023 or $0.047 targets, its market cap would soar to $1.35 trillion or $27.69 trillion, respectively. Reaching any of those targets could translate to life-changing gains for early investors. 

For instance, an investor with a holding of 10 million SHIB worth $153.9 could see their investment rise to $23,000 if the price hits $0.0023. At $0.047, the value of these 10 million SHIB tokens would rise to $470,000. 

Timeline for SHIB Surge to $0.0023 or $0.047 

Despite the massive growth rate required for these predictions, AI chatbots like Grok and ChatGPT suggest SHIB can achieve the targets. While they set different timelines, each specified under what conditions SHIB could climb to the $0.0023 and $0.047 targets. 

ChatGPT’s Timeline 

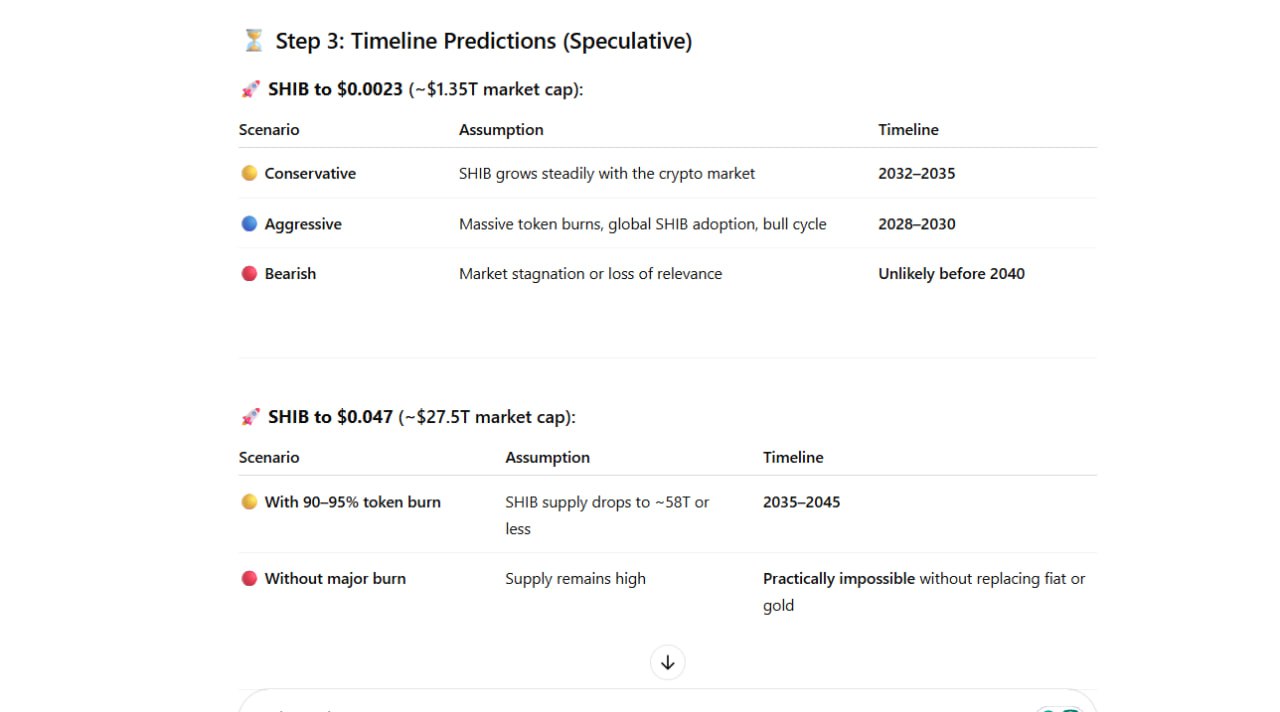
The leading AI chatbot issued three timelines for Shiba Inu’s potential surge to the $0.0023 target. According to ChatGPT, Shiba Inu might clinch the $0.0023 target between 2032 and 2035. Under this scenario, ChatGPT assumes that the price of Shiba Inu will grow steadily with the broader crypto market. 

For its aggressive forecast, ChatGPT projects that the $0.0023 prediction would materialize by 2028 – 2030, driven by factors such as a bull market, massive SHIB burn, and the token’s widespread adoption. 

Further, ChatGPT forecasts that SHIB will unlikely hit the $0.0023 target before 2040 in a bearish market scenario. 

Meanwhile, ChatGPT hinged the timeline for SHIB’s potential surge to $0.047 on token burns. It suggested that 90% – 95% of Shiba Inu’s supply must be incinerated for SHIB to stand a chance of hitting the $0.047 mark. 

If this happens, ChatGPT estimates that SHIB’s supply would decrease to 58 trillion tokens or less from the current value of over 589 trillion tokens. Accordingly, this scenario envisions SHIB’s price climbing to the $0.047 mark between 2035 and 2045. However, the chatbot thinks it is practically impossible for Shiba Inu to clinch the $0.047 target without heavy burns. 

ChatGPT timeline for SHIB surge to $00023 or $0047

Grok Forecast 

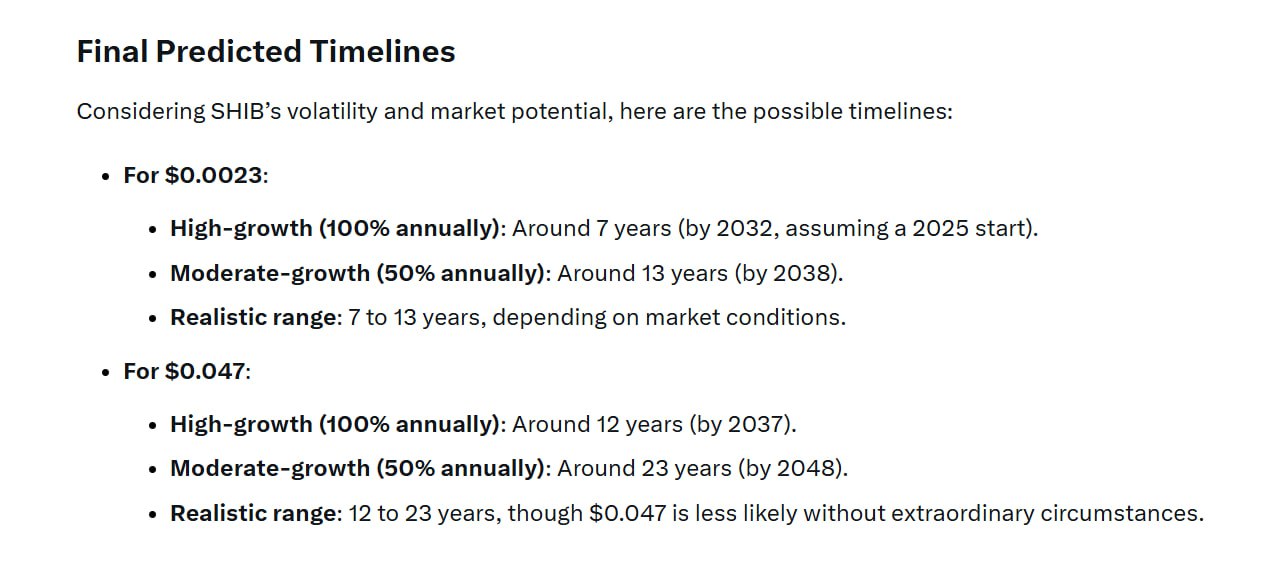
Meanwhile, X’s chatbot Grok also provided insights into when Shiba Inu would reach the $0.0023 or $0.047 targets. It structured the predicted timeline for each target under high-growth, moderate-growth, and realistic ranges. 

The chatbot sets a timeline of 7 – 13 years, specifically by 2032 – 2038, as the realistic range for SHIB’s potential surge to the $0.0023 mark. However, it emphasized that this realistic range depends on the market conditions. A favorable market condition would see SHIB clinch the $0.0023 target sooner, and vice versa. 

For the $0.0023 target to materialize under a moderate scenario, Grok speculated that SHIB must record an annual surge of 50%, potentially hitting $0.0023 by 2038.

Notably, Grok estimates that Shiba Inu will climb to the $0.0023 target by 2032, around seven years from now. In this high-growth scenario, Grok assumes that the price of SHIB will grow by 100% annually starting this year. 

On the other hand, it set a timeline of 12 to 23 years for Shiba Inu’s potential surge to $0.047. Despite this, it emphasized that Shiba Inu is unlikely to soar to the $0.047 target without extraordinary circumstances like massive token burns. 

Notably, Grok predicted that SHIB could hit $0.047 by 2048 if its price grows 50% annually, starting from this year. It expects Shiba Inu to achieve the milestone sooner, specifically by 2037, if its price grows 100% annually over the next 12 years. 

Grok timeline for SHIB surge to $00023 or $0047

Other Predicted Timelines for Shiba Inu’s Surge to $0.0023 or $0.047 

According to Changelly experts, the $0.0023 target will come to fruition by February 2040, while the $0.047 prediction will unlikely happen before 2050. Popular prediction platform Telegaon forecasts that Shiba Inu will clinch both targets between 2036 and 2039. 

It is worth mentioning that this analysis is for informational purposes and does not guarantee that SHIB will clinch the $0.0023 or $0.047 targets within the projected timelines. Investors must conduct due diligence before committing to crypto assets like Shiba Inu. 

Cardano Rejected at $0.84: Will the Dip Deepen to $0.72?

Cardano rose 15% following a breakout from a falling channel but failed to break through resistance at $0.84. A bearish engulfing candle now suggests the possibility of a deeper correction.

As altcoins continue to climb, while Bitcoin holds steady around $110,000, Cardano has posted a modest 2.6% gain over the past 24 hours. However, despite holding above $0.80, a short-term pullback warns of a potential steeper correction as ADA reverses from a key resistance level.

Cardano Price Analysis

On the 4-hour chart, Cardano displays a double-bottom reversal from $0.7225, confirming a breakout from a falling channel pattern. The resulting rally led to a 15% gain, peaking at the critical $0.84 supply zone.

Cardano Price Analysis

Currently, Cardano is down nearly 4% over the past four hours, failing to break above the $0.84 resistance level and forming a bearish engulfing candle. This suggests bullish exhaustion and a likely deeper pullback.

Supporting the bearish outlook, the 4-hour RSI has dropped sharply from the overbought region, reflecting a sudden decline in bullish momentum. However, the MACD and signal lines remain in a positive trend, with bullish histograms still intact, indicating a lack of clear bearish crossover.

According to trend-based Fibonacci levels, the failure to hold above the 50% Fibonacci level at $0.8253 signals a potential trend reversal. The bearish engulfing candle also highlights increased selling pressure.

Price action indicates mild support near $0.7745, followed by stronger support at $0.7225.

Cardano Bullish Positions Worth $943K Wiped Out in 4 Hours

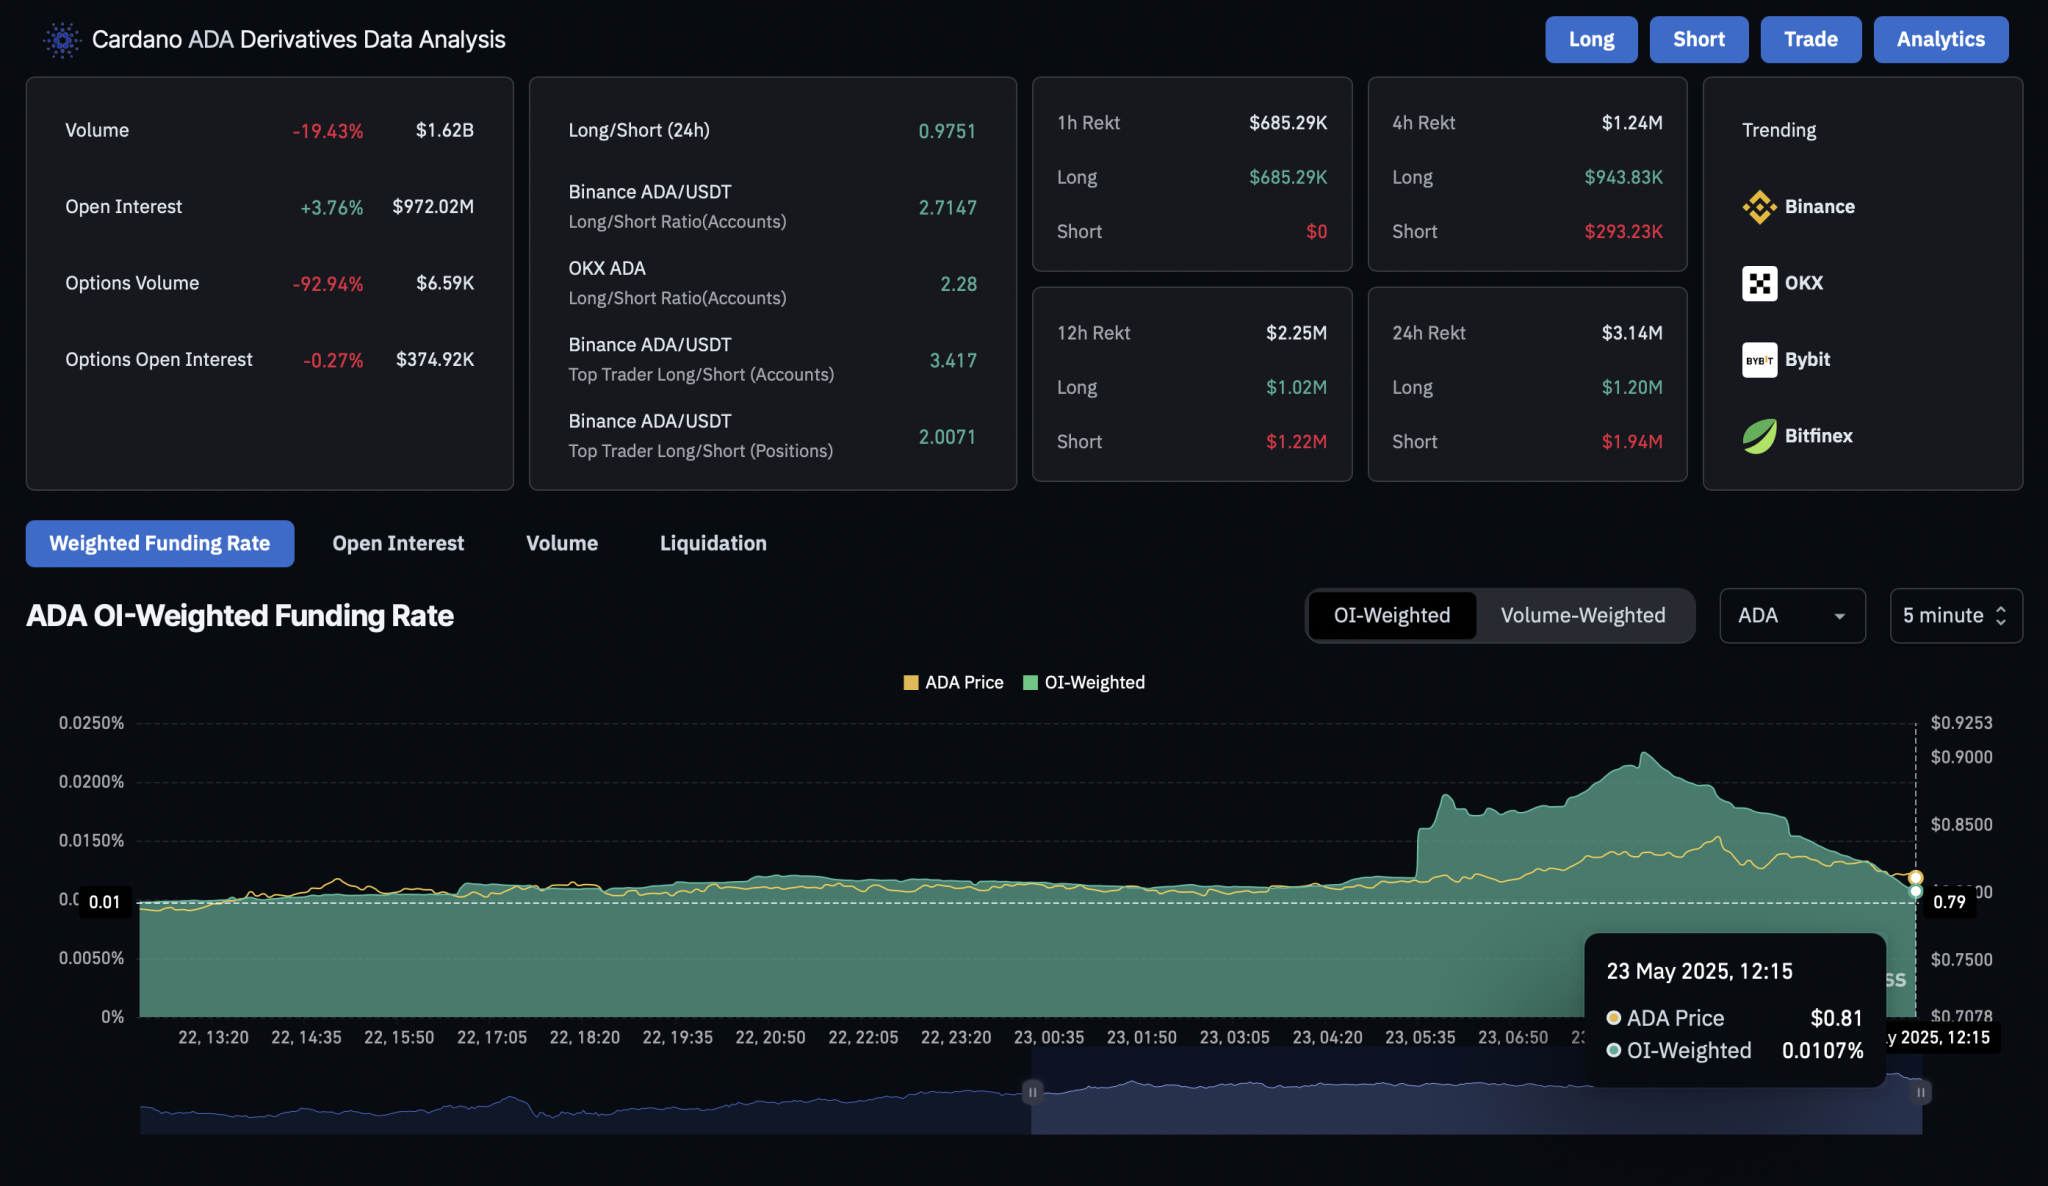
As Cardano experiences a steeper correction, long liquidations in the past four hours have totaled approximately $943,000. Additionally, the funding rate has sharply dropped from a peak of 0.0212% to 0.0107%, reflecting a significant decline in bullish sentiment among derivative traders.

ADA derivatives
ADA derivatives

Despite rising bearish sentiment, open interest remains steady at $972 million, with a 3.76% increase in the past 24 hours. This suggests that trading activity continues to grow despite short-term market volatility.

ADA Records 30% Quarter-on-Quarter Growth in Stablecoin Market Cap

Looking beyond the short-term correction, the on-chain analytics platform Messari recently highlighted strong growth metrics for the Cardano network. With increasing DRep (Delegation Representative) participation, the stablecoin market on Cardano has grown by 30%, while the DeFi diversity score has risen by 13%.

The report also notes a 5% increase in Cardano’s treasury balance (in ADA), signaling growing ecosystem support. As the Cardano network expands, rising demand for ADA could support a rebound in spot prices.

Top Analyst Says Good Things Take Time, Insists Dogecoin Ready to Curl Up from Here: Here’s His Price Target

0

Dogecoin could be raring to swing to higher prices, as a well-followed analyst has identified a string of bullish confirmations on the asset’s chart.

Momentum seems to be building on Dogecoin. The largest meme coin by market cap posted its third consecutive intraday positive close yesterday, following a broader market trend.

Dogecoin has appreciated 8.55% in its current three-day run, fueling positive sentiments of a further price uptick. A recent analysis agrees with this escalating bullish price expectation, stressing that DOGE is ready for its next leg up.

Good Things Take Time: Analyst

While Dogecoin has increased 10% in the past seven days, mirroring Bitcoin’s trend to a new all-time high, it remains 22% below its price at the start of the year. Remarkably, only Bitcoin, XRP, and Tron have had positive year-to-date price action, growing 19%, 17%, and 8%, respectively.

Meanwhile, analyst Rekt Capital encouraged Dogecoin enthusiasts to remain optimistic despite the token’s underwhelming price performance. In an X post on Thursday, May 22, he emphasized that good things take time.

Nonetheless, he identified a string of positive developments on the Dogecoin chart, signaling an impending upward price acceleration. One of which is DOGE’s successful retest of a key support area.

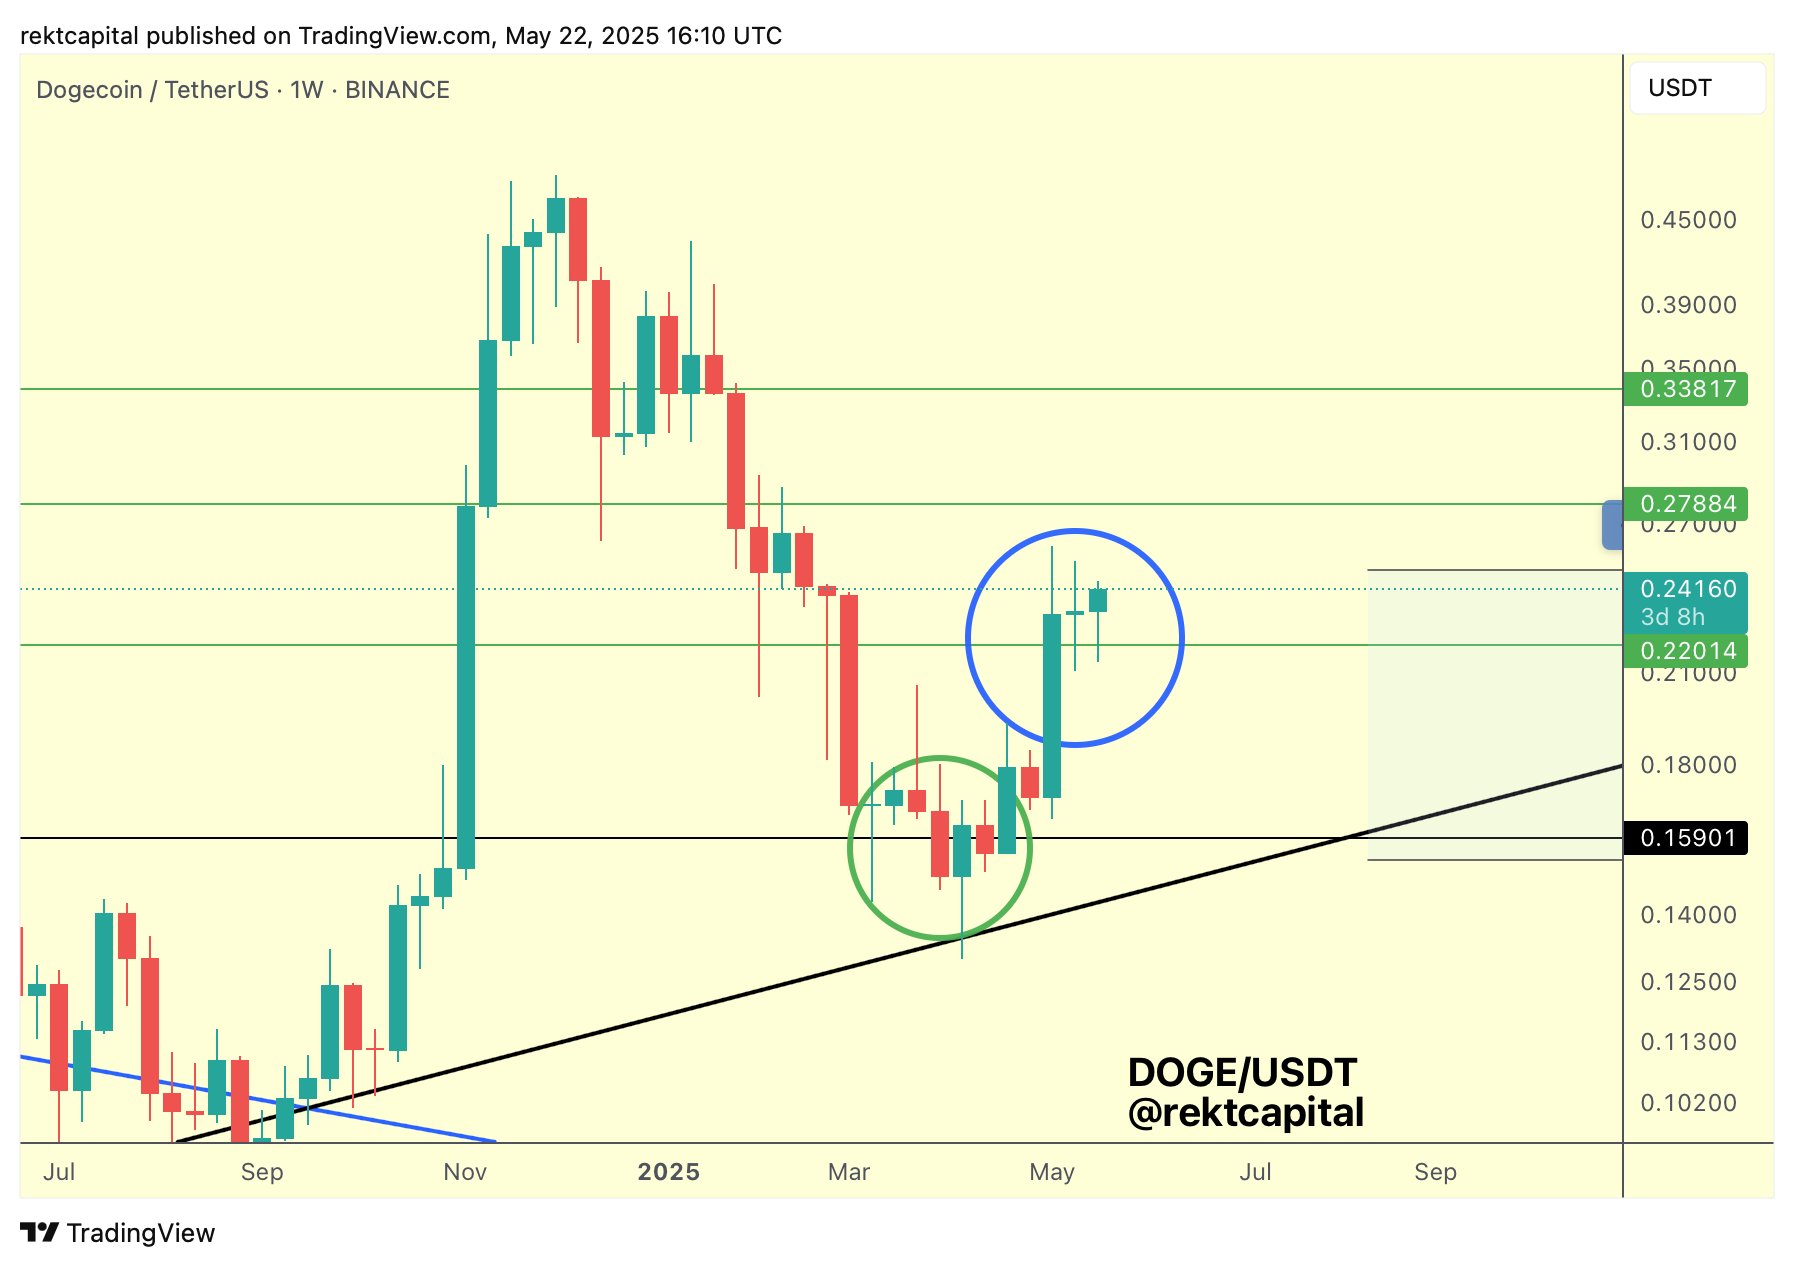
An accompanying DOGE 1W chart shows that the meme coin rallied from a support at $0.231 last week to an intra-week high of $0.253 before relinquishing some of its gains. On Monday, Dogecoin also retested the demand zone and received a notable lift, as it did the previous week.

Dogecoin Analysis | Rekt Capital

With the support holding firm, Rekt Capital has identified the trend as positive for Dogecoin. Furthermore, the market watcher highlighted an early-stage higher low formation on the weekly timeframe with Monday’s downward wick.

The candlestick pattern, in addition to the momentum from the successful support retest, formed the basis for the analyst’s suggestion of a sustained bullish price development. He asserted that DOGE looks ready to curl up from here, providing possible price targets.

Possible Price Targets

His chart shows two targets for Dogecoin if bullish momentum sustains. First, he highlighted a nearly 16% upsurge from the current market price to the resistance at $0.278, a price mark last seen in February.

Ultimately, DOGE would rally further to the second target at $0.338, a 41% strout from its current price. However, Rekt Capital warns of the importance of price stability, noting that realizing these targets depends on it.

Meanwhile, several other analyses have suggested higher prices for Dogecoin. Specifically, The Crypto Basic recently reported a commentary from Chris predicting a rally to $1 amid a breakout from a long-standing resistance trendline.

Moreover, Dogecoin’s recent integration into the Solana ecosystem further boosts the mood around the asset. At the time of writing, DOGE trades at $0.246.

Pundit Says You Can Accumulate XRP Cheap Now, Soon Its Price Will Be $1,000 per Coin

Widely followed XRP commentator BarriC is again urging the crypto community to buy as much XRP as they can while the price remains low.

He emphasized that XRP is still undervalued below $3, but in the coming years, it could stabilize at a staggering $1,000 per coin.

XRP Below $3 Is a “Failure”? Not for Long, Says BarriC

In a recent tweet, BarriC presented a case for long-term accumulation. He argued that despite XRP trading at $2.35, many still consider its performance underwhelming. 

For context, at this price, XRP is up 356% year-over-year, a gain that outpaces those of BNB, Ethereum, and Solana. However, concerns about XRP’s performance have intensified recently, as its progress has stalled since January.

Meanwhile, BarriC suggests that sentiment may shift dramatically if XRP follows the trajectory he anticipates in the coming months. He predicts that XRP will climb to $10 and then $20 per coin in the near term. He expects this range to mark XRP’s new all-time high during the anticipated alt season rally.

BarriC also cautions that the market could follow historical patterns, with a 50% correction after reaching $20. In this scenario, the $5 to $10 range would become the new entry point during the bear cycle, which would still be significantly higher than today’s price. 

This leans toward his view that anything under $3 is a steal for XRP when considering its future potential.

Utility-Driven Growth Could Take XRP to $1,000

Looking beyond the current cycle, BarriC sees a future in which XRP becomes the backbone of global finance. He projects a scenario where banks and financial institutions worldwide adopt XRP for daily transactions and cross-border settlements.

In this case, he believes demand for the token would surge, driving its price to $1,000 per coin. At that level, BarriC contends XRP would no longer experience the wild volatility of past years. Instead, it would function as a stable financial infrastructure asset, with trillions of dollars flowing through its network regularly.

This commentary taps into a growing narrative among XRP supporters that the token’s utility, not mere speculation, will ultimately drive its value. Ripple’s ongoing collaborations with central banks, real-time payment systems, and liquidity providers add weight to this long-term vision.

Notably, BarriC expects this $1,000 price point to materialize within the next decade. Other market commentators share a similar perspective, suggesting it could happen by 2035 or later.

However, critics often highlight weaknesses in this lofty price prediction. For instance, reaching a triple-digit valuation from its current level would require XRP’s price to rise by 42,450%.

Achieving a $1,000 price would also necessitate a market cap of over $58.5 trillion, an outlook many consider unrealistic. Despite skepticism surrounding such ambitious targets, some XRP proponents continue to advocate for them.

Japan Warms up to Cardano, Pushing ADAJPY to Second in Global Volume at $121M

0

Traders in Japan appear to be warming up to Cardano amid a rise in ADA trading, as they recently pushed the ADA/JPY pair to the second rank in global trading volume.

Cardano’s ADA token saw a strong uptick in price over the past week, climbing from around $0.72 to above $0.83 by May 23. While this 15% weekly gain drew attention across markets, trading data revealed a more unexpected development: a significant surge in the ADA/JPY trading volume.

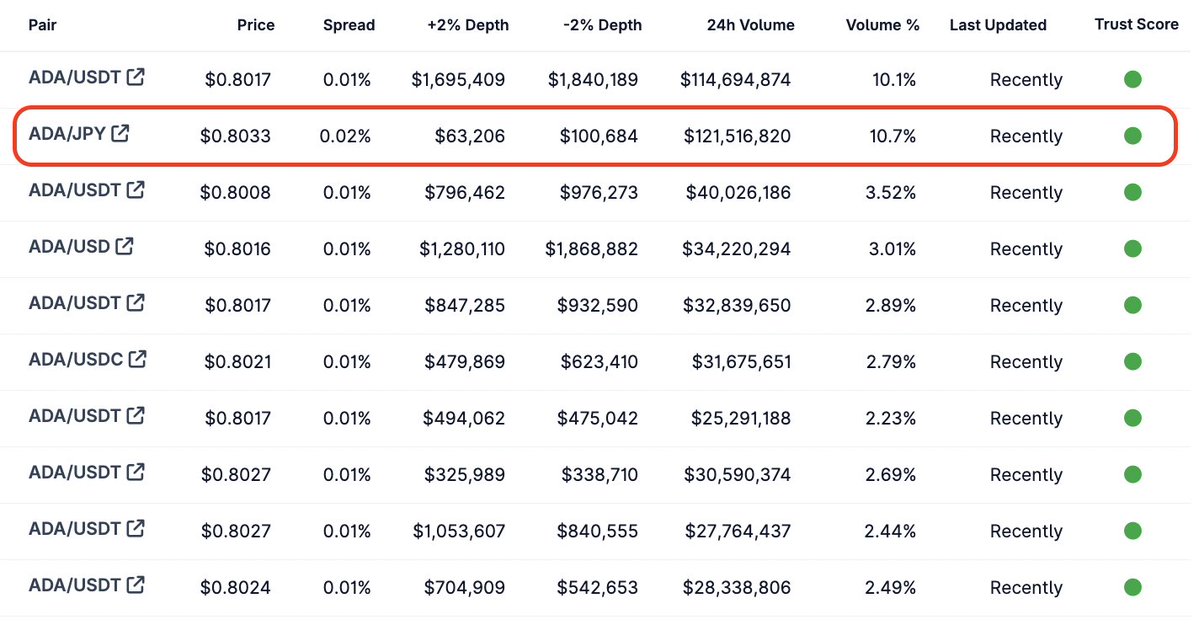
This pair, long overshadowed by ADA/USDT, rose sharply to become the second highest globally among ADA pairs in 24-hour volume. Trading activity for the ADA/JPY pair reached $121.5 million, accounting for 10.7% of all ADA trading and surpassing even ADA/USDT, which posted $114.6 million in volume at 10.1% share.

Image

Trading Volume Shifts Toward Yen

However, data shows the pair has lower liquidity when compared to the USDT pairs. This means there is $63,206 worth of demand (bids) and $100,684 worth of supply (asks) within a 2% price band around the current ADA/JPY price.

In contrast, ADA/USDT pairs reported deeper order books, with the top most exceeding $1.6 million on either side. These differences in liquidity suggest that while interest from Japanese markets is high, trading conditions remain thinner and potentially more volatile.

Price discrepancies also emerged during the period. ADA traded slightly higher against the yen, with the ADA/JPY rate at $0.8033, compared to the ADA/USDT range of $0.8017 to $0.8027.

Spreads for the yen pair also widened slightly to 0.02%, while USDT pairs maintained a tighter 0.01% spread. Despite the higher volume, these indicators pointed to more fragile market depth in the yen-based pair.

Historical Ties and Recent Developments in Japan

The latest trading activity follows a broader trend of reengagement between Cardano and Japan. Cardano’s founder, Charles Hoskinson, visited a prominent Japanese lawmaker earlier this year, amid discussions of regulatory changes in the country. 

These included proposals to lower crypto taxes and revise digital asset classifications. The visit came as Japan worked to improve its crypto environment, potentially influencing investor confidence.

Japan’s connection to Cardano dates back to its origins. According to history, Cardano was conceptualized in Osaka in 2015, and its initial token sale from 2015 to 2017 drew over 90% participation from Japanese investors. Cardano even hosted a launch event in Tokyo, reinforcing its early ties to the region.