Home Blog Page 733

Investors Sue MicroStrategy Over Misleading Bitcoin Financial Disclosures

0

Pomerantz LLP has filed a class action against Strategy (formerly MicroStrategy) and its executives over the company’s Bitcoin investments and related financial disclosures. 

The New York law firm recently filed the class action in the U.S. District Court for the Eastern District of Virginia. Notably, the plaintiffs include investors who acquired Strategy stock between April 30, 2024, and April 4, 2025. 

The class action alleged that Strategy violated federal securities laws and hopes to pursue remedies on behalf of investors under Sections 10 (b) and 20 (a) of the Securities and Exchange Act. 

Allegations Against Strategy 

According to the complaint, Strategy misled investors during the class period by changing its accounting practices without adequately disclosing the implications. It noted the company has accumulated and held Bitcoin since 2020 as part of its long-term strategy.

The complaint states that Strategy financed its Bitcoin purchases using cash reserves, as well as proceeds from equity and debt financing. It also notes that the company has referred to itself as a “Bitcoin Treasury Company.”

In support of this strategy, Strategy introduced new key performance indicators (KPIs), including BTC Gain, BTC Yield, and BTC $ Gain, to help investors evaluate the performance of its Bitcoin holdings.

Change in Accounting Model 

Meanwhile, on January 1, 2025, Strategy adopted the FASB’s Accounting Standards Update (ASU 2023-08), which requires companies to record their cryptocurrency holdings at fair value in financial statements.

Previously, Strategy used a cost-less-impairment accounting model, under which Bitcoin impairments were recorded only when the asset’s price fell. Unrealized gains were not recognized unless the assets were sold.

The plaintiffs argue that Strategy failed to adequately warn investors about the new accounting model’s risks and overstated its profitability under the fair-value approach.

In addition, the complaint alleged that Strategy understated the potential losses it might record on its Bitcoin holdings under fair-value accounting. According to the plaintiffs, investors suffered significant losses after Strategy announced an unrealized loss of $5.91 billion in Q1 2025. 

As a result, the price of its common A stock crashed 8.67%, or $25.47 per share, to $268.14 on April 7. According to the complaint, the company later admitted in a public statement that the $5.9 billion net loss stemmed directly from applying the fair-value accounting standard on its Bitcoin holdings. 

Consequently, Pomerantz is seeking to recover damages on behalf of affected investors.

Strategy Buys More Bitcoin

Meanwhile, Strategy seems unbothered by the class action as it announces the acquisition of 7,390 BTC worth $764.9 million. The company made the disclosure today in a filing submitted with the U.S. SEC. 

At press time, the company holds 576,230 BTC acquired for $40.18 billion, each costing $69,726. With Bitcoin currently trading at $103,745, Strategy’s Bitcoin stash is valued at $59.78 billion.

Cardano Founder Promises Audit to Debunk Claims of Misappropriating $600M in ADA Tokens

Cardano founder Charles Hoskinson announced that the Cardano Foundation will soon release an audit to counter rising accusations of financial misconduct. 

The disclosure comes nearly two weeks after NFT artist Masator Alexander alleged that Hoskinson unilaterally altered the Cardano ledger to take control of 318 million ADA, worth over $600 million at the time, and failed to provide transparency on how he used the funds.

Claims of Misappropriation of $600M in ADA

Specifically, on May 6, Alexander questioned a 2021 transaction that involved the movement of 350 million ADA, plus an additional 25 million from staking rewards, using Cardano’s genesis keys. 

He claimed this action required custom code and accused Hoskinson of using it to fund Intersect. He pointed out that Intersect reportedly spent less than $10 million in its first year, questioning what happened to the rest of the money.

Robert, a Cardano supporter, noted that the original 350 million ADA had been allocated nearly five years ago and contributed to infrastructure advancements like decentralized staking, Hydra, and Bitcoin interoperability. 

In response, Alexander stated that Input-Output Global (IOG) originally received 2.4 billion ADA during the genesis event, and the 350 million ADA transaction occurred years later in 2021. He insisted that special access was used to move unclaimed ICO funds into reserves controlled by Hoskinson and IOG. 

However, Hoskinson denied these claims, stating that the original buyers had already redeemed most of the 350 million ADA and used the remaining forfeited funds to seed Intersect.

Further Details 

Meanwhile, on May 7, Alexander released a detailed thread on X. He alleged that the 2021 “Allegra” hard fork included hidden functionality that erased ICO-related unclaimed ADA and added it to the reserves. 

He outlined what he described as a two-step maneuver to carry this out. According to him, this first involved the sweeping of 318 million ADA into reserves via a protocol change, and second, the use of a Move Instantaneous Rewards (MIR) transaction to withdraw the funds.

Alexander questioned the legitimacy of the redemption process and challenged the lack of public accounting. He claimed that only a fraction of the ADA was ever used for Intersect. Alexander pointed to public statements by its interim executive director, Jack Briggs, who disclosed that the organization was seeded with only around $7 million. 

Hoskinson Promises Audit

Amid the mounting pressure, Hoskinson took to X on May 18 to address the backlash. He announced that the Cardano Foundation would release an audit to clarify the matter. 

He also expressed disappointment over the reactions from some in the community, saying that the ordeal revealed who his true allies were. Hoskinson stated that the situation had deeply hurt him and led him to reconsider how he would engage with the public going forward.

Further, he revealed plans to hand over his X account to a media team and change the format of his popular AMAs and public discussions.

Crypto Asset Inflows Reach $785M as Ethereum Sentiment Turns Bullish

Crypto asset investment products, led by Bitcoin and Ethereum, have continued their recovery streak, recording $785 million in inflows at the end of last week.

The latest record marks the fifth consecutive week of positive flows, pushing the year-to-date (YTD) totals to $7.5 billion. Specifically, the rebound fully offset the February–March correction that saw nearly $7 billion in outflows.

U.S. Dominates Inflows, While Canada and Sweden Lag

The United States led regional inflows with $681 million, bolstered by demand for U.S.-listed ETFs, particularly from BlackRock’s iShares Trusts. Specifically, BlackRock’s Bitcoin and Ethereum ETFs registered inflows of $908 million. However, outflows from other issuers like Grayscale and Fidelity weakened the cumulative weekly flows of the U.S. ETF market.

Meanwhile, Germany followed with $86.3 million, improving the monthly flows to $130.5 million. Hong Kong added $24.2 million, its largest weekly inflow since November 2024. In contrast, sentiment remained bearish in Canada, Brazil, and Sweden. 

Sweden posted the largest weekly outflow at $16.3 million, while Canada and Brazil saw $13.5 million and $3.9 million in redemptions, respectively.

Ethereum Reclaims Investor Confidence

Notably, Ethereum emerged as the standout performer, attracting $204.9 million in inflows for the week. This marks a strong shift in sentiment amid the success of the Pectra upgrade. 

In the spot market, Ethereum experienced a massive price improvement, soaring 17% from the weekly low of $2,344 to over $2,730. With $575 million in YTD inflows, Ethereum is showing signs of renewed institutional interest after a relatively slow start to the year.

Bitcoin Leads, but Momentum Slows

Meanwhile, Bitcoin continued to dominate asset flows with $557 million in inflows, although momentum eased slightly compared to previous weeks. According to CoinShares, the softer flows could reflect investor caution following continued hawkish signals from the U.S. Federal Reserve. 

Notably, short-bitcoin products saw $5.8 million in inflows, indicating that some investors were hedging against possible downside risk.

Mixed Signals for Altcoins

XRP products attracted $4.9 million in weekly inflows, contributing to a YTD total of $263 million. Meanwhile, Sui continued to gain modest traction, adding $9.3 million. 

However, Solana saw outflows of $0.9 million, its second consecutive week in the red. Multi-asset products also reported outflows of $2.9 million, reflecting a more selective approach from investors.

Analyst Insists Dogecoin Could See a 174% Climb to Its First Target of $0.6533

0

Analyst Javon Marks maintained his bullish outlook on Dogecoin, citing a confirmed breakout and a sustained bullish price structure.

Dogecoin has experienced notable pressure in recent days after pumping hard in the past weeks. Its price has now dipped from $0.25 to $0.21. The token has made modest recovery attempts, including a brief move above $0.23 around May 17–18. 

However, as of today, DOGE is trading at the $0.21 range, with a massive 12% weekly loss. While this short-term volatility has drawn attention, analysts remain focused on long-term technical developments that may suggest broader market shifts.

Dogecoin to $0.6533?

For instance, analyst Javon Marks has reiterated his April 22 target for Dogecoin, based on a multi-year trend reversal. According to a previous chart shared by Javon Marks, Dogecoin completed a breakout above a multi-year descending resistance in late 2023.

This trendline had been intact since the meme coin’s peak near $0.70. The breakout followed a prolonged pattern of lower highs and lower lows, signaling a structural change. Since then, Dogecoin has maintained a series of higher highs and higher lows, often considered a key bullish indicator.

Supporting this view, a recent retracement found support at approximately $0.16, forming a new higher low. This development adds weight to the emerging bullish structure. 

Based on this pattern, Marks has maintained a price projection of $0.6533, representing a 200.79% increase from the current level of $0.2172. The analyst’s additional targets include Dogecoin’s potential run to its former all-time high of $0.74 and $1.25111.

$0.26 Resistance Zone Remains a Technical Barrier

Meanwhile, market analyst Ali Martinez emphasized the significance of the $0.25 to $0.26 resistance area on the 3-day timeframe. Since late 2024, this zone has repeatedly acted as a ceiling for Dogecoin’s price action.

After serving as support in December 2024, the region flipped into resistance in early 2025. Since then, Dogecoin has failed multiple breakout attempts.

In February 2025, the price touched $0.28 but quickly reversed below $0.15. Another push in March saw the price exceed $0.19, yet it again fell short of breaking through. The most recent test in May 2025 saw DOGE hit $0.24, only to close at $0.2276, underscoring continued selling pressure.

According to Martinez, a sustained move above this zone would be significant, though he urged caution and preparation before such a breakout occurs.

Renewed Network Engagement

While technical resistance remains, on-chain data from IntoTheBlock indicates increasing activity on the Dogecoin network. Key usage metrics have surged over the past seven days, suggesting heightened user engagement. New addresses rose by 102.40%, while active addresses increased by 111.32%. 

Dogecoin Daily Active Addresses

Additionally, zero balance addresses, often seen as indicators of network turnover or recent activity, climbed by 155.38%.

This rise in activity comes amid the broader market rally, indicating that Dogecoin’s user base is becoming active again amid recent improvements.

Ethereum Dips to $2,400 Amid Market Correction: Is $2,200 Next?

As Ethereum falls below $2,400 and trades under the 200-day EMA, technical analysis warns of a potential correction to $2,200.

With Bitcoin dropping back below the $103,000 mark, Ethereum is now trading at $2,400. As the broader market correction gains momentum, Ethereum faces the risk of a deeper decline toward the $2,200 level.

Ethereum Price Analysis

On the daily chart, Ethereum’s price action shows a bullish breakout from a falling channel pattern, completing a rounding bottom formation. The neckline of this bullish pattern aligns with the 50% Fibonacci retracement level near $2,700.

Ethereum price Chart
Ethereum Price Chart

However, the failure to break above the neckline has triggered a pullback toward the 38.20% Fibonacci retracement level near $2,400. With an intraday drop of 3.74%, Ethereum is currently trading at $2,403, below the 200-day EMA.

After rebounding from a 24-hour low of $2,349, Ethereum is struggling to hold above the key Fibonacci support. The short-term pullback is also signaling a potential bearish crossover between the MACD and signal lines. If confirmed, this negative crossover could indicate a deeper correction, potentially invalidating the bullish pattern.

Meanwhile, the immediate support below the 38.20% Fibonacci level lies at the 100-day EMA, currently around $2,193, followed by the psychological support at $2,000.

On the bullish side, Ethereum could rally toward the $4,000 mark if the broader market stabilizes, based on the rounding bottom breakout pattern.

Analyst Spots Rising Whale Support for Ethereum

According to a recent tweet by crypto analyst Ted Pillows, ETH whale holdings have significantly increased over the past few weeks. Citing data from CryptoQuant, the analyst highlights that the balance held by addresses with 10,000 to 100,000 ETH has risen to 16.79 million ETH.

This increase represents a $1.25 billion surge in whale holdings over the past month. This highlights growing confidence among large investors in Ethereum’s long-term potential.

Specifically, Pillows stressed that the development is a bullish signal, saying, “My bags are ready.”

Image
Ethereum whale and price chart by CryptoQuant

Bitcoin Slips Below $103K After Moody’s US Downgrade: Is $100K in Danger?

Bitcoin dropped 3.62% to $102,666 after Moody’s downgraded the US credit rating. Bearish signals point to a test of $100K, with support at $95K to $91K.

With Moody’s downgrade of the US credit rating from AAA to AA1, there has been a major pullback in both the US and crypto markets.

The agency cited the ballooning $36 trillion national debt and rising interest costs as key drivers behind the cut, its first since assigning the U.S. a top-tier “Aaa” rating in 1919.

Today, Bitcoin is down 3.62%, trading at $102,666. Will this intraday pullback lead to a breakdown of the $100,000 milestone?

Bitcoin Price Analysis

Bitcoin’s daily chart highlights a strong price reversal from the 50% Fibonacci level near the $75,500 supply zone, resulting in a near 40% rise, with the recent 24-hour high at $107,115.

However, the intraday pullback undermined Sunday’s 3% gain, forming a bearish engulfing candle.

Bitcoin Price Chart
Bitcoin Price Chart

Increased supply pressure due to broader market fears, uncertainty, and doubt has caused short-term panic. The bearish engulfing candle forms near the strong overhead supply zone around the $106,000 mark, threatening a potential bearish trend reversal.

Supporting the downside risk, the MACD and signal lines have given a bearish crossover. According to the price action, the immediate support lies at $98,349 if the $100,000 psychological support level fails.

However, the Fibonacci levels indicate stronger support at $91,780, at the 78.60% level. This suggests a downside risk of nearly 10%. Additionally, a crucial support level exists at $95,269, marked by the 50-day exponential moving average. The dynamic average support is known for providing strong support, helping maintain the uptrend.

Conversely, a potential reversal in the short-term price trend could push Bitcoin to a new all-time high, surpassing the $109,356 level. The Fibonacci levels suggest an upside potential to reach $127,800 at the 1.272 level.

Liquidations Spike as Bitcoin Futures Open Interest Drops After Crossing $70 Billion

Following the intraday pullback, the derivatives market saw a sharp shift in trading activity. Earlier today, Bitcoin open interest reached a new all-time high of $70.03 billion before pulling back to $67.54 billion. This suggests a significant decline in bullish sentiment due to the intraday pullback.

BTC Derivatives Data

Over the past 24 hours, short liquidations in Bitcoin rose to $93.81 million, while long liquidations totaled $81.97 million. The intraday pullback led to a sharp drop in bullish sentiment in the derivatives market.

Raoul Pal Says XRP Will See Another Leg Up: Here’s Why

Market veteran Raoul Pal expects XRP to observe another leg up from its current position amid the ongoing consolidation phase.

Notably, Pal’s sentiments, shared in the latest Rekt Vision podcast episode, build on a bull flag pattern that has emerged on the weekly XRP chart this year. The ongoing consolidation, which has kept XRP around the $2 price mark, is an integral part of this bull flag.

A bull flag is a continuation pattern consisting of a flagpole, which represents the asset’s initial price run, and a flag, which marks the consolidation after the initial rally. A breakout above the flag often leads to a resumption of the rally.

XRP Forms Bull Flag

For context, XRP’s bull flag started in November 2024, when the asset broke out following President Donald Trump’s victory in the U.S. election. CNBC confirmed that XRP was one of the biggest beneficiaries of the ensuing market-wide uptrend.

The asset soared 580% from $0.5 in November 2024 to a seven-year high of $3.4 by mid-January 2025. Notably, this exceptional run resulted in the formation of the pattern’s flagpole.

XRP Weekly Bull Flag

However, XRP faced massive resistance at the $3.4 peak, leading to a pullback that eventually pushed prices below $2. Nonetheless, XRP recovered above the $2 mark, but the recent market dynamics have led to an equilibrium, with XRP stuck in a consolidation for the past four months.

Raoul Pal Expects Another Leg Up for XRP

Data from Pal’s chart shows that the asset has since been witnessing lower highs on the weekly chart, confirming that the bears have a slight edge. Despite this, the market veteran is confident XRP would witness a breakout.

XRP 1W Chart Raoul Pal
XRP 1W Chart | Raoul Pal

Accordingly, he suggested that there is going to be “another leg up” for XRP from the current position. Pal admitted that despite not being involved in XRP, the XRP chart is “something to behold,” indicating that the asset is positioned for an impressive uptick from here.

Recall that Pal was once an XRP critic, even previously advising investors to abandon the asset and move into something with better potential. At the time, XRP remained stuck at $0.5. However, following the November 2024 breakout, Pal turned bullish, persistently insisting that the asset could see another uptick.

Possible Breakout Target

Notably, the analyst failed to present any price target, but data from the chart gives some insights into XRP’s potential goal. For context, following a breakout from a bull flag, the target is achieved by adding the length of the flagpole to the breakout price.

According to the chart, XRP could break out above the flagpole if it decisively closes above the $2.6 resistance level in the weekly timeframe. With the length of the flagpole, from the November 2024 rally, amounting to $2.9, this translates to a breakout target of $5.5. XRP currently trades for $2.31, requiring a 138% rise to hit $5.5.

Bitcoin Records Strongest Weekly Close in History at $106,446: What’s Next?

0

Bitcoin reached a new local peak on May 18, trading above $106,000, its highest point since January.

Interestingly, Bitcoin closed at $106,446 yesterday, marking BTC’s strongest weekly close on record. Previously, Bitcoin recorded its highest weekly close in January at $106,146, shortly after hitting an all-time high of $109,358 on January 20.

However, Bitcoin’s late-weekend rally was brief. The price fell sharply to $102,000, with the current price hovering around $102,761. This reflects a 0.89% dip over the last 24 hours and a 1.81% decline on the weekly scale. At its current price, Bitcoin is about 5% below its peak.

Notably, recent volatility in Bitcoin appears to follow key political developments in the U.S. Specifically, President Donald Trump’s legislative package, the “One Big Beautiful Bill Act,” recently advanced out of the House Budget Committee.

This bill includes a proposed 5% tax on remittances sent abroad by non-citizens, raising concerns over cross-border capital flows and potentially driving interest in decentralized alternatives like Bitcoin.

Secondly, anticipated regulatory action may be influencing investor sentiment. This week, the U.S. Congress will review a long-awaited bill establishing a legal framework for stablecoin issuers. This bill signals a possible step toward integrating crypto into traditional financial regulation.

Volatility Drives Record-High Derivatives Activity

In the past week, Bitcoin traded within a narrow yet turbulent band of $101,000 to $106,000. This volatility coincided with a notable surge in derivatives activity, underscoring heightened market engagement. 

According to Coinglass data, Bitcoin derivatives volume climbed 135.74% to reach $156.52 billion in the last 24 hours. This indicates a significant spike in trader participation.

Meanwhile, open interest rose modestly by 2.63%, totaling $68.12 billion. This increase, while measured, suggests that traders are opening new positions without signs of market overheating. 

Options markets showed even more aggressive movement. Daily options volume jumped 341.75% to $4.67 billion, while options open interest advanced 2.51% to $39.58 billion. 

Bitcoin Derivatives Data

Bidirectional Pressure as Market Adjusts

Alongside the derivatives spike, liquidation data revealed sharp shifts in trader sentiment. Over the last four hours, $34.10 million in positions were liquidated, with $32.99 million coming from longs.

This shows that sudden downside price action caught many bullish traders off guard. The 12-hour liquidation chart shows $113.47 million was wiped out, split between $65.60 million in long positions and $47.88 million in shorts.

However, 24-hour liquidation data indicated a broader bullish undertone. Despite total daily liquidations reaching $176.54 million, short positions accounted for $94.32 million, outpacing the $82.22 million in long liquidations.

This suggests that while price corrections are occurring, they are frequently met with upward momentum that pressures bearish traders.

Bitcoin’s Maturing Market Profile

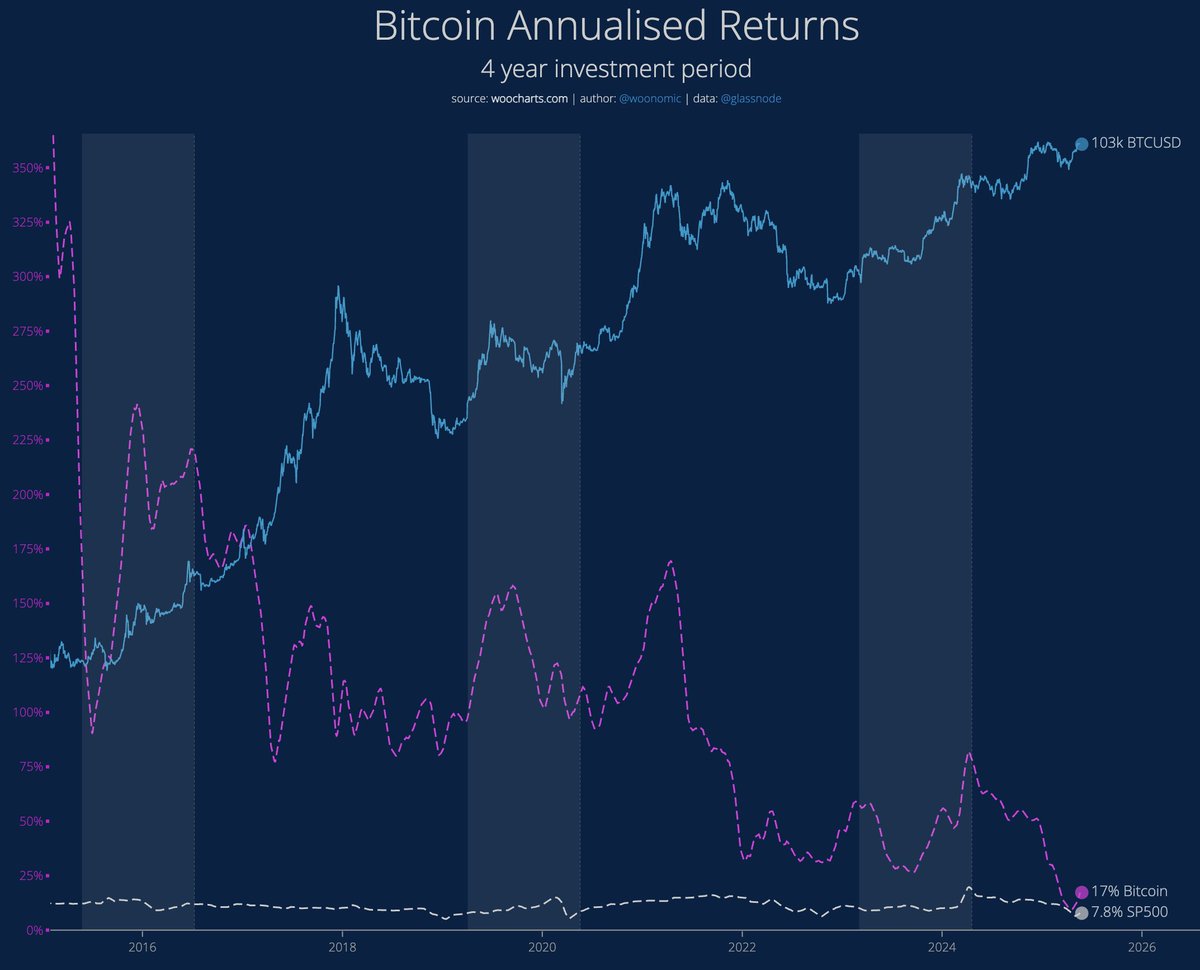
Amid these developments, on-chain analyst Willy Woo shared insights into Bitcoin’s long-term trajectory. He analyzed the compound annual growth rate (CAGR), highlighting a declining trend as Bitcoin absorbs more institutional capital.

Woo pointed out that Bitcoin’s CAGR exceeded 100% during earlier phases, particularly before 2017. However, post-2020, when corporations and sovereign entities began accumulating, the CAGR declined to 30–40%.

This trend continues downward as Bitcoin evolves into a large-scale macro asset. According to Woo’s data, Bitcoin is now viewed as a capital storage vehicle, with the expected long-term CAGR eventually settling around 8%.

He attributed this projection to macroeconomic growth levels, referencing global monetary expansion (5%) and GDP growth (3%) as baseline comparisons. As capital continues to flow into Bitcoin, Woo noted that this maturation could take up to 15–20 years, aligning with the observed reduction in annualized returns.

Meanwhile, industry leaders like Michael Saylor expect Bitcoin prices to hit $1 million per coin during this timeline.

Bitcoin May Never Trade Below $47K Again as 200WMA Rises: Details

0

Adam Back confirms the Bitcoin 200WMA has surged, marking a shift and signaling early-stage bull cycle momentum.

Bitcoin’s price climbed to a local peak of $106,000 on Sunday, May 18, marking its highest level since early February 2025. Within the past seven days, the asset moved between $101,000 and $106,000, reflecting a highly volatile trading range. 

As of May 19, Bitcoin trades at $102,761, showing a 0.89% 24-hour decline and a 1.81% drop over the past week. Despite these fluctuations, several long-term indicators have begun shifting upward, signaling a change in market dynamics.

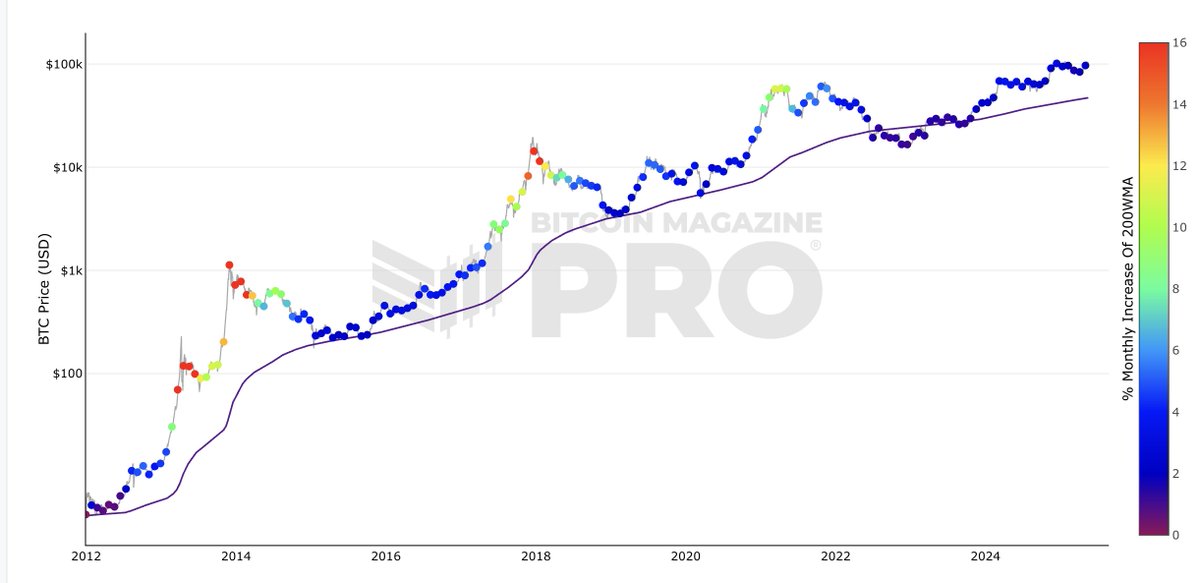
200W MA has now exceeded $47,000

Blockstream CEO Adam Back confirmed that Bitcoin’s 200-week moving average (200WMA) has now exceeded $47,000. This level marks a critical milestone in Bitcoin’s historical trend analysis. Bitcoin surged from the $46,000 level and crossed $47,000 in under 30 days, marking a rapid $1,000 gain.

Image

The 200WMA serves as a key long-term indicator by smoothing out short-term volatility and revealing underlying cycle behavior. Notably, Back previously confirmed that the 200WMA essentially serves as Bitcoin’s floor price, as the asset does not trade below this level.

The indicator stood at $40,000 as of October 2024 but has continued to increase since then. According to historical chart data from 2012 to 2025, the moving average typically steepens during bull markets and flattens during bearish phases.

Notably, in earlier cycles such as 2012–2014 and 2017–2018, the 200WMA showed accelerated monthly growth, reaching over 10–15%. During these times, Bitcoin entered euphoric rallies. 

In contrast, color-coded indicators now suggest Bitcoin is in an early expansion phase, with the 200WMA rising at a slower pace of 2–6% per month. This pattern, based on long-term chart visuals, shows the blue-to-light purple color range currently dominating price action in 2025, indicating gradual but steady growth.

The moving average’s rise past $47,000 suggests Bitcoin may have entered the early to mid-stages of a new bull cycle. Historically, similar phases showed steady growth before more aggressive price acceleration occurred. Additionally, Bitcoin’s sustained move above a rising 200-week moving average also signals a strong long-term base formation.

Structural Momentum Ahead of Market Acceleration

While price volatility remains high, momentum indicators are turning positive. According to on-chain analyst Willy Woo, Bitcoin’s compound annual growth rate (CAGR) has declined significantly since its peak years.

In 2017, the asset saw triple-digit growth rates. However, by 2020, with the entry of corporations and sovereign entities, the CAGR dropped to the 30–40% range. Woo noted that this trend has continued downward as Bitcoin absorbs more capital and shifts toward being a macro asset.

Image

Meanwhile, Woo stated that the long-term CAGR may eventually stabilize near 8%, citing macroeconomic trends like monetary expansion and global GDP growth. Though this transition could take over a decade, the asset’s structural positioning remains distinct. This aligns with the gradual uptick in the 200WMA and current low-growth color zones.

Bitcoin Higher High to Form

On May 18, Bitcoin also recorded its highest daily candle close on record, ending above $105,000. 

Analyst Rekt Capital opined that this development may indicate a fresh higher high forming on longer timeframes. Though the short-term price dipped back to $102K, the structural indicators remain the focus for many analysts tracking Bitcoin’s multi-year behavior.

Ripple Now Set to Tap into UAE’s $400 Billion Financial Market: Here’s How

The latest meeting between Ripple executives and key leaders in Dubai continues to spark conversation about Ripple’s positioning within the $400 billion market opportunity.

This month, Ripple’s leadership convened in Dubai for the 2025 FinTech Summit, where President Monica Long met with UAE officials, including Emirates Group Chairman Ahmed bin Saeed.

Discussions focused on expanding digital payments and driving financial innovation. This follows Ripple’s regulatory approval from the Dubai Financial Services Authority (DFSA) on March 13.

The license enables Ripple to provide cryptocurrency payment services within the Dubai International Financial Centre. Notably, this approval represents a strategic breakthrough for Ripple in the Middle East. For instance, Ripple is the first crypto payments provider to receive full clearance from the DFSA.

It positions the company to expand its enterprise-grade crypto payment services across a region increasingly aligned with blockchain innovation.

Strategic Expansion into a High-Value Market

Following the recent meeting in Dubai, XRP community member “Riz” reminded investors that the UAE commands a market of over $400 billion in international trade. Ripple confirmed this figure in its March announcement.

Notably, the new license enables the company to address rising demand for faster and more transparent cross-border payment solutions from traditional financial institutions and crypto-native firms in the region. This move builds on Ripple’s presence in the UAE since 2020. Specifically, around 20% of its global customers are already operating in the Middle East.

According to a 2024 Ripple survey, 64% of financial leaders in the Middle East and Africa (MEA) region see faster settlement as blockchain’s primary advantage. The region also demonstrates one of the highest levels of institutional readiness. Notably, over 82% of MEA financial leaders expressed strong confidence in integrating blockchain solutions.

Stablecoin Utility on the Rise

Ripple’s recent launch of its RLUSD stablecoin is another key component of its strategy. With real-time settlement as a core feature, RLUSD has already surpassed $312 million in market capitalization since its debut in December. 

Interestingly, this figure marks more than a 2x increase from the $130 million reported in March, when Ripple secured its DFSA license. This growth shows the rising interest in stablecoins for payment utility, particularly in regions where traditional settlements are slow.

Building a Global Compliance Footprint

The DFSA approval adds to Ripple’s expanding portfolio of more than 60 global regulatory licenses. Notably, the company holds authorizations from the Central Bank of Ireland, Singapore’s Monetary Authority (MAS),  and the New York Department of Financial Services. 

As Ripple continues to engage closely with regulators worldwide, the company is solidifying its position as a leader in compliant blockchain infrastructure for financial services globally.