Home Blog Page 742

Tether Acquires Bitcoin Worth $458.7M for Cantor Merger Transaction

0

Tether has acquired a substantial amount of Bitcoin tokens as part of a strategic role in a business merger involving Cantor Equity Partners and Twenty One Capital.

The purchase, disclosed under a Business Combination Agreement dated April 22, 2025, involved 4,812 Bitcoin for over $458.7 million at an average price of $95,319.83 per Bitcoin.

According to regulatory documents filed Tuesday, the acquisition is tied to an effort to support the financial structure of an upcoming public listing via SPAC.

Digital Asset Transfer Anchors Initial PIPE Investment

Shortly after the creation of Twenty One Capital, Tether moved the Bitcoin tokens to a wallet it controls. This allocation, designated in the filing as the “Initial PIPE Bitcoin,” forms part of a private investment in public equity structure.

The company will transfer it to the merged public company at the same $458.7 million valuation once the transaction closes. The document links the funds used by Tether to subscription proceeds raised through a convertible note offering.

Through this transaction, Tether joins other backers contributing capital in Bitcoin form. Meanwhile, Cantor Equity Partners has custody of 31,500 Bitcoin on behalf of Twenty One Capital.

Combined with Tether’s contribution, the firm’s current Bitcoin reserves reach 36,312 BTC. This move illustrates the company’s focus on structuring its balance sheet around digital assets during the merger process.

Crypto Entities Commit to Funding Structure

Earlier this year, Cantor Equity Partners raised $200 million to initiate the creation of Twenty One Capital. As part of a broader funding arrangement, Tether committed $1.5 billion in digital assets to the firm.

Additionally, SoftBank allocated $900 million, and Bitfinex added $600 million in Bitcoin. These contributions will bring the total Bitcoin support for the newly formed entity to $3 billion.

The funding pool is part of a coordinated effort to capitalize Twenty One Capital, which will operate under the ticker XXI following the merger’s completion.

While the approval process is currently in progress, no official timeline for the finalization has been announced. The firm’s capital structure is being designed with Bitcoin at its core, underscoring a preference for digital asset-backed financial mechanisms.

JPMorgan Completes First Public Tokenized Treasury Transaction with Chainlink and Ondo

JPMorgan Chase has successfully completed its first tokenized U.S. Treasury transaction on a public blockchain in partnership with Ondo and Chainlink.

Fortune Magazine reported this today, confirming that the bank completed the transaction on Ondo’s public blockchain. This marks the first time JPMorgan has extended its internal blockchain platform, Kinexys, to interact directly with a public network.

Details of the JPMorgan Transaction

The transaction involved exchanging a tokenized U.S. Treasuries Fund (OUSG), which was hosted on the Ondo Chain testnet, for a payment processed through Kinexys, JPMorgan’s private blockchain.

Chainlink’s technology acted as the communication layer between the two systems. Its Runtime Environment coordinated the Delivery versus Payment (DvP) settlement, ensuring that the exchange of tokens and funds occurred securely across both blockchains. This setup allowed for the end-to-end completion of a cross-chain transaction.

Until now, JPMorgan had limited its blockchain activities to private platforms such as Onyx, which has processed over $300 billion in tokenized repo trades. In contrast, this transaction was publicly visible and executed on a decentralized network.

Nelli Zaltsman, who leads platform settlement at Kinexys, stressed that this project was not a quick response to changing political trends, but part of a longer-term strategy. She noted that conversations with Chainlink began two years ago and led to the development of a structure now being prepared for broader production use.

Growing Institutional Interest in Tokenization

The move comes at a time when institutional interest in tokenized assets is accelerating. The market for tokenized U.S. Treasuries has grown to nearly $2.4 billion, though it remains far smaller than the $180 billion stablecoin market. 

JPMorgan analysts believe tokenized Treasuries could act as a reliable source of yield and may eventually compete with stablecoins in crypto collateral use cases. However, regulatory restrictions, including rules that limit investment access to accredited investors, could slow down adoption. 

Notably, this recent development builds on JPMorgan’s earlier blockchain experiments. In 2022, the bank took part in a decentralized finance trial on the Polygon blockchain through a project led by Singapore’s central bank. In 2023, it completed a tokenized collateral settlement with BlackRock and Barclays via Onyx.

Other major institutions are moving in the same direction. BlackRock, which launched its BUIDL fund on Ethereum, is already delving into tokenization soon, recently meeting with U.S. regulators to discuss the future of tokenization. 

Goldman Sachs, Fidelity, Franklin Templeton, and Deutsche Bank have all launched or explored similar initiatives. Most recently, The Crypto Basic reported that Citi and SDX formed a partnership to tokenize private markets, expecting to proceed with the initiative by Q3 2025. In March, CME Group also partnered with Google Cloud to pursue tokenization.

Solana Bulls Target $261 as Derivatives Market Heats Up

Solana reclaims $185 with a 92% surge and rising futures activity. Can the SOL price reach $261 as the falling wedge breakout gains traction?

As the total crypto market cap (excluding Bitcoin) reaches $1.26 trillion, altcoins are gaining momentum. One of the top performers is Solana, currently trading at $183 after an overnight surge of 5.48%.

At present, Solana is facing resistance near a critical supply zone around the $185 mark. However, growing momentum suggests the possibility of a breakout rally toward the $261 resistance level. Could Solana post an additional 42% gain with a breakout above this key level?

Solana Price Analysis Targets $261

On the daily chart, Solana’s bullish reversal has reclaimed the $185 level, last seen on February 17. In 2025, Solana bottomed out at $95.16 and has since surged by 92% over the past 37 days. This sharp trend reversal confirms a falling wedge breakout in the SOL price trend.

Solana Price Chart
Solana Price Chart

The bullish rally has pushed the price above the 200-day EMA at $162 and the 50% Fibonacci retracement level at $165. This has strengthened bullish momentum, leading to a positive crossover of the 50- and 100-day EMA lines. Additionally, the daily RSI is fluctuating in the overbought region, signaling strong underlying bullish sentiment.

Currently, Solana has surpassed the critical $175 zone and is testing the 61.8% Fibonacci level at $184.52. If SOL can break above this overhead resistance, the falling wedge breakout rally may challenge the previous peak near the $261 mark. This indicates a potential upside of 42% as buying pressure continues to build.

On the downside, the 200-day EMA remains a crucial support level at $162, followed by the 50% Fibonacci level near the 38.2% retracement zone at $150.

Solana Bulls Dominate the SOL Futures Market

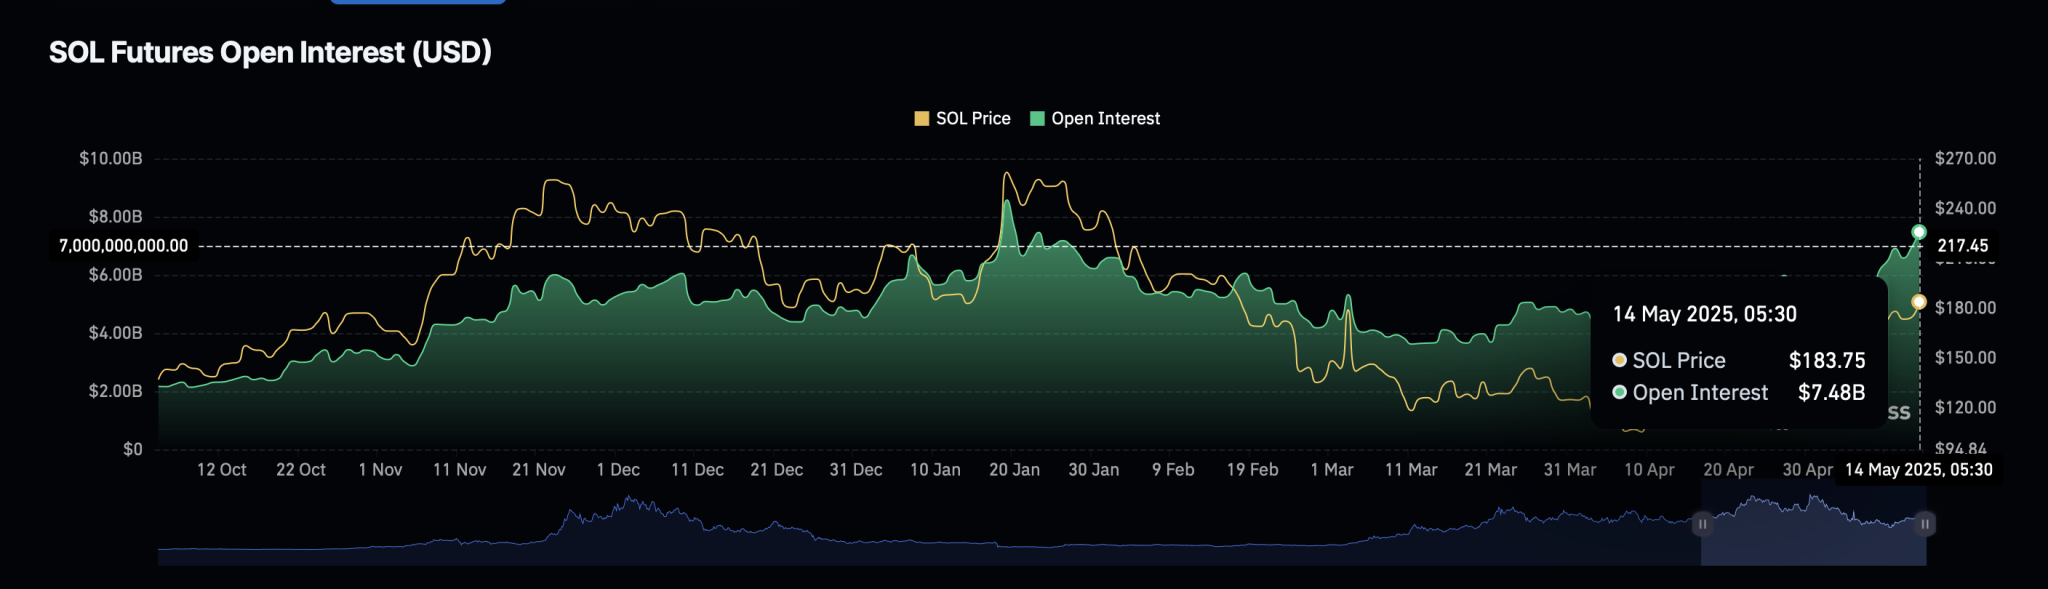
As Solana approaches a key breakout level, optimism in Solana futures is rising. According to data from CoinGlass, Solana futures open interest stands at $7.49 billion, marking a 12.10% increase in the past 24 hours. In line with the bullish trend, short liquidations have jumped to $14.76 million during the same period, reflecting increased bullish activity in the Solana futures market.

SOL Futures Open Interest

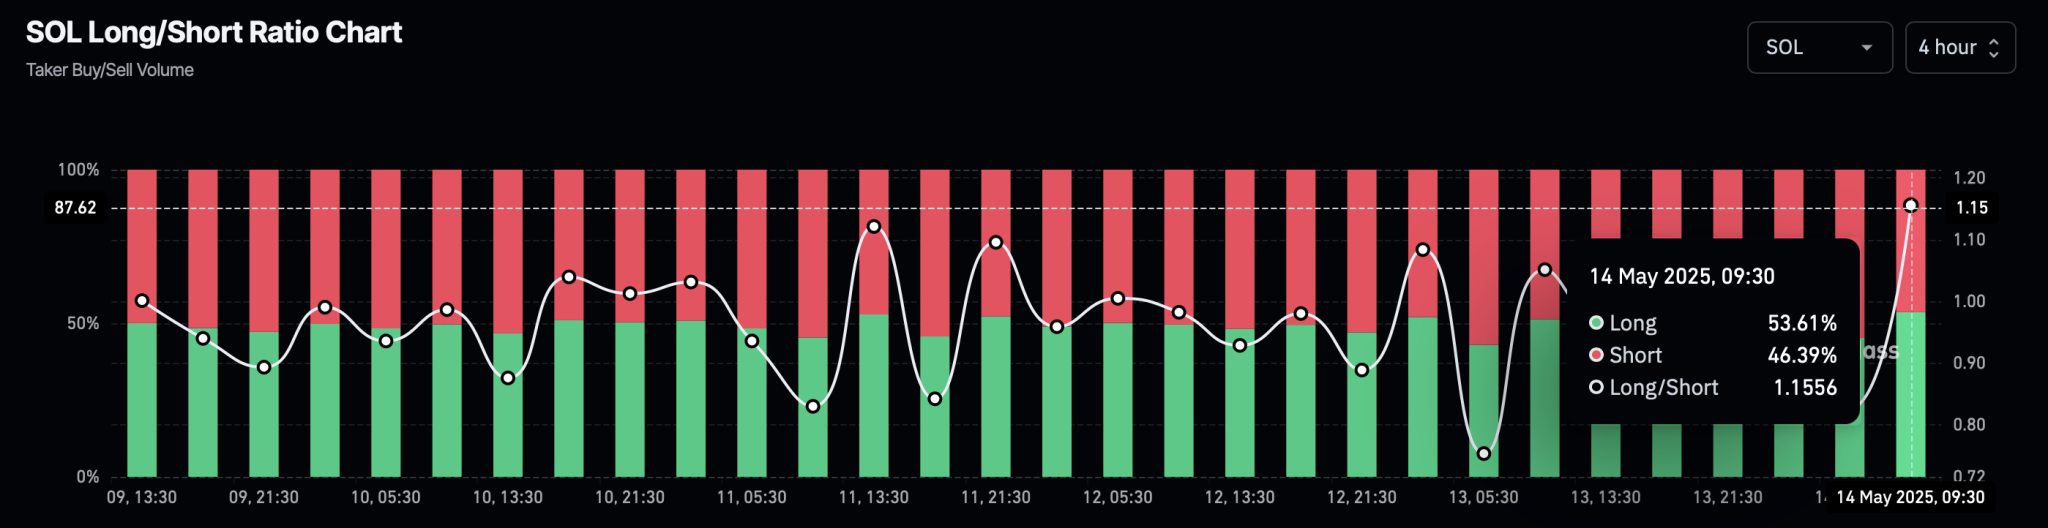
Additionally, CoinGlass data shows a sharp increase in long positions, with longs accounting for 53.61% of taker volume. This has pushed the long-to-short ratio to 1.1556, underscoring bullish dominance in the Solana derivatives market.

Coinglass
Coinglass

As the broader market continues to gain momentum, the rising optimism among Solana derivatives traders points to a potential leverage-driven rally beyond the $185 resistance. This breakout could pave the way for an extended recovery, with SOL prices aiming for the $261 milestone.

Will Ethereum Price Hit $4,000 as Open Interest Reaches $33 Billion?

Ethereum has surged past $2,700 with a 92% rally over the past 35 days. Will the rounding bottom pattern drive ETH to $4,000?

Outperforming Bitcoin, Ethereum surpassed the $2,700 mark with a 7% surge on May 13. Currently, it is trading at $2,671, entering a breather phase with an intraday pullback of 0.33%.

With the overnight recovery, Ethereum is inching closer to a potential rounding-bottom breakout rally. Could this breakout send the ETH price to the $4,000 mark?

Ethereum Price Analysis

Bouncing off the $1,383 low formed on April 9, Ethereum has risen by nearly 92% in just 35 days. This bullish recovery has pushed the price above the 200-day EMA at $2,436 and is now challenging the 50% Fibonacci retracement level near the psychological resistance of $2,700.

Ethereum Price Chart

Thanks to this recovery, Ethereum has broken out of a falling channel pattern, effectively ending the bearish trend that began in December 2024. Moreover, with the 50% Fibonacci level acting as the neckline, ETH is forming a rounding bottom pattern.

Rising bullish momentum has driven the RSI into the overbought zone, supporting this breakout trend and indicating strong buying pressure. Additionally, the 50—and 100-day EMA lines are on the verge of a bullish crossover. This signals a potential short-term trend reversal and increases the likelihood of a golden crossover.

If ETH achieves a decisive close above the 50% Fibonacci level at $2,699, a breakout could occur. The bullish target, based on adding the depth of the pattern to the neckline, points to the 100% Fibonacci level near $4,000. This suggests a potential 50% upside as the bull run continues.

On the downside, crucial support for ETH lies at the 200-day EMA at $2,436.

Bullish Narrative Grows Stronger in Ethereum Futures

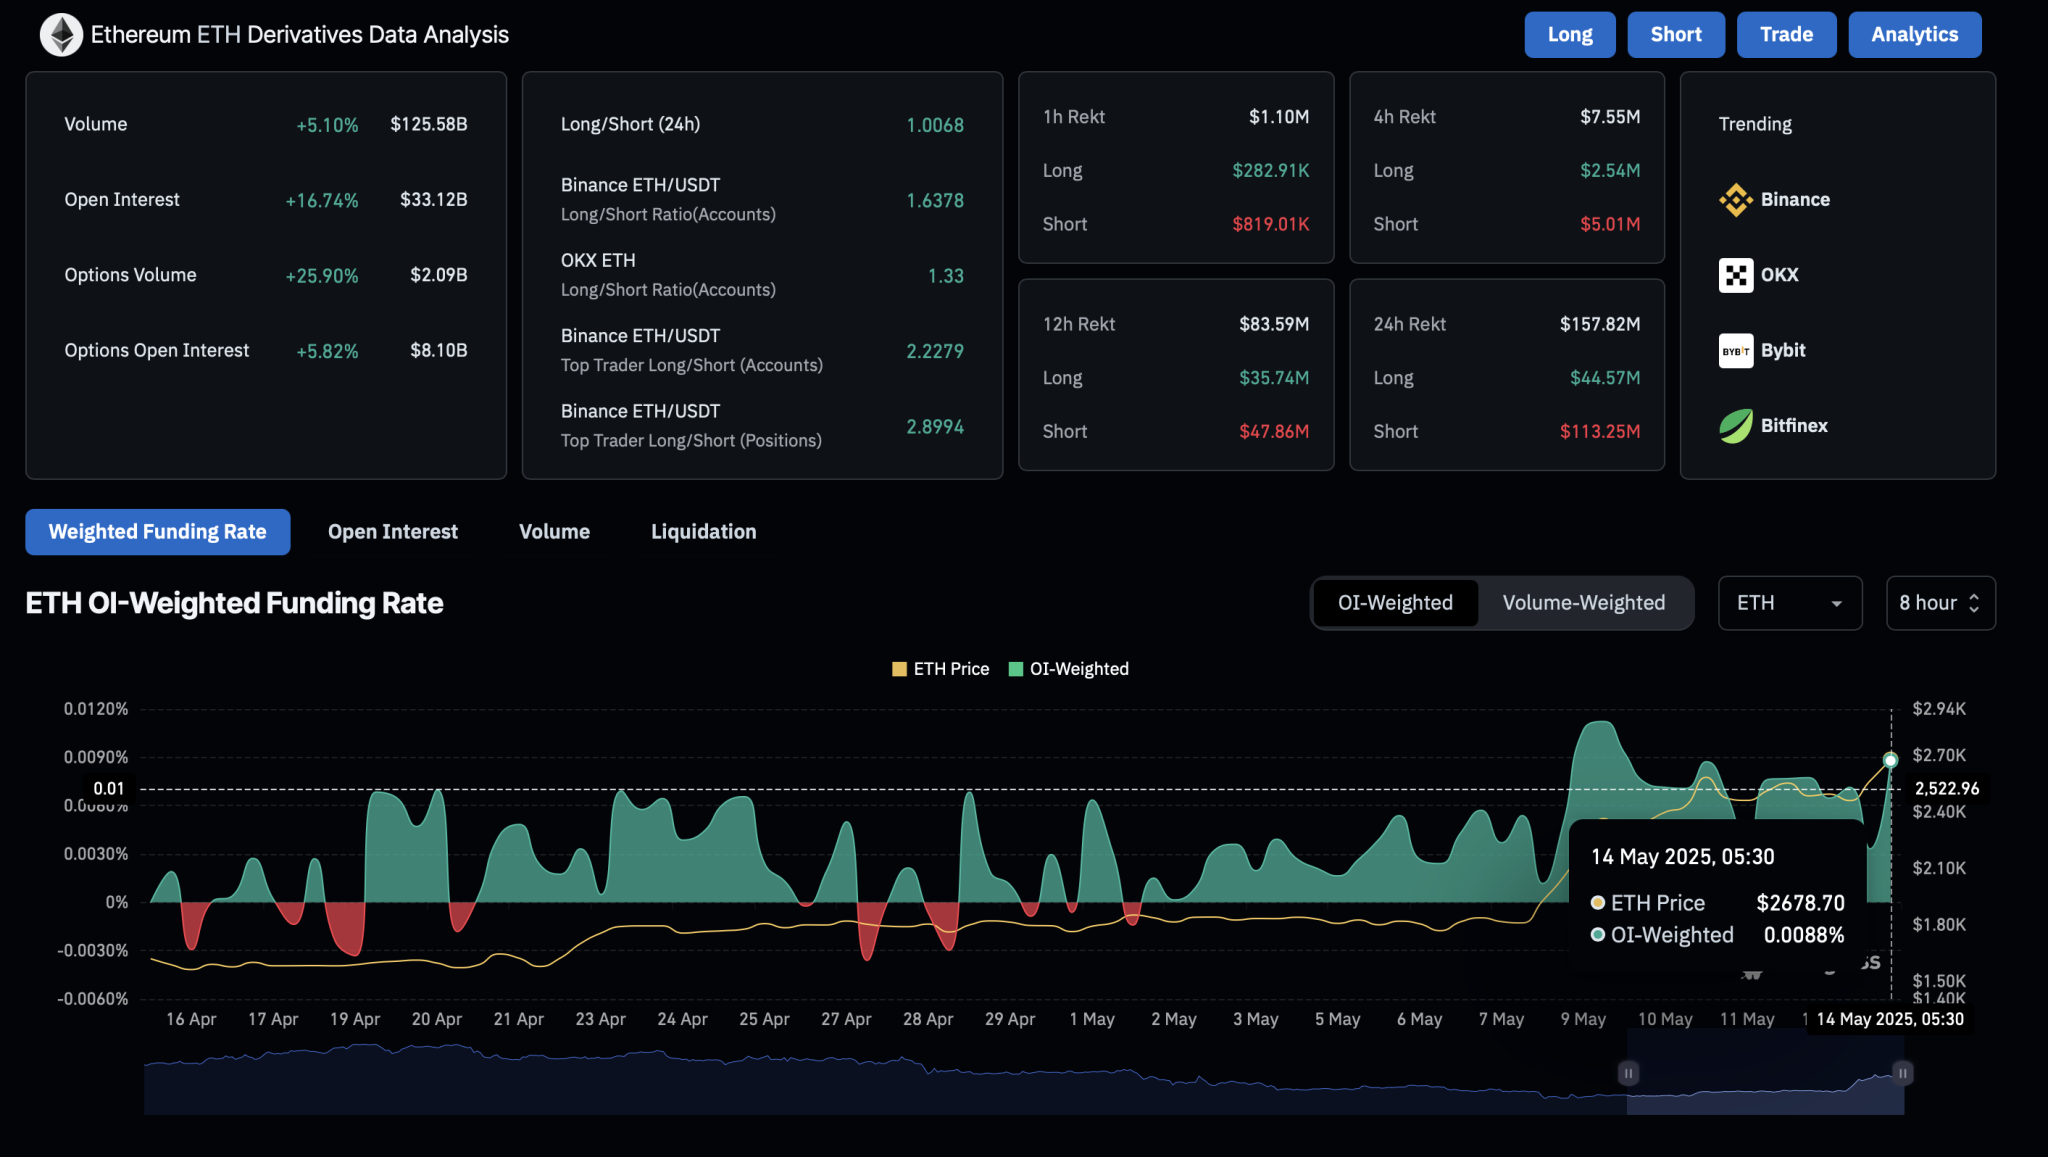
Derivative traders are betting big on Ethereum’s continued rally. According to CoinGlass data, Ethereum open interest has surged by nearly 17%, reaching an all-time high of $33.12 billion.

Ethereum Derivatives Data Analysis

Furthermore, the funding rate, now at 0.0088%, signals heightened bullish activity. A sharp increase in short liquidations amounting to $113 million in the past 24 hours reinforces the bullish sentiment. Together, these metrics support the likelihood of a breakout rally in Ethereum futures.

Analyst Highlights Key Breakout, Sets Target at $3,033

REKT Capital maintains a bullish outlook on Ethereum. The analyst notes the surge in futures, with ETH surpassing the daily CME gap between $2,530 and $2,630.

A daily close above this zone would fully reclaim the CME gap and restore a bullish trend. Ethereum’s next target is the CME gap between $2,892 and $3,033.


Bitcoin at $104K: Whale Activity and Surging Open Interest Hint at New All-Time High

As U.S. inflation fell to 2.3% in April, Bitcoin gained momentum. Currently, BTC trades at $103,827, reflecting a surge of nearly 1.5%.

Now, Bitcoin is eying a new all-time high as recent whale activities suggest further upside ahead.

Bitcoin Price Analysis

On the daily chart, Bitcoin shows a rebound from the 50% Fibonacci level, near $75,500. This bounce has driven a nearly 36% price increase over the past 36 days.

Bitcoin Price Chart
Bitcoin Price Chart

The bullish trend triggered a breakout from a falling wedge pattern and surpassed the 78.6% Fibonacci level, around $92,000, as well as the key psychological barrier at $100,000. Currently, Bitcoin is facing resistance at the overhead supply zone near $104,000.

As Bitcoin reaches this critical juncture, technical indicators are signaling a loss of momentum. The RSI has reversed within the overbought zone and now threatens to fall below the 14-day average. Additionally, the MACD and signal lines are close to a bearish crossover. These signals suggest the possibility of a short-term top forming.

If BTC fails to break above the current resistance, a retest of the $97,000 level appears likely. Further support lies at the 78.6% Fibonacci level, near $92,000.

Optimistically, a successful breakout above the $104K resistance could set the stage for a rally toward the 1.272 Fibonacci extension level at $127,800.

Declining Whale Inflows

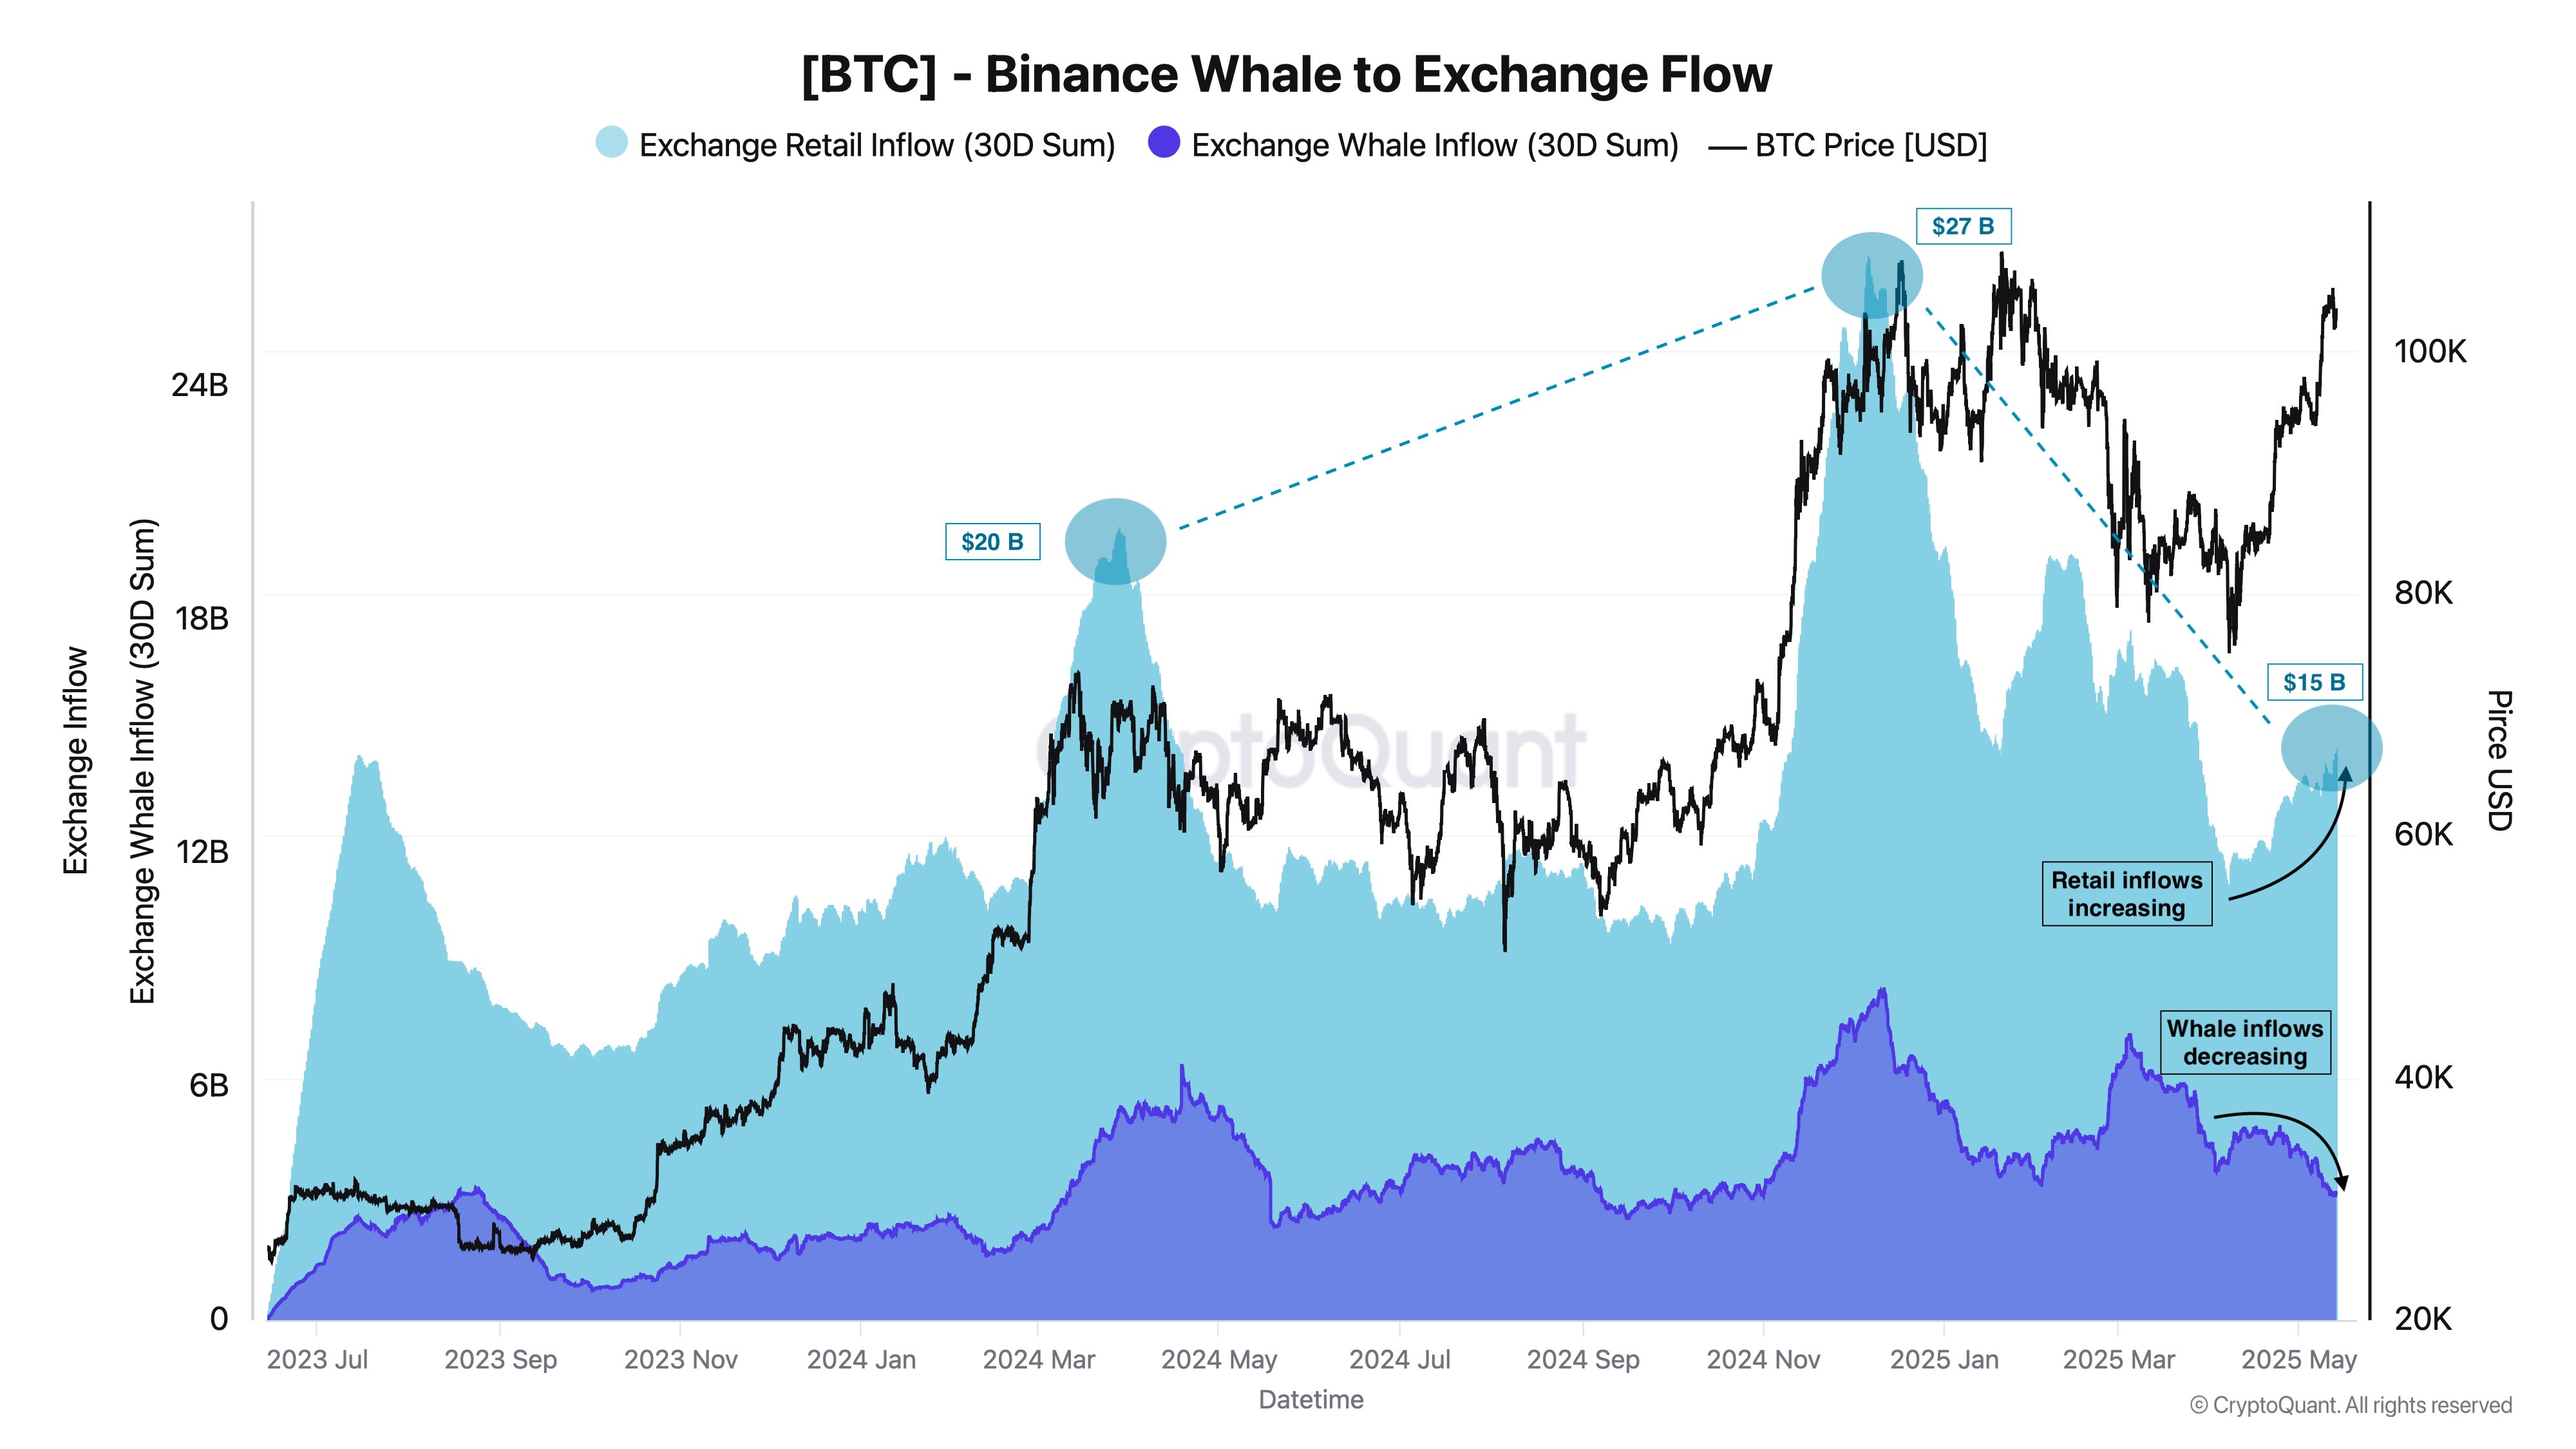
According to a recent tweet by CryptoQuant analyst DarkFost, a divergence has emerged between whale and retail investor activity on Binance. Since early April, Bitcoin’s bullish momentum has strengthened.

However, whale inflows to exchanges have continued to decline, while retail inflows have surged from $12 billion to $15 billion. Less capital from whales entering exchanges suggests confidence in the market for more upside. Moreover, additional data suggests whales have even accumulated over 83K BTC since last month.

Binance Whale to Exchange Flow

Bullish Sentiments Fuel Bitcoin Futures

As retail inflows grow, optimism in Bitcoin futures has reached new heights. Open interest is approaching the $70 billion mark, currently standing at $67.47 billion. Moreover, more than $36 million in short positions have been liquidated over the past 24 hours, indicating strong bullish dominance.

BTC Futures Open Interest

Currently, the OI-weighted funding rate is 0.0075%, reflecting overall bullish sentiment in the derivatives market. Bitcoin futures traders remain highly optimistic about the continuation of the uptrend and the potential to reach a new all-time high.

Shiba Inu Outperforms Trump Meme Coin Despite White House Perks for TRUMP Holders: Report

0

A recent report suggests that Shiba Inu outpaced the weekly gains of the TRUMP meme coin despite President Trump offering a black-tie dinner and White House tour for its largest holders.

In a tweet, Coinpedia Markets highlighted that Shiba Inu surged 36% in the past week. However, the report claimed TRUMP reported a lower percentage weekly gain.

Notably, on-chain data shows that SHIB’s price rallied from around $0.00001260 to $0.00001720 in the past period. This performance saw Shiba Inu rival other crypto assets, including Donald Trump’s meme coin. 

According to Coinpedia Markets, the Official Trump coin price only spiked by 28%. Notably, data from CoinMarketCap suggests that TRUMP’s price rallied from around $11 to $14 last week. 

The tweet from Coinpedia Markets argued that Shiba Inu outperformed TRUMP’s gains despite Donald Trump’s jaw-dropping offer to the token’s largest holders. 

Black-Tie Dinner and White House Tour for TRUMP Holders 

As previously reported, the top 220 largest holders will participate in a black-tie dinner with President Trump on May 22. At the event, a special reception and a private White House tour will be held for the top 25 holders of TRUMP. 

The offer impacted TRUMP’s price at the time of the initial announcement in April, with its valuation soaring to $3 billion. However, interest in TRUMP declined this month as other meme coins outperformed its weekly gains. 

Other Notable Shiba Inu Milestones 

Further, Coinpedia Markets mentioned other notable milestones Shiba Inu achieved recently. It claimed that Shiba Inu ranked as the fifth most-swapped token in the popular Ethereum wallet MetaMask last week. Recall that Shiba Inu achieved a similar milestone last year, joining the likes of Pepe, BabyDogeCoin, Pepe Unchained, and Hex. 

Positive Indicators

In terms of technical indicators, Coinpedia Markets indicated that Shiba Inu was trading above all major daily and weekly moving averages. At the time of the tweet, it claimed that SHIB had a relative strength index (RSI) of 71. 

Following Shiba Inu’s recent surge, the report stated that SHIB broke out of a falling wedge, mirroring a bullish setup observed in September 2024. 

Based on this move, Coinpedia Markets sets $0.00002148 as the resistance target Shiba Inu must flip to rally to a lofty height of $0.00003575 this month. Hitting the $0.00003575 target demands a surge of 118% from the current price of $0.00001639. 

Growing Utility and Demand 

Meanwhile, Coinpedia also suggests that Shiba Inu’s demand and utility have skyrocketed massively in recent weeks. It claimed this was due to Shibarium’s on-chain growth, the network’s integration into Zypto App, and Bury 2.0 staking incentives. 

The report also highlighted Shibarium’s increased activity, noting that the number of accounts rose from 240,421 registered on March 1 to 268,877 on May 10. The analysis also claimed that Shibarium’s transaction volume soared from 931 million to 1.15 billion within this period, signaling widespread adoption. 

At press time, Shibarium’s total account had soared to 268,981, while the total transaction stood at 1.17 billion. 

Analyst Predicts Timeline for Dogecoin to Reach $1 After Key Breakout

0

An analyst has identified the timeline for Dogecoin to surge higher, based on major breakout signals.

Notably, Dogecoin’s price movement has recently taken a significant bullish turn, with a strong breakout pushing its value from under $0.17 on May 7 to a peak just above $0.249 by May 11. 

This rally marked a 36% gain within a week, but according to technical indicators and network activity, analysts are now tracking signals that may support a longer-term move.

Breakout from Long-Term Resistance

The chart under review by Chris, an analyst on X, is a daily DOGE/USD pair, which highlights a breakout above a descending trendline. That trendline had acted as resistance since January 2025, repeatedly rejecting Dogecoin’s price at $0.44, $0.20, and $0.17.

Image

In addition to the trendline breach, the Ichimoku Cloud indicator confirms the bullish momentum. The price has moved above the cloud, flipping its structure into a positive alignment with the green leading span now positioned above the red. This realignment transforms the cloud from resistance into support, confirming the upward bias.

Furthermore, the analyst plotted Fibonacci extension levels around price targets at $0.69 (1.618 level) and $0.82 (2.0 level). These levels are widely used by traders to project future movements based on prior rallies.

The analysis includes a forecast by the analyst suggesting that DOGE may reach $1 by September 23, aligning with the end of summer. Notably, DOGE would need to surge approximately 327.35% from $0.234 to reach $1.

If DOGE reaches $1, the market cap would rise to $149.08 billion, assuming the circulating supply remains stable. Currently, Dogecoin’s market cap sits above $35 billion, up 4% in the past 24 hours.

Other Observers Eyeing the $1 Milestone

Notably, this is not the only observer eyeing the $1 milestone for the meme coin. In a forecast made last year, Galaxy Research predicted that Dogecoin (DOGE) could build on its momentum through 2024 and potentially reach fresh all-time highs in 2025.

The firm suggested that the meme-inspired cryptocurrency might finally achieve the long-anticipated $1 mark, pushing its market capitalization to around $100 billion during the year.

Separately, another market analyst pointed to a bullish technical indicator—a cup and handle formation that has been developing since 2021—as a sign that DOGE could approach the $1 level. This analyst projected a specific price target of approximately $0.88 based on that chart pattern.

Network Metrics Indicate Surge in User Activity

While technical indicators reveal a bullish breakout, on-chain activity also signals rising momentum. Over the past seven days, Dogecoin has recorded a 102.40% increase in new addresses and a 111.32% spike in active addresses. More strikingly, zero balance addresses surged by 155.34%.

Screenshot 2025 05 14T114400650
Dogecoin Daily Active Addresses

These metrics highlight a sharp rise in user participation. Such spikes typically align with growing retail interest and speculative engagement, often preceding heightened price volatility or sustained bullish phases. The pace of wallet creation and active use suggests broader engagement beyond short-term trading behavior.

Futures Market Data Reveals Diverging Trends

Meanwhile, data from Glassnode shows notable divergence between Dogecoin’s spot price and futures market activity. While DOGE pulled back from its $0.25 high to stabilize around $0.22, futures open interest climbed from $989 million to $1.62 billion.

This trend contrasts earlier months. From mid-February through April, futures open interest tracked DOGE’s spot price, declining in tandem during market downturns. However, the recent decoupling indicates persistent speculative positioning, despite cooling price momentum. Glassnode emphasizes this behavior as a signal to monitor.

CME Group Says ‘Mark Your Calendars’ For this CFTC Regulated XRP Product

0

Leading derivatives marketplace CME Group has called on the crypto community to prepare for the imminent launch of CFTC-regulated XRP futures. 

Taking to X, the derivatives trading platform teased the imminent launch of its XRP futures product yesterday, asking its 677,500 followers to mark their calendars for the rollout. 

Per the post, CME Group reiterated that users can start trading XRP futures on its platform from May 19, five days from today. Recall that CME Group first disclosed plans to launch futures products separately tied to XRP and Solana in January. 

CME Still on Track to Launch XRP Futures 

However, CME Group deleted the announcement from its beta website, triggering concerns that the exchange might have canceled its plans. Two months later, CME debuted the Solana futures and announced plans to launch a similar product for XRP, pending regulatory approval. 

CME’s latest announcement confirms it is on track to launch the XRP futures on May 19. In the meantime, whether the CFTC has approved the product for launch remains unclear. 

Once CME’s XRP futures launch on May 19, market participants can trade the product under two contract sizes. They include a micro-sized contract of 2,500 XRP and a larger-sized contract of 50,000 XRP. 

An earlier press release stated that the CME XRP futures would be cash-settled. The product’s price will be determined based on the CME CF XRP-Dollar Reference Rate. The launch of XRP futures will see CME expand its crypto product suite, which currently features assets like Bitcoin, Ethereum, and Solana. 

Other CFTC-Regulated XRP Futures 

It bears mentioning that the CME XRP futures will join other CFTC-regulated XRP futures currently available in the United States. In March, Bitnomial, an exchange overseen by the U.S. CFTC, launched the first regulated XRP futures in the U.S. 

Notably, shortly after Coinbase launched another CFTC-regulated XRP futures on its derivatives platform, specifically by April 21, 2025. The continuous rollout of regulated futures for XRP highlights the U.S. regulators’ evolving stance on XRP as a commodity rather than a security.

XRP ETF Next? 

This classification is essential in the token’s potential approval for a spot-based exchange-traded fund (ETF). Currently, 11 asset managers, including Franklin Templeton and 21Shares, are seeking the SEC’s permission to launch spot XRP ETFs in the U.S. 

These asset managers characterized their XRP ETFs as commodity-based trusts to secure the SEC approval. Interestingly, the SEC has acknowledged these products. 

Although the SEC has approved multiple leveraged XRP ETFs, including those belonging to ProShares, it has not approved any spot applications. 

Nonetheless, market pundits are confident that a spot XRP ETF will launch this year. Bloomberg ETF expert James Seyffart suggested that the SEC has a final deadline of October 18, 2025, to decide the fate of the multiple XRP ETF applications on its desk. 

Here’s What’s Next for Ethereum as It Reaches Three-Month High of $2,700

0

With Ethereum conquering a three-month peak, recent analysis has highlighted changing social sentiments and near-term price outlook.

Ethereum, the second-largest cryptocurrency by market cap, has stunned bears lately with its recovery. It has surged 6% and 42% in the past 24 hours and seven days, outperforming most high caliber assets in these timeframes.

Interestingly, the rally is a contrarian play considering the recent prevalent bearish sentiments around the Ethereum ecosystem. Meanwhile, an analysis from the intelligence platform Santiment highlighted what things looked like sentiment-wise and possible price action.

Noise Around Ethereum Tuning Down

Ethereum’s poor start to the year has seen market sentiments predominantly bearish. For perspective, the asset dumped 58% from an opening of $3,330 to $1,383 in April, putting in an underwhelming performance compared to its peers.

With the sideways trend, bearish calls on Ethereum spiked considerably. Santiment shared that the FUD around the coin spiked to its highest level this year between May 6 and 7. This came as Ether was unresponsive to a broader market recovery, as market watchers expected.

However, the altcoin king spiked 21% on May 8 to reclaim $2,000 and extended its grasp above the level with a 6% rally the next day. Notably, this change of event saw retailers quickly switch from bearish sentiments to fear of missing out (FOMO).

Social Sentiments on Ethereum

Furthermore, another indicator confirmed the growing interest in Ethereum. Data from Google Trends shows that the search for “Etherium” surged in recent days, suggesting that retail traders are slowly noticing the asset’s renewed bullishness.

Meanwhile, this quick sentiment turnaround reflects the irrationality in the crypto space, as retail investors seem focused on an asset’s short-term price action rather than its underlying long-term prospects.

What’s Next for Ethereum?

With the growing hype, Santiment noted that past data shows that overhype around Ethereum has historically followed a sharp correction. Nonetheless, it stressed that the attention around the coin has yet to reach such levels but warned of close monitoring.

Further, growing Ethereum prices come with traction and increased network activities. Santiment emphasized that growing utility could spike Ether’s transaction fees, which have been relatively low considering its high standards.

Currently at an average of $1.57, its transaction fee fell far below the over $7 seen six months back. Meanwhile, the analysis suggested that a spike above $2 could spell the end of this recent momentum.

Additionally, Ethereum’s average 30D return stands at +32.5%, far above the “rule of thumb +15% danger zone” Santiment recommends for altcoins. While this does not suggest a price recline, it implies that Ether’s price pace may dwindle or halt in the next 30 days.

Nonetheless, Santiment insisted that Ethereum’s long-term trajectory looks solid and prices might reclaim $3,000 by June. However, it tied the price mark to Bitcoin’s rally to $110,000.

At the time of writing, Ethereum trades at $2,599.

CryptoQuant Sees Possible Bullish XRP Breakout Amid Rising Open Interest and Seller Absorption

0

CryptoQuant data shows rising XRP open interest, neutral funding, and seller absorption—signs of a possible bullish breakout.

XRP’s price chart over the last seven days reflects a steady uptrend, climbing from just above $2.00 to nearly $2.60. The most significant spike came around May 12, when the asset briefly touched a weekly high before consolidating slightly below that peak. 

Meanwhile, current market signals suggest that price action alone may not fully capture the underlying dynamics driving XRP’s recent movement.

XRP’s Rising Open Interest and Shifting Market Sentiment

An analyst at CryptoQuant, Boris Vest, reported that XRP’s futures activity on Binance is showing signs of a resurgence in speculation.

After reaching an all-time high Open Interest of $1.5 billion earlier, the figure sharply declined to $530 million, removing many overleveraged positions. Now, Open Interest is again trending upward, pointing to renewed trader engagement and potential volatility.

Specifically, open interest for XRP has surpassed $730 million, according to CryptoQuant’s chart.

XRP Binance Open Interest CryptoQuant
XRP Binance Open Interest | CryptoQuant

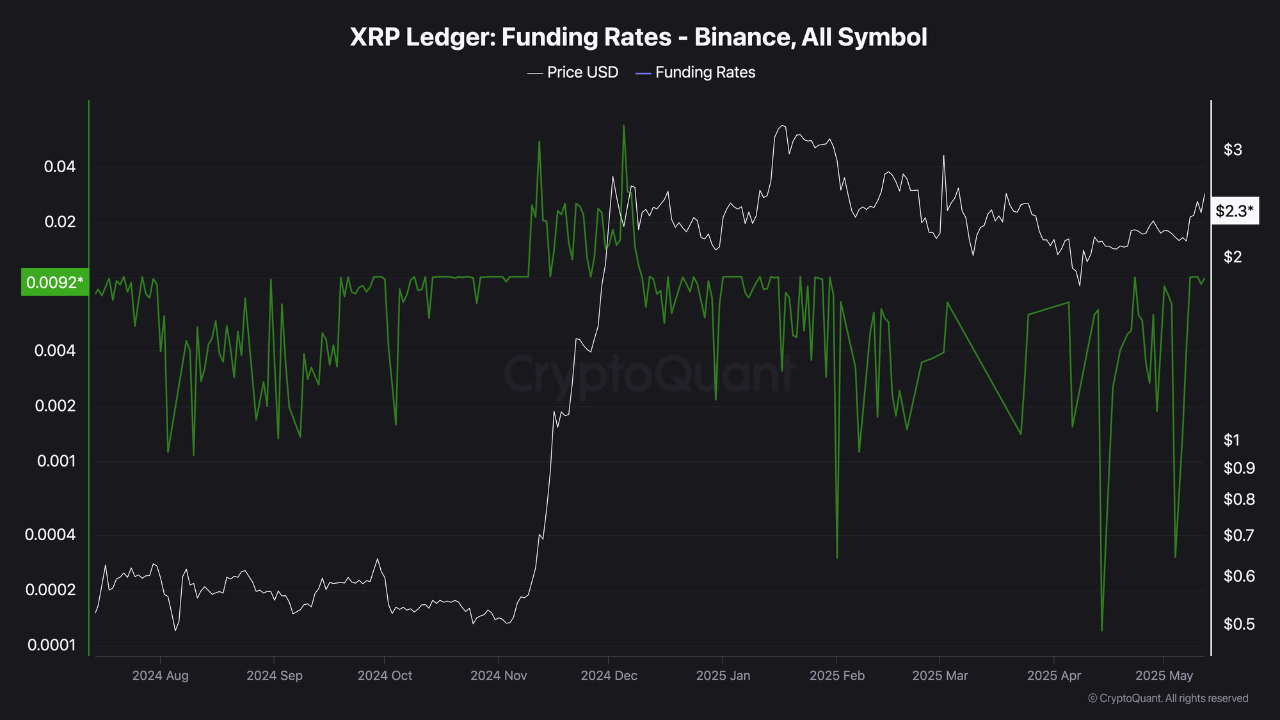
While Open Interest climbs, the funding rate has stayed neutral. This signals a balance between long and short positions. However, the analyst highlighted that short positions are gradually increasing while prices continue rising. This disconnect suggests a mild short squeeze is in effect, pushing the asset upward in the absence of overt buying pressure.

XRP Binance Funding Rates CryptoQuant
XRP Binance Funding Rates | CryptoQuant

Meanwhile, the Binance Taker Buy/Sell Ratio, which currently stands at 0.91, also reflects aggressive selling. Despite this, XRP’s price has remained relatively stable. According to CryptoQuant, this indicates that sell orders are being absorbed, which is a bullish signal.

XRP Binance Taker Buy Sell Ratio CryptoQuant
XRP Binance Taker Buy Sell Ratio | CryptoQuant

According to Vest, this pattern of quiet accumulation beneath the surface suggests that market participants may be positioning ahead of a potential upward move.

Bullish Pressure Despite Mixed Positions

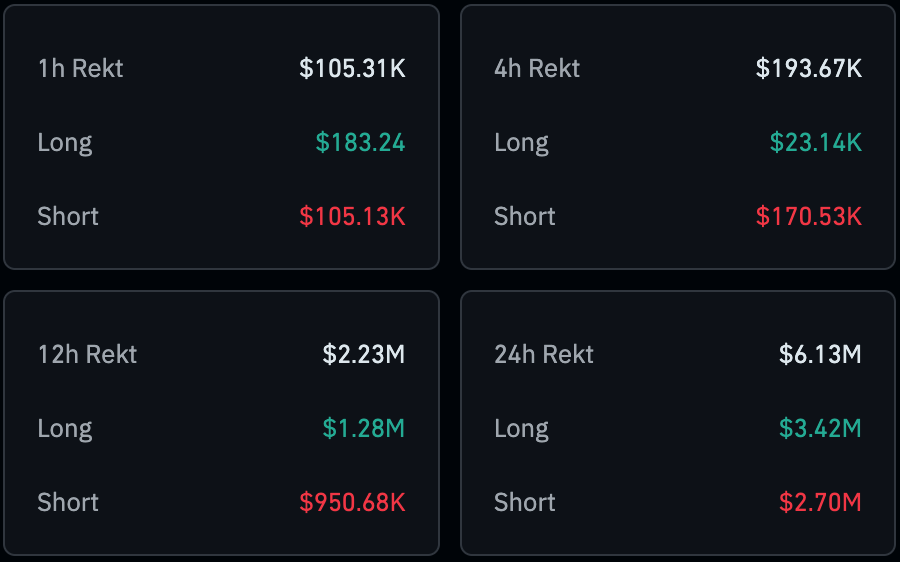
Coinglass derivatives data adds another layer to the market snapshot. Over the past 24 hours, short liquidations totaled $2.70 million. Notably, the last four hours revealed a surge in short liquidations—$170,000 compared to just $23,000 in longs. Notably, the final hour alone saw $105,000 in shorts wiped out against $183 in long positions.

XRP Liquidation Data | Coinglass

This short-term liquidation pattern suggests rising bullish pressure, even in a market that remains broadly indecisive. 

Looking at the broader picture, total liquidations over 24 hours reached $6.13 million, with $3.42 million in long positions and $2.70 million in shorts. While longs slightly edge out shorts overall, suggesting some traders may have over-leveraged bullish positions, the balance still leans toward a volatile but bullishly skewed market.

This Analyst Raises Long-Term Price Speculation

Separately, market analyst “DK64Trades” highlighted XRP’s market dominance across cycles. He observed that in January 2018, XRP traded at $3.84 with a dominance of 31.33%. In contrast, when XRP reached $3.34 in January 2025, dominance stood at only 5%.

DK64Trades noted that XRP’s current dominance remains significantly lower despite similar price levels. Based on this, he projected that a return to previous dominance levels could imply substantial market cap growth.

If XRP recovered its 2018 dominance share, the resulting $1.04 trillion valuation could correspond to a price near $17.8, considering the current $3.33 trillion global crypto market cap.