Home Blog Page 75

Monad Eyes Weekly Breakout as Major Support Holds

0

Monad has held a key support level on higher timeframes, and this could open the path for a subsequent trendline breakout.

After two weeks of sustained downtrend, Monad (MON) appears to have reached a bottom. This base is a long-standing support area that has cushioned weak price action several times in the past, boosting confidence that it will hold.

Monad Holds Weekly Support

Last week, MON closed at $0.0186 after reaching a low of $0.0183. This close fell within a strong support range between $0.0184 and $0.0158 on the 1-week chart.

Notably, this demand zone has a long history of supporting prices during periods of weakness. On three prior occasions, it helped Monad establish a base during downtrends and provided the momentum for a rebound.

The first was in mid-December 2025, when post-launch selling pressure kicked in. Monad crashed from around $0.487 to a low of $0.165 on December 18. There, buyers stepped in and sparked a short-term rebound higher.

In February, MON joined the broader crypto market downtrend to the support level again. Specifically, it dipped to a low of $0.0158 before bottoming, as the support proved too hard to overcome. The last retest of this support was in early June, when Monad dropped to $0.0180 but quickly rebounded.

Last week, the coin tested the demand zone again, and as always, buyers stepped in to form a bottom. The attention now shifts to how high Monad can push from here.

Monad 1W Chart Analysis

Support Rebound Shifts Focus to Trendline Breakout

With the area underneath providing support, Monad has faced resistance above. Prices have repeatedly been rejected by a descending trendline, capping earlier recovery attempts.

This dynamic resistance first forced a higher price rejection in November 2025, when an attempt to break bearish structure stalled at $0.080. MON continued to correct, subsequently bottoming at the support highlighted earlier.

Another recovery attempt in May ended at $0.0365, also aligning with the descending resistance trendline. Following the recent bounce from the support, attention has now turned to this higher timeframe supply zone.

Notably, MON has begun to compress between the upper resistance and lower support as consolidation tightens. This suggests that a breakout is becoming closer. Should the current upward momentum persist, the coin could eye a breakout from this 8-month-old structure.

MON Breakout Target

Monad is up nearly 10% this week. However, it would need to grow by another 37% from the current price of $0.0204 to reach the resistance line near $0.0280. Breaking above this level with strong volume paves the way for higher prices.

Typically, a descending trendline breakout initially targets its highest price point, bringing the November 2025 high of $0.080 into focus. From here, this represents a 292% increase. 

Meanwhile, for this to happen, Monad would have to keep holding the current support and break out from the descending trendline. Failure to do so invalidates a sustained uptrend in the short term.
XRP’s Entire Bull Run Balances on One Fibonacci Level as July Opens With Recovery Push

XRP has gradually erased its bull run gains over the past eleven months and now trades at a crucial Fibonacci level that holds significance to its bull structure.

XRP enters July 2026 at what many see as its most important technical point since the start of the bull run. The asset had earlier climbed from about $1.05 in the second week of November 2024 into an all-time high of $3.66 in July 2025.

However, since then, it has spent eleven months gradually losing these gains. Now, XRP trades at $1.1, sitting just above the 1.0 Fibonacci retracement level at $1.00795. 

This level is important because it marks a full return to the starting point of the entire rally. Although the first weekly candle of July shows a 5.07% gain, the broader chart structure suggests that the situation is still fragile.

The Final Fibonacci Support for XRP

Toward the end of June, XRP fell to $1.009, its strongest test of the $1 level since November 2024. Slightly below this, the 1.0 Fibonacci level at $1.00795 reflects a complete retracement from the cycle low to the July 2025 peak.

Throughout the eleven-month decline since August 2025, XRP lost key Fibonacci levels one after another. The 0.382 level at $2.65117, the 0.618 at $2.02366, the 0.786 at $1.57696, and the 0.888 at $1.30575 all broke down and flipped to resistance.

XRP Fibonacci Resistance and Support Levels

If XRP manages to hold above $1.00795 on a weekly closing basis, it could give buyers a base to build from. However, if it drops below this level, bears will have an opportunity to start targeting sub-$1 levels. 

Specifically, the $0.8 to $0.9 range could act as the immediate defense. Below this, the 1.13 extension at $0.66229 becomes the next support, followed by the 1.272 extension at $0.28472. These levels suggest possible declines of 82% and 92% from the July 2025 peak.

Downtrend Still in Control

Meanwhile, a descending trendline that started from the July 2025 peak continues to limit every recovery attempt and confirms that the downtrend remains in control despite the mild July rebound. 

XRP Weekly Descending Trendline

XRP recently reached a weekly high of $1.11, as buyers started testing the resistance at the trendline. However, the price pulled back slightly to $1.09969, leaving the breakout uncertain. A confirmed weekly close above this trendline would be the first sign of a shift in structure since the peak.

So far, this trendline has held firm. Every bounce since August 2025 has failed at or before reaching it. Until XRP breaks above it, the overall trend remains bearish.

XRP Faces Resistance from the Ichimoku Cloud

Also, the weekly Ichimoku Cloud presents further resistance above the current price. The Tenkan-sen stands at $1.27885, while the Kijun-sen is at $1.71205. Both are well above current levels, showing that momentum has not yet turned positive.

For any recovery to continue, XRP must first move above the Tenkan-sen at $1.27885 and then push toward the Kijun-sen at $1.71205. Only after that can it begin to challenge the cloud itself.

XRP Ichimoku Cloud
XRP Ichimoku Cloud

The projected cloud spans from Senkou Span A at $1.49545 to Senkou Span B at $2.33696, covering a wide range of $0.84. This wide zone shows strong resistance ahead. 

For XRP to break above the cloud at $2.33696, it would need to overcome all remaining Fibonacci levels, move above four major moving averages, and clear the entire cloud structure. This makes a near-term move toward the 0.382 level at $2.65117 a very ambitious scenario.

Early July Signals and What Comes Next

The first July weekly candle shows some positive signs. XRP opened at $1.04646, reached a high of $1.11, and now trades at $1.1.

On-chain data also shows the market boasts some strength. Specifically, XRP spot ETF inflows have stayed positive for eight straight weeks. In the week of June 26, inflows reached $22.99 million, bringing total net inflows to $1.47 billion. 

Meanwhile, exchange outflows rose from 40.7 million XRP on June 22 to around 123 million XRP in later sessions. This nearly 200% increase suggests that larger players may be accumulating. Still, the market faces substantial risks. 

For XRP to recover, it must move through key resistance levels step by step. The first target is the 0.888 Fibonacci level at $1.30575, which sits close to the Tenkan-sen at $1.27885. After that, the next level to watch is the 0.786 at $1.57696. 

However, XRP still trades below its 20-day EMA at $1.11, 50-day EMA at $1.20, 100-day EMA at $1.31, and 200-day EMA at $1.52. These levels form a strong barrier that the asset must overcome to confirm any lasting recovery.

Cardano Surges 18%, Overtakes Canton, Chainlink, and Monero to Reclaim Top 15 Spot

0

Cardano has regained momentum over the past few days, allowing it to re-enter the list of the world’s top 15 cryptocurrencies by market cap.

The recovery follows a difficult period for the digital asset, which faced intense selling pressure in recent weeks. That weakness pushed Cardano down to the 18th position in the global cryptocurrency rankings and sent its price to a multi-year low of $0.1387 last week.

However, market sentiment has shifted in Cardano’s favor as the token emerged as one of the strongest performers during the recent rebound.

ADA Overtakes Rivals as Price Jumps Nearly 19% From Recent Lows

Cardano’s price climbed from its recent low of $0.1387 to $0.1648, representing an impressive gain of 18.81% within a short period. The rally improved the asset’s market standing and helped restore investor confidence after weeks of underperformance. 

As buying pressure increased, ADA quickly rose through the cryptocurrency rankings. The latest surge propelled Cardano back into the global top 15 cryptocurrencies by market cap.

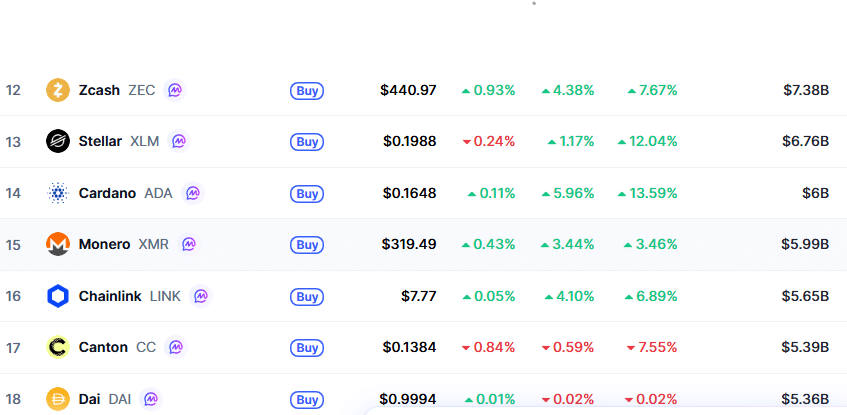
During the climb, ADA surpassed several notable digital assets, including Canton (CC), Chainlink (LINK), and Monero (XMR) over the past two days. As a result, Cardano now ranks as the 14th-largest cryptocurrency in the world, with a market valuation of approximately $6 billion.

The project is also closing in on higher-ranked competitors. ADA currently sits less than $800 million behind Stellar (XLM) and roughly $1.38 billion behind Zcash (ZEC), which occupies the 12th position in the rankings. 

Cardano Now in 14th Position in Global Crypto Ranking

Questions Remain About a Return to the Top 10

Despite the recent recovery, critics continue to ask when Cardano will reclaim a place among the ten largest cryptocurrencies.

The question carries historical significance because Cardano previously established itself as one of the market’s dominant assets. During the 2021 bull market, the cryptocurrency not only entered the top ten but briefly became the third-largest digital asset by market cap.

That history has fueled expectations that ADA could eventually return to those heights if current momentum continues.

Hoskinson Reaffirms Long-Term Commitment

Amid the growing scrutiny, supporters continue to highlight comments from Cardano founder Charles Hoskinson regarding the project’s future.

Hoskinson has repeatedly described Cardano as his life’s work and pledged his commitment to ensuring its long-term success. He has also argued that the network possesses the potential to become the largest cryptocurrency by market capitalization.

According to Hoskinson, achieving such a milestone would require sustained support and participation from the broader Cardano community. Under the right conditions, he believes the project could even challenge Bitcoin for the top position on CoinMarketCap.

At press time, Cardano traded at $0.1648. ADA was up 5.96% over the previous 24 hours and had gained 13.59% over the past seven days. 

ASTER Uptrend Targets After Range Breakout

0

ASTER is showing signs of renewed strength after a range breakout, with analysis suggesting buyers are gradually regaining control. 

The recent Aster (ASTER) price action suggests an optimistic short-term outlook, particularly as its price regains momentum and the broader crypto market shows recovery signs. Provided the token holds above critical support levels, it might experience a considerable rebound to higher resistance areas.

ASTER Breaking Out from Multi-Week Range

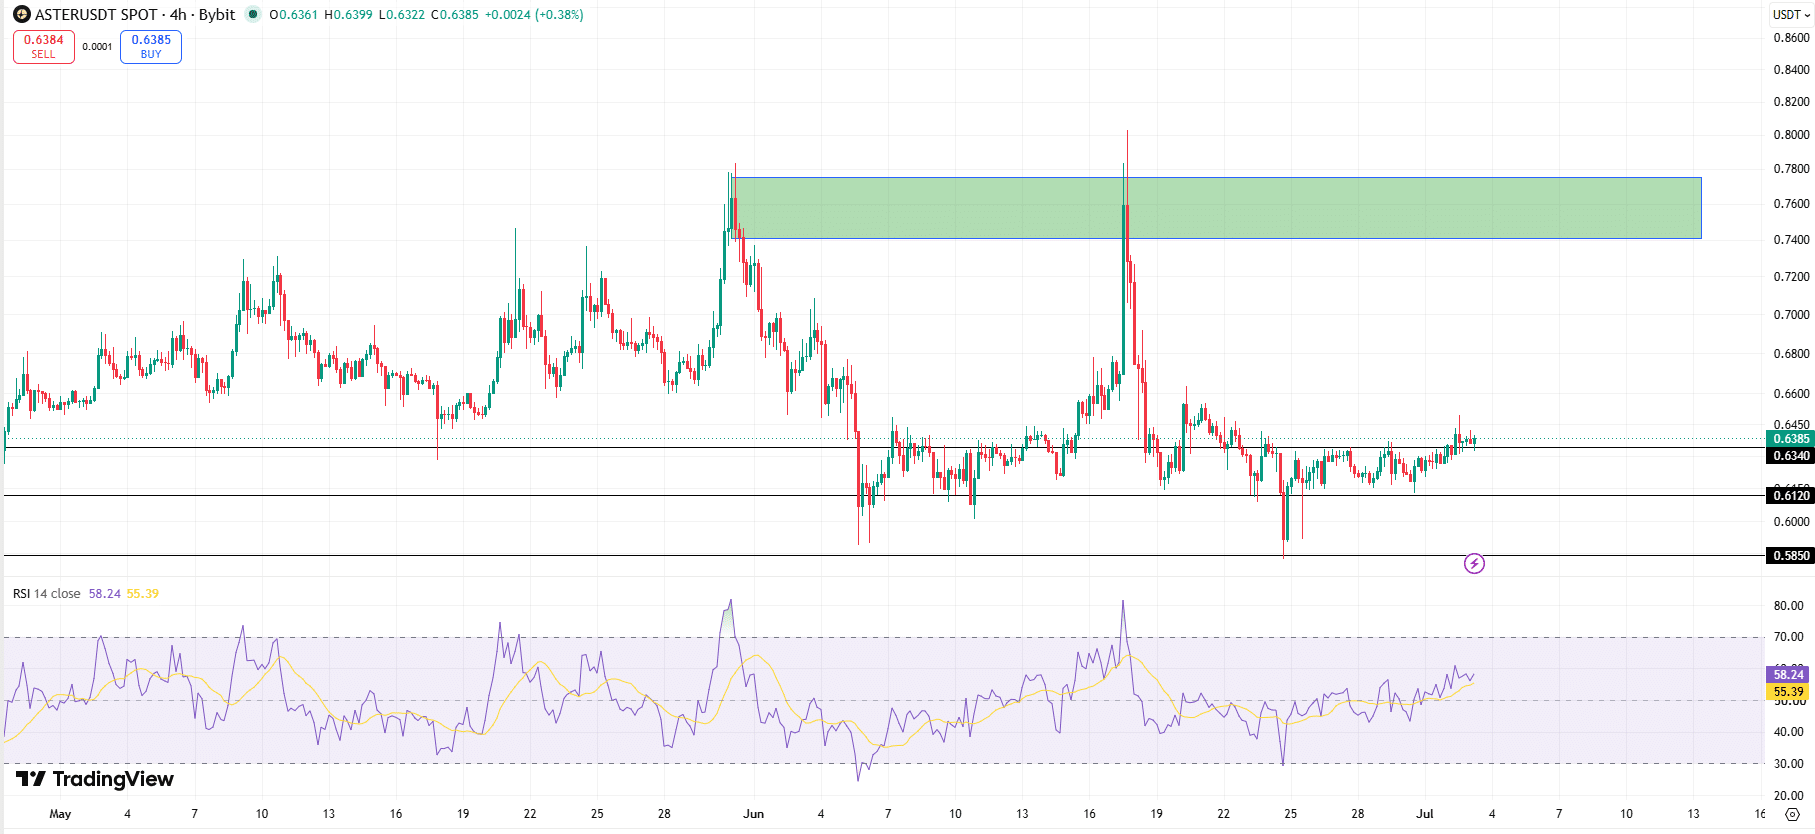
After spending several weeks consolidating, ASTER has climbed back toward the upper end of its multi-week price range. The coin fell into this range on June 5. While it broke out in mid-June to a high of $0.803 following news of the 99% fee buyback, it fell back and continued to trend within the range.

The recent uptrend has now shifted attention to whether ASTER can successfully break out and target higher prices. Meanwhile, ASTER is already showing early positive signs, with price now trending above the upper resistance trendline at $0.634.

Aster 4H Chart Analysis

The coin first broke out on June 2, following its rally to an intraday high of $0.649. Since then, ASTER has consolidated above the key zone, gaining momentum for the next uptrend. This presents an ideal entry point. If the price continues to trade above the $0.634 resistance, the chances of a rally higher remain.

Key Resistance Levels Ahead

The immediate resistance should the upward momentum begin is the $0.649 level. ASTER stalled there yesterday, and reclaiming it is crucial for a sustained uptrend.

If buyers successfully clear $0.649, the next technical hurdles appear near $0.665 and $0.709, representing an uptrend of 4% to 11% from the current price of $0.638. Beyond those levels, there are still resistance zones between $0.740 and $0.780.

Ultimately, the breakout could target the previous swing high around $0.803. From the current market price, this represents a 26% increase.

Notably, the bullish outlook would weaken if ASTER loses its breakout structure. Falling below $0.634 invalidates the breakout and pushes the coin back into a range. It also opens the path to retesting lower support regions.

The closest support is $0.612, representing a 4% drop from here. Below this level, another support sits around $0.602. Meanwhile, $0.585 marks the most important floor on the chart, as it represents the lower support of the price range.

A convincing close beneath that level would invalidate the current recovery setup and could expose the token to a deeper decline toward $0.542 and $0.514.

Cardano Founder Says SecondFi Hack Is a Fundamental Win for ADA Holders

0

Charles Hoskinson believes that the recent SecondFi wallet exploit could ultimately strengthen the Cardano ecosystem rather than weaken it.

As concerns continue to grow that the incident could expose ADA users to additional attacks, Hoskinson has pushed back against those fears. In his recent commentary, he argued that the event will accelerate improvements across the ecosystem and lead to stronger security standards for wallet providers.

SecondFi Exploit Is a Fundamental Win for Everybody: Hoskinson 

According to Hoskinson, ADA holders will benefit from a broader range of security options following the exploit. These improvements may include more resilient wallet architectures, stronger authentication methods, and additional protective mechanisms designed to reduce the risk of similar exploits in the future.

Consequently, Hoskinson views the incident as a catalyst for innovation in wallet security rather than evidence of any weakness within the Cardano blockchain itself.

Furthermore, he expects the exploit to reinforce the ecosystem’s commitment to open-source development while increasing skepticism toward closed-source solutions. Hoskinson described this shift as “a fundamental win for everybody.”

SecondFi Users Continue Recovery Efforts

Meanwhile, ADA users are still recovering from the attack on SecondFi, formerly known as Yoroi Wallet, which is operated by EMURGO, one of Cardano’s founding entities.

The exploit, which occurred last week, resulted in losses totaling 16 million ADA across three separate wallet-draining incidents.

In a statement released today, EMURGO confirmed that its teams are collaborating with technical experts from across the Cardano ecosystem on an on-chain recovery process that remains on schedule. 

Notably, the company is developing an on-chain claims portal that will enable affected users to recover their assets once the reimbursement process begins. SecondFi also urged users not to delete the app and advised them to keep their seed phrases secure to simplify future recovery efforts.

In the meantime, the company has launched an official wallet checker tool that allows users to determine whether they were affected by the exploit. EMURGO further disclosed that assets recovered by white-hat responders remain secure and will contribute to the reimbursement effort.

Additionally, the company has established a recovery fund aimed at compensating victims affected by the exploit.

Hoskinson Reiterates That Cardano Was Not Hacked

Amid widespread fear, uncertainty, and doubt surrounding the incident, Hoskinson reiterated that the attack targeted a specific application built on the network rather than the Cardano protocol itself.

He emphasized that Cardano has never been hacked since launch and continues to operate normally, with block production proceeding at a consistent pace.

Cardano Foundation Hints at Deeper Open USD Engagement, Says “We Are Exploring Other Integration Options” 

0

The Cardano Foundation has reassured the community that Cardano’s involvement in the emerging Open USD (OUSD) ecosystem could extend well beyond the project’s initial launch announcement.

In its congratulatory message following the Open USD stablecoin launch, the Foundation highlighted its early alignment with the new stablecoin initiative. Specifically, it emphasized that its partner, Brale, joined Open USD as a launch partner.

This connection is significant because Brale already maintains a working relationship with the Cardano ecosystem. In 2025, Brale partnered with the Cardano Foundation to support compliant and native stablecoin issuance on the network. As a result, the Foundation views Brale’s participation in Open USD as a potential bridge linking the stablecoin initiative to Cardano. 

Notably, the Foundation revealed that it is exploring additional integration options, signaling that Brale may represent only one of several possible pathways into the OpenUSD ecosystem. The organization added that it would share further details as discussions progress.

Community Concerns Intensify Over Cardano’s Absence

The Foundation’s comments arrived amid growing criticism from community members after Cardano failed to appear among the organizations publicly associated with Open USD.

The consortium includes major financial and payment firms such as Visa, Ripple, MoonPay, and Mastercard. Their participation prompted questions about why Cardano and its founding organizations were absent from the official list despite the network’s increasing focus on real-world financial applications.

Meanwhile, Cardano founder Charles Hoskinson attributed the situation to governance decisions made by delegated representatives (DReps). According to Hoskinson, the community had previously rejected proposals designed to accelerate Cardano’s commercialization efforts through on-chain voting. 

In his view, those governance outcomes have directly influenced the ecosystem’s ability to pursue strategic business partnerships and broader market adoption. 

DRep Calls for Stronger Commercialization Efforts

Amid the ongoing debate, prominent Cardano DRep Dori publicly reconsidered his previously cautious stance on treasury-funded commercialization initiatives.

Dori argued that the ecosystem can no longer depend exclusively on the efforts of the Cardano Foundation and EMURGO to drive business adoption and ecosystem expansion.

Consequently, he urged governance participants to become more supportive of commercialization proposals to empower Input Output Global if Cardano hopes to remain competitive with rival blockchain networks.

Stablecoin Growth Remains a Key Priority

In the meantime, the Cardano community continues to advocate for a robust stablecoin ecosystem capable of accelerating decentralized finance activity on the network.

The introduction of the USDCx stablecoin earlier this year helped push Cardano’s stablecoin market valuation above $60 billion. However, that figure has since declined slightly, standing at $59.1 billion at press time.

Against this backdrop, the Foundation’s suggestion that additional OpenUSD integration pathways remain under consideration has attracted considerable attention, as many community members view a stronger stablecoin presence as essential to Cardano’s long-term DeFi ambitions.

XRP Primed for Falling Wedge Breakout to $2

0

Momentum is building for XRP within a multi-month falling wedge, with a breakout holding the potential for an over 2x rally.

Market analyst Crypto Michael identified this trend in his July 1 X post. His commentary sees XRP finally breaking free from a pattern that has compressed its price action since November 2024 to retest prior highs.

XRP Building Momentum for a Breakout

Michael revealed that he has been accumulating XRP at the current levels, taking advantage of the dip to buy at a lower price. Notably, XRP has dropped over 70% from its July 2025 all-time high of $3.66. Yet for the experienced market trader, the asset has not lost its appeal, particularly due to a formation on the weekly chart.

The shared chart shows that XRP has started tightening within a falling wedge. The coin began to form this pattern during the historic November 2024 bull run. XRP established the structure’s support trendline around $2.10, then consolidated for months before starting to form the upper trendline in July 2025.

XRP Nears Triangle Breakout/Crypto Michael
XRP Nears Wedge Breakout/Crypto Michael

Since the peak at $3.66, XRP has consistently formed lower highs and lower lows. Amid the downtrend, the structure’s upper and lower resistance began to tilt closer to each other, forming a more constricted consolidation.

Notably, when price action becomes more compressed within a structure, it signals that momentum is building. Buyers and sellers are beginning to find a balance, which precedes a violent breakout. It is in anticipation of this decisive move that the analyst noted he was buying XRP here.

Breakout Targets Major Support

Last week, XRP tested the lower trendline of this falling wedge, with buyers stepping in to defend the support. A strong start to July has seen the asset bounce from the support, up 6% from the lows to $1.06.

Michael expects a breakout soon towards the $1.90 to $2.10 price region, a 79% to 98% bounce from the current market price. Notably, this is a strong support region for XRP. During the 2021 bull run, XRP peaked around this price level, specifically at $1.96.

After breaking above in November 2024 to peak at $3.39 in January 2025, XRP also pulled back to the $2 support region and built a base there for several weeks. From there, it rallied to its current ATH.

This makes reclaiming the $1.90-$2.10 support crucial. A wedge breakout to this region and a sustained trend above open the path for a moonshot to much higher prices.

Bullish Network Activities Boost Breakout Prospect

The breakout prospect receives a boost from the recent growth in network activity around the XRP ecosystem. For context, newly activated addresses on the XRP Ledger reached 6,000 daily, a 3-month high.

XRP active addresses also increased 36% in two weeks, reflecting renewed network usage. On top of this, the Whale vs. Retail spread across all exchanges rose by 24.9%, showing that whales are rapidly moving XRP off exchanges more than retail users.

A string of these strong on-chain developments could provide the required fuel for the wedge breakout.

Ripple Ramps up RLUSD Mints in July, with $225M Deployed on XRPL Within Two Days

0

Ripple has ramped up mint activity around its proprietary stablecoin RLUSD in July, deploying over $200 million on the XRPL within two days.

A few days after rebalancing RLUSD supply between the XRP Ledger and Ethereum, the two native networks supporting the stablecoin, Ripple has started increasing issuance more aggressively on the XRP Ledger as July begins.

In just the first two days of July, Ripple minted a total of $291.6 million worth of RLUSD across the XRP Ledger and Ethereum. 

Of this amount, about $225.8 million, which represents roughly 77%, was issued on the XRP Ledger, according to data from a community-driven RLUSD tracker built by XRPL validator Vet.

RLUSD Mint Activities

On-chain data shows that the minting activity started with 11 million RLUSD issued on the XRP Ledger at 3:41 PM UTC on July 1. Shortly after, Ripple carried out smaller transactions ranging from $600K to $995K, all within a short 13-minute window.

Later that same day, the firm minted $65.3 million on XRPL at 8:02 PM UTC, followed by another $78.85 million about an hour later. The $78.85 million mint represents the largest single RLUSD issuance across all networks since the $200 million minted on XRPL on May 20. 

Ripple then moved a portion of the mint volume to Ethereum on July 2. As the day came to an end, the blockchain firm began burning part of the supply on XRPL, indicating that it was adjusting supply levels across both networks.

Daily RLUSD Mint and Burn Volumes

Overall, on July 1, Ripple minted a total of $169.8 million in RLUSD and burned just $150K. Interestingly, almost all the mint volume, about $169.5 million, took place on the XRP Ledger, while the entire $150K burn happened on Ethereum.

RLUSD Growth Across Ethereum and XRPL

Meanwhile, on July 2, Ripple minted $121.8 million and burned $68.1 million. Of this volume, it minted $56.3 million on the XRPL but burned slightly more at $58.1 million. In contrast, Ethereum saw $65.5 million worth of mints with $9.9 million in burns, leading to stronger net growth for the day.

Across both days combined, Ripple minted $291.6 million and burned $68.25 million. From this total, the XRP Ledger saw $225.8 million in mints and $58.1 million in burns, leading to a net increase of $167.7 million. Ethereum recorded $65.8 million in mints and $10.05 million in burns, resulting in a net increase of $55.75 million.

However, further data confirms that much of the supply added on XRPL appears to be replacing tokens that Ripple redeemed earlier toward the end of June.

Specifically, on June 30, Ripple burned about $146.3 million worth of RLUSD on the XRP Ledger. After accounting for mints that day, this led to a net supply change of -$136.1 million. 

Over the past seven days, Ripple has burned $205.8 million in RLUSD on XRPL while minting $246 million.

RLUSD Supply Change on XRP Ledger

Current RLUSD Supply Distribution

After these recent minting and burning activities, the total RLUSD supply across both networks now stands at $1.634 billion. Out of this, $844.5 million, or 51.7%, resides on the XRP Ledger, making it the slightly larger share.

Ethereum holds $789.83 million, which represents about 48.3% of the total supply. This shows that Ripple continues to support both networks, even though recent activity has leaned more toward XRPL.

XRP Has Always Experienced a Relief Bounce or the Start of a Bull Run in July Since 2020

0

Since 2020, XRP has experienced a relief bounce or the start of a bull trend in July, having recorded no red July candlestick during this period.

Notably, chart data supports this observation at a time when investors anticipate much-needed relief from the ongoing downtrend. Specifically, XRP has witnessed eight red monthly candlesticks out of nine since October 2025, recently dropping nearly 22% in June 2026.

Amid the downturn, historical data indicates that a relief bounce may be on the horizon in July. Interestingly, since 2020, XRP has often experienced losses in June. However, this has always been followed by a relief surge in July or the start of a bullish trend shift.

How XRP Performed in July from 2020 to 2023

For instance, XRP recorded a steep 13.55% decline in June 2020 amid a bear market downtrend that began after it collapsed from the $3.31 peak in January 2018. This downtrend lasted for over two years, but concluded after XRP’s rebound in July 2020.

Specifically, XRP spiked more than 48% in July 2020, marking its highest monthly gain in nearly two years. From here, August built on the rebound with an 8.29% gain. Despite occasional monthly declines, data shows XRP saw an upward trend after the July 2020 surge, eventually reaching the $1.96 high in April 2021.

However, after this local top, a pullback ensued, with May 2021 delivering a 34.77% loss and June 2021 seeing a 32.3% decline. 

Interestingly, a recovery emerged in July 2021 with XRP rebounding 6.91% that month and extending the gains with a 59% gain in August 2021. Nonetheless, this was merely a relief bounce, as the downtrend persisted later on.

This downtrend lasted for another year, and the Terra ecosystem crash of May 2022 exacerbated the situation. From April to June 2022, XRP collapsed 59%, but a rebound played out in July 2022, when the price recovered by 14%. While this also marked a relief bounce, XRP only consolidated from here instead of trending lower.

XRP Performance in July

July 2023 to 2025 Marked Pivotal Periods for XRP

Meanwhile, from 2023 to 2025, July not only brought in gains for XRP, but it also marked pivotal moments for the crypto asset. Specifically, in July 2023, Judge Analisa Torres ruled that XRP was in itself not a security, going against part of the U.S. SEC’s argument in the Ripple case.

This ruling triggered a massive 47% increase in XRP’s price in July 2023, pushing XRP toward $0.94 before a pullback ensued. Besides the upsurge, the decision helped give XRP its much-needed legal clarity.

Further, in July 2024, XRP rose 31%, representing its highest monthly gain since the 47% rise in July 2023. Interestingly, this July 2024 increase marked the end of the ongoing consolidation that had lasted since July 2022, representing a trend shift. In less than four months, XRP saw the meteoric November 2024 upsurge.

Meanwhile, after XRP collapsed in February 2025, it entered a short period of consolidation around the $2 to $3 range. However, by July 2025, a rebound ensued, pushing XRP to its current all-time high of $3.66 before the ongoing downtrend began.

Will This July be Different?

Overall, XRP has seen consistent gains every July since 2020, with an average increase of 30% during the month. This pattern has built confidence among market participants who believe a trend shift or a relief bounce could occur again.

XRP Monthly Performance Since 2020

So far, XRP has already gained more than 2% this July, having recovered from $1.03 to $1.07 at press time. If the crypto asset sees at least a 30% increase this month, its price could soar to $1.33, recovering the $1.30 level. However, past performance does not guarantee that a similar trend will occur in the future.

Shiba Inu Take Profit Levels as Early Bull Run Signs Emerge

0

Key areas to watch as Shiba Inu appears to be approaching an important turning point after months of persistent selling pressure.

Although Shiba Inu (SHIB) remains caught in a broader crypto market downtrend, its latest chart structure suggests bearish momentum is beginning to fade. The next big step in confirming a recovery is if buyers can reclaim critical resistance levels.

SHIB Holds Support as Selling Pressure Begins to Ease

The daily chart shows SHIB stabilizing just above a major support area around $0.0000040, where its price is attempting to establish a durable base. Shiba Inu has consolidated there for several days, marking a crucial attempt by buyers to defend support areas after a prolonged decline.

Shiba Inu 1D Chart Analysis

Interestingly, besides holding the support, the broader technical setup has started to improve. The Relative Strength Index (RSI), which had fallen into oversold territory, is now turning higher.

The indicator fell below 30 on two occasions last month, dropping to 19.54 on June 5 and 21.44 on June 28. Today, SHIB’s RSI has recovered to 32.94. Historically, this type of movement has often appeared when downside momentum begins to weaken.

At the same time, volume has remained relatively subdued, suggesting that aggressive selling has eased compared with previous periods. These developments point to a gradual momentum shift from the extended decline seen earlier to a more stable market condition.

Even so, the prevailing trend has not yet changed. SHIB continues to move below a descending resistance line that has rejected every recovery attempt since May 11. Until that barrier gives way, a reversal that would start a bull run remains unconfirmed.

Initial Shiba Inu Take Profit Areas Upon Breakout

The descending trendline is now the most important technical level to watch, currently around $0.00000451. A decisive move above this zone would strengthen the case that buyers are regaining control and could shift momentum bullish.

If that happens, the first significant resistance level lies around $0.0000051, an 18% increase from the current market price of $0.0000043. A successful move beyond that area would bring the second take-profit area at $0.0000055 into focus. Meanwhile, a sustained momentum could see SHIB reach $0.0000066, a 52% growth from the current price.

However, those levels are only initial targets. When bulls fully regain control of the broader crypto market and upward momentum returns across the board, Shiba Inu could target higher prices.

Downside Risk Remains

Notably, since bears are in control of the market, downside risks cannot be fully eliminated despite the positive signs. Should the current support at $0.0000040 break, Shiba Inu could target lower prices.

According to an analysis, the first floor is at $0.00000241, aligning with the 1.272 Fibonacci extension. SHIB would have to fall 44% from the current market price to reach this level. Meanwhile, the second floor sits at the 1.414 Fibonacci extension at $0.00000155, a 64% crash from here.