Home Blog Page 751

XRP Above $2.41 Is Bullish, Below $2.15 Is Bearish — Anything In Between Is Just “Micro Noise”: Analyst

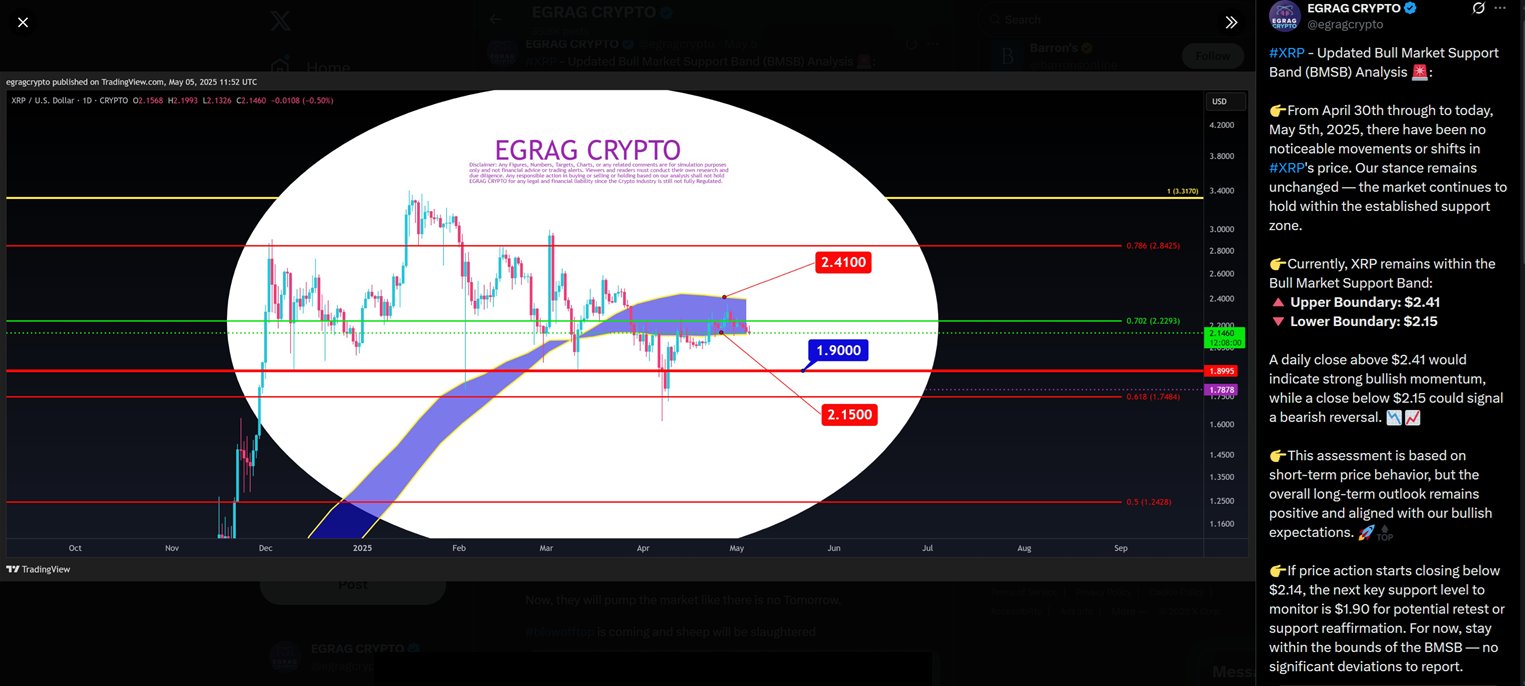
Renowned chartist EGRAG has issued an updated analysis of XRP price behavior based on the Bull Market Support Band (BMSB).

In the recent disclosure, he emphasized the importance of the current range between $2.15 and $2.41. According to the analyst, the market is in a crucial consolidation phase, where decisive moves above or below these levels could determine XRP’s next trajectory.

XRP Stuck in “Micro Noise” Zone

The latest commentary updates his analysis from May 5, when EGRAG noted that XRP was trading around $2.14, right at the edge of what he calls the Bull Market Support Band.

The analyst closely monitors this zone, ranging from $2.15 to $2.41, for a breakout or breakdown. He categorizes any price action within this range as “just micro noise,” suggesting it lacks a meaningful directional signal.

Notably, XRP is up over 6% today, trading at $2.30. EGRAG now suggests that a bullish breakout would be confirmed if XRP closes above $2.41 for three consecutive days.

Meanwhile, he noted that a close below $2.15 could invalidate short-term bullish sentiment and indicate a deeper correction. According to him, XRP remains in limbo until either level is breached with conviction.

Furthermore, EGRAG stated that if XRP fails to hold the $2.15 level, the $1.90 zone could become the next key support. This level may serve as a retest point where buyers could step in to drive a recovery attempt.
Image
XRP chart by Egrag

Macro Outlook Still Intact

Despite short-term uncertainty, the analyst maintains that macro targets for XRP remain unchanged. This reflects continued optimism for long-term price growth, provided the market maintains key structural levels.

In a previous commentary, EGRAG argued that XRP has the potential to surge 15x, reaching a new all-time high of $27 amid a BMSB retest. In another analysis, he projected even greater upside potential, with targets as high as $31.

Beyond his BMSB analysis, EGRAG has also relied on other technical indicators to support these bold projections.

Earlier this month, he forecasted that XRP could surge to $17 this year, citing a six-month candle pattern similar to one seen in 2017 that preceded a major rally.

After observing five similar monthly candles since November 2024, he believes a “mega candle” is imminent. If XRP hits $17 and breaks its macro channel, EGRAG projects a further rally to $55, aligning with other bullish predictions.

Other market commentators, such as Javon Marks, share a similar bullish outlook for XRP in this cycle. However, some, like Crashius Clay, argue that now is an ideal time to short XRP massively. In his view, XRP is overvalued.

Shiba Inu to $0.005? Here’s What Your 250M or 500M SHIB Tokens Could Be Worth

0

Shiba Inu investors holding 250 million or 500 million SHIB tokens could become millionaires if SHIB rallies to the ambitious target of $0.005. 

Shiba Inu is participating in the ongoing relief rally across the broader market. This rally pushed SHIB above the $0.000015 mark. Despite the surge, many investors still believe Shiba Inu’s performance is low, as they expect a higher threshold with fewer zeros.

Meanwhile, proponents continue to keep investors’ hopes alive that bigger upsides are coming. These enthusiasts believe Shiba Inu could eventually cancel more zeros and hit an unprecedented level of $0.005. 

Experts Set Timelines for Shiba Inu Surge to $0.005  

This $0.005 target has gained popularity within the Shiba Inu community in recent months. Several analysts argue the target is achievable, setting different timelines for when it could play out. 

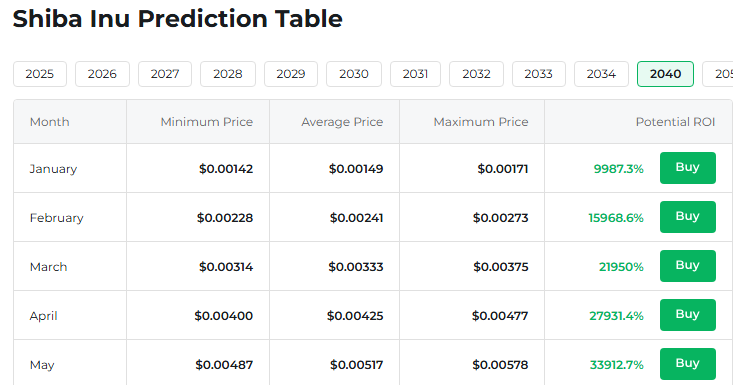
According to Changelly, Shiba Inu could reach the $0.005 price mark by May 2040. During this period, Changelly expects SHIB to trade at an average target of $0.00517 and a maximum target of $0.00578. 

Changelly SHIB Prediction for May 2040

However, leading crypto prediction platform Telegaon sees SHIB clinching the target sooner, specifically between 2036 and 2039. 

Worth of 250M or 500M SHIB Tokens at $0.005 

While these predictions are purely speculative, hitting the $0.005 milestone would translate to significant gains for early Shiba Inu investors. 

For context, Shiba Inu traded at $0.00001520 hours before press time. At this price, its valuation reached $8.95 billion, positioning it as the 15th largest cryptocurrency by market cap. 

Accordingly, hitting the $0.005 milestone would require a massive growth of 32,794% from the current price of $0.00001520. This would translate to a market capitalization of $2.94 trillion, surpassing Bitcoin’s current valuation. 

Meanwhile, a rise of that magnitude could put smiles on the faces of early investors, particularly those holding between 250 million and 500 million SHIB tokens. 

With Shiba Inu currently trading at $0.00001520, investors can purchase these 250 million and 500 million SHIB tokens for $3,800 and $7,600, respectively. 

Notably, a portfolio of 250 million SHIB tokens worth $3,800 today would be valued at $1.25 million if SHIB’s price eventually reaches the $0.005 target. Similarly, the 500 million SHIB holdings will be worth $2.5 million at a unit price of $0.005. 

Can SHIB Hit $0.005?

Although this analysis seems enticing, the major question revolves around whether Shiba Inu is capable of reaching the $0.005 mark, given its supply. 

Out of Shiba Inu’s total supply of 589.55 trillion tokens, approximately 589.25 trillion SHIB are in circulation. If the circulating supply remains at this level, Shiba Inu must surge 32,794% from its current price to reach the $0.005 target. 

Many might consider this growth highly unlikely due to investors committing funds to new tokens over existing ones. As a result, a massive burn is required to drastically reduce Shiba Inu’s supply to make the $0.005 target feasible. 

In a hypothetical scenario where Shiba Inu’s supply decreases to 50 trillion, SHIB would only need to soar by 2,693% from the current price to hit $0.005. This would put Shiba Inu’s market cap at $250 billion instead of the $2.94 trillion stated earlier. 

PEPE Coin Sees Dramatic Comeback: Breakout Targets Suggest 65% Bull Run Ahead

Pepe coin price rallies 40%, targeting a breakout above $0.000014. With a 65% upside potential, bulls are eyeing the $0.000021 mark.

As the crypto market reaches $3.28 trillion, meme coins are leading the charge. Pepe coin has surged nearly 40% today, reaching the $0.000014 level.

With a fresh bullish turnaround in the frog-themed meme coin, technical signals point to an upside potential of nearly 65%. Will this momentum help Pepe reclaim the $0.000020 mark?

Pepe Price Analysis

Pepe coin has created two massive, long-awaited bullish candles on the daily chart, sending its price rally into overdrive. The meme coin surged nearly 35% on May 8, followed by a 20% intraday jump today.

Pepe Price Chart
Pepe Price Chart

Following the bullish turnaround, Pepe has surpassed the 38.20% Fibonacci retracement level at $0.0000133. The short-term recovery has gained momentum, pushing the 24-hour high to $0.000013933, just shy of the $0.000014 resistance level.

The 50% Fibonacci level presents the next immediate resistance at $0.00001584. Meanwhile, the prevailing falling wedge breakout suggests a potential price surge toward the 78.60% Fibonacci level at $0.000021.

The MACD and signal lines have formed a positive crossover, supporting this bullish outlook. Additionally, the supertrend indicator has flipped bullish, reinforcing the continuation of the trend.

On the downside, the 23.60% Fibonacci level near the $0.000010 psychological support is crucial. A breakdown below this level would invalidate the bullish trend and could lead to a retest of the $0.000008832 support level.

Leverage-Driven Rally to Boost PEPE Prices

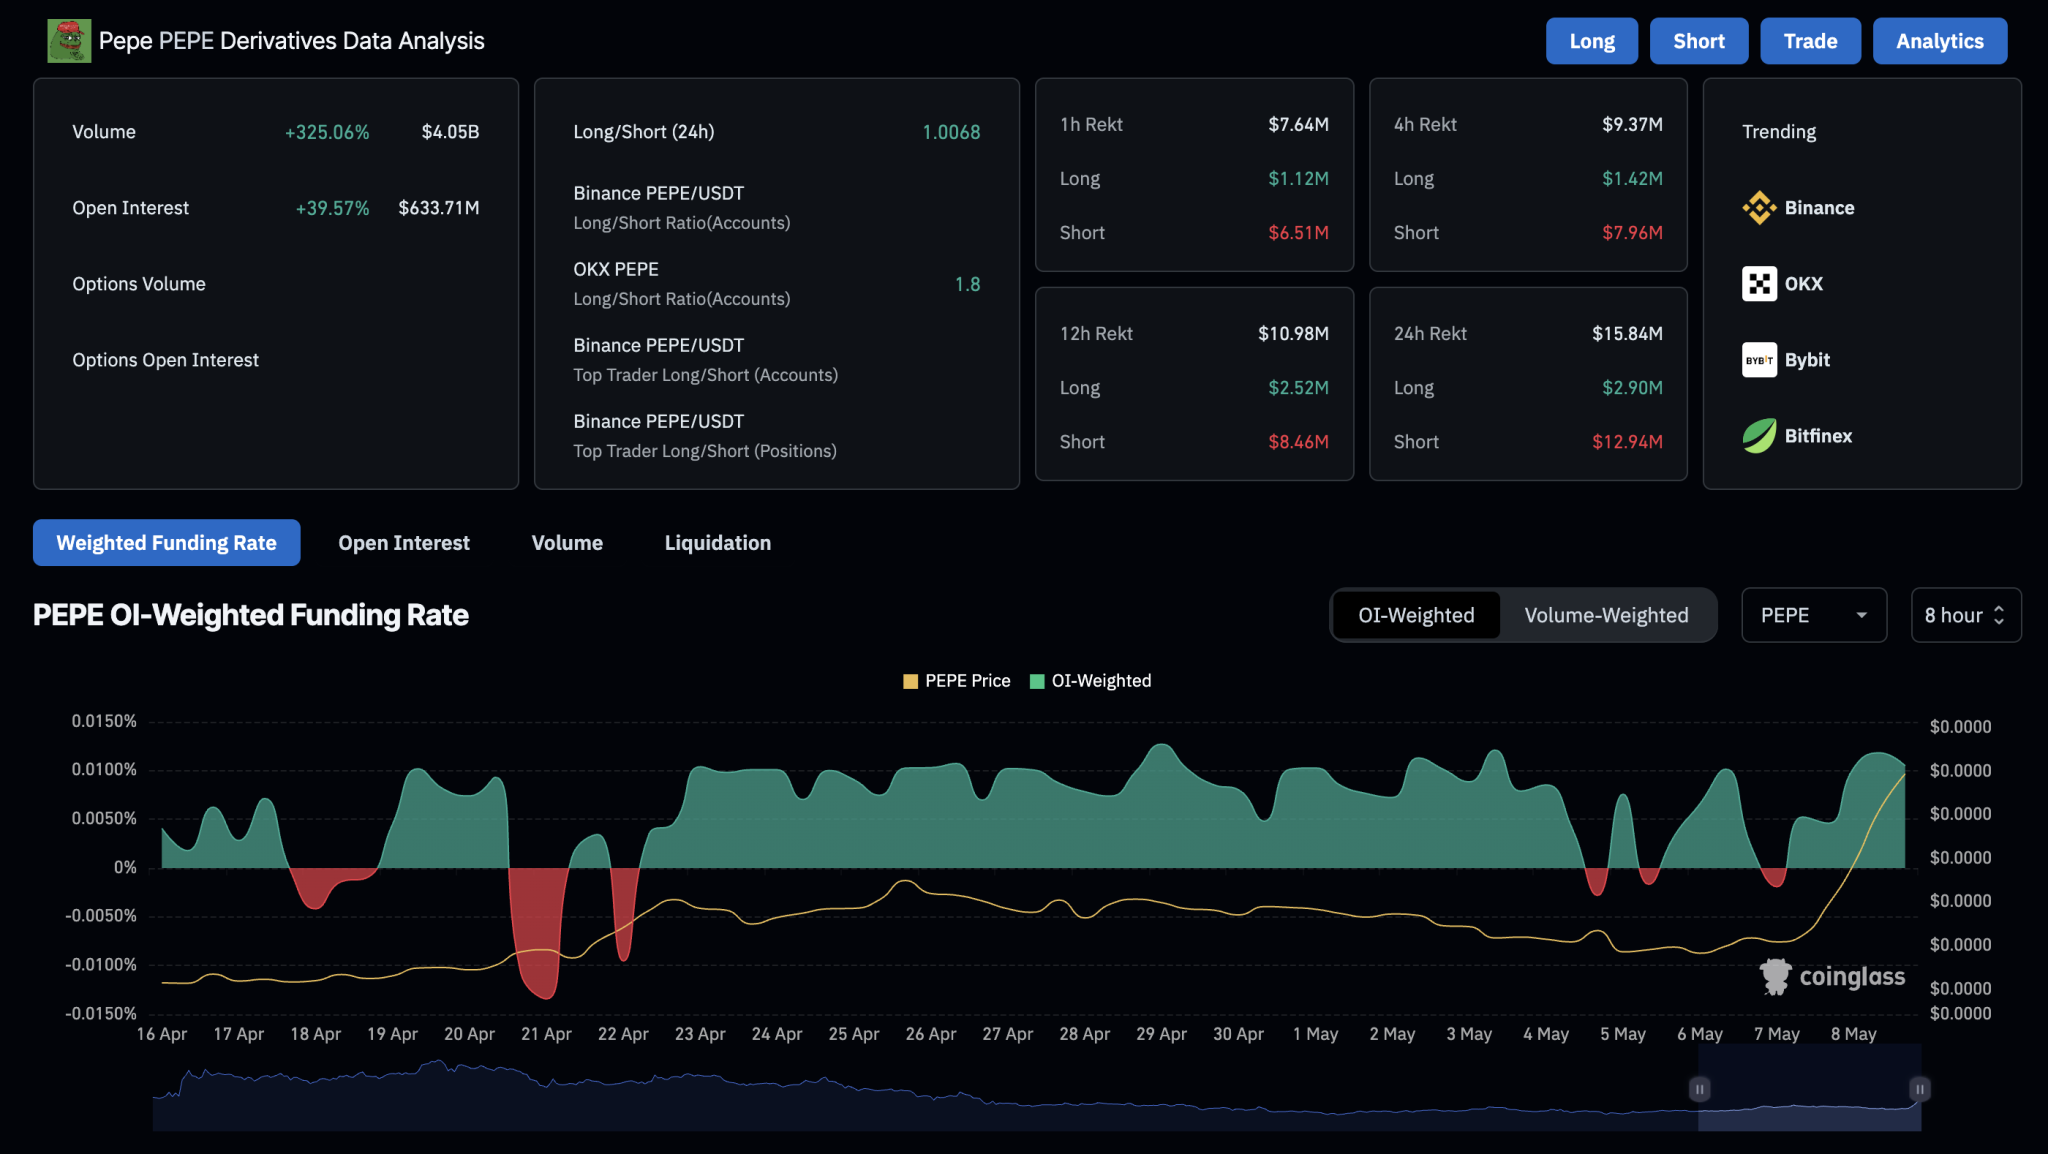
As the crypto market sees increased bullish activity in the derivatives space, Pepe has experienced a nearly 40% surge in open interest. According to Coinglass, PEPE’s OI now stands at $633 million. This spike has also pushed the funding rate up to 0.0105%.

Pepe Derivatives
Pepe Derivatives

The rise in both open interest and funding rate reflects growing bullish sentiment. Supporting this, short liquidations in Pepe over the past 24 hours have neared $13 million.

As Pepe bulls dominate the derivatives market, a leverage-driven rally could further fuel price momentum.

Dogecoin Breaks Out of Diamond Bottom Pattern: Here’s How High DOGE Can Go

0

Analyst Trader Tardigrade identifies a Diamond Bottom on the Dogecoin daily chart, highlighting a confirmed breakout and bullish reversal setup.

Notably, Dogecoin has surged past a key psychological level, trading at $0.2041 as of May 9, 2025. The move comes alongside a 24-hour gain of 11.7% and a seven-day increase of 13.2%. Trading volume also crossed $2.9 billion within the same period, reflecting heightened market interest. 

While this price action is notable, the focus now turns to technical and on-chain indicators signaling the potential for sustained upward movement.

Dogecoin Diamond Bottom Breakout 

Tardigrade identified a Diamond Bottom pattern in the daily timeframe, a classic bullish reversal formation. This pattern followed a prolonged downtrend from January’s $0.40 high to an April low near $0.13. As the pattern developed, price volatility expanded before narrowing, forming the diamond-shaped structure.

The diamond’s upper trendline had resisted price advances on several occasions. However, Dogecoin recently broke above this boundary, signaling a potential trend reversal. 

Tardigrade’s chart marked the breakout area. Now, the analyst is targeting $0.29 next for DOGE, implying a 45% increase from the $0.20 mark.

Adding to The Bullish Setup

On a separate 12-hour chart, analyst Javon Marks identified a falling wedge stretching from a $0.48 high in late 2024 to a narrowing range between $0.14 and $0.16. Dogecoin has now moved beyond the wedge’s upper boundary, which typically suggests a bullish breakout.

Image

Further supporting this view, Marks’ chart featured a curved trajectory pointing toward $0.30. This short-term projection complements a longer-term technical target at $0.65. Achieving this level would represent a 225% move from the current price. 

Moreover, the Relative Strength Index (RSI) showed higher lows between February and April even as the price declined. This positive divergence indicates weakening bearish pressure, reinforcing the strength of the recent breakout.

On-Chain Metrics Show Strong Network Growth

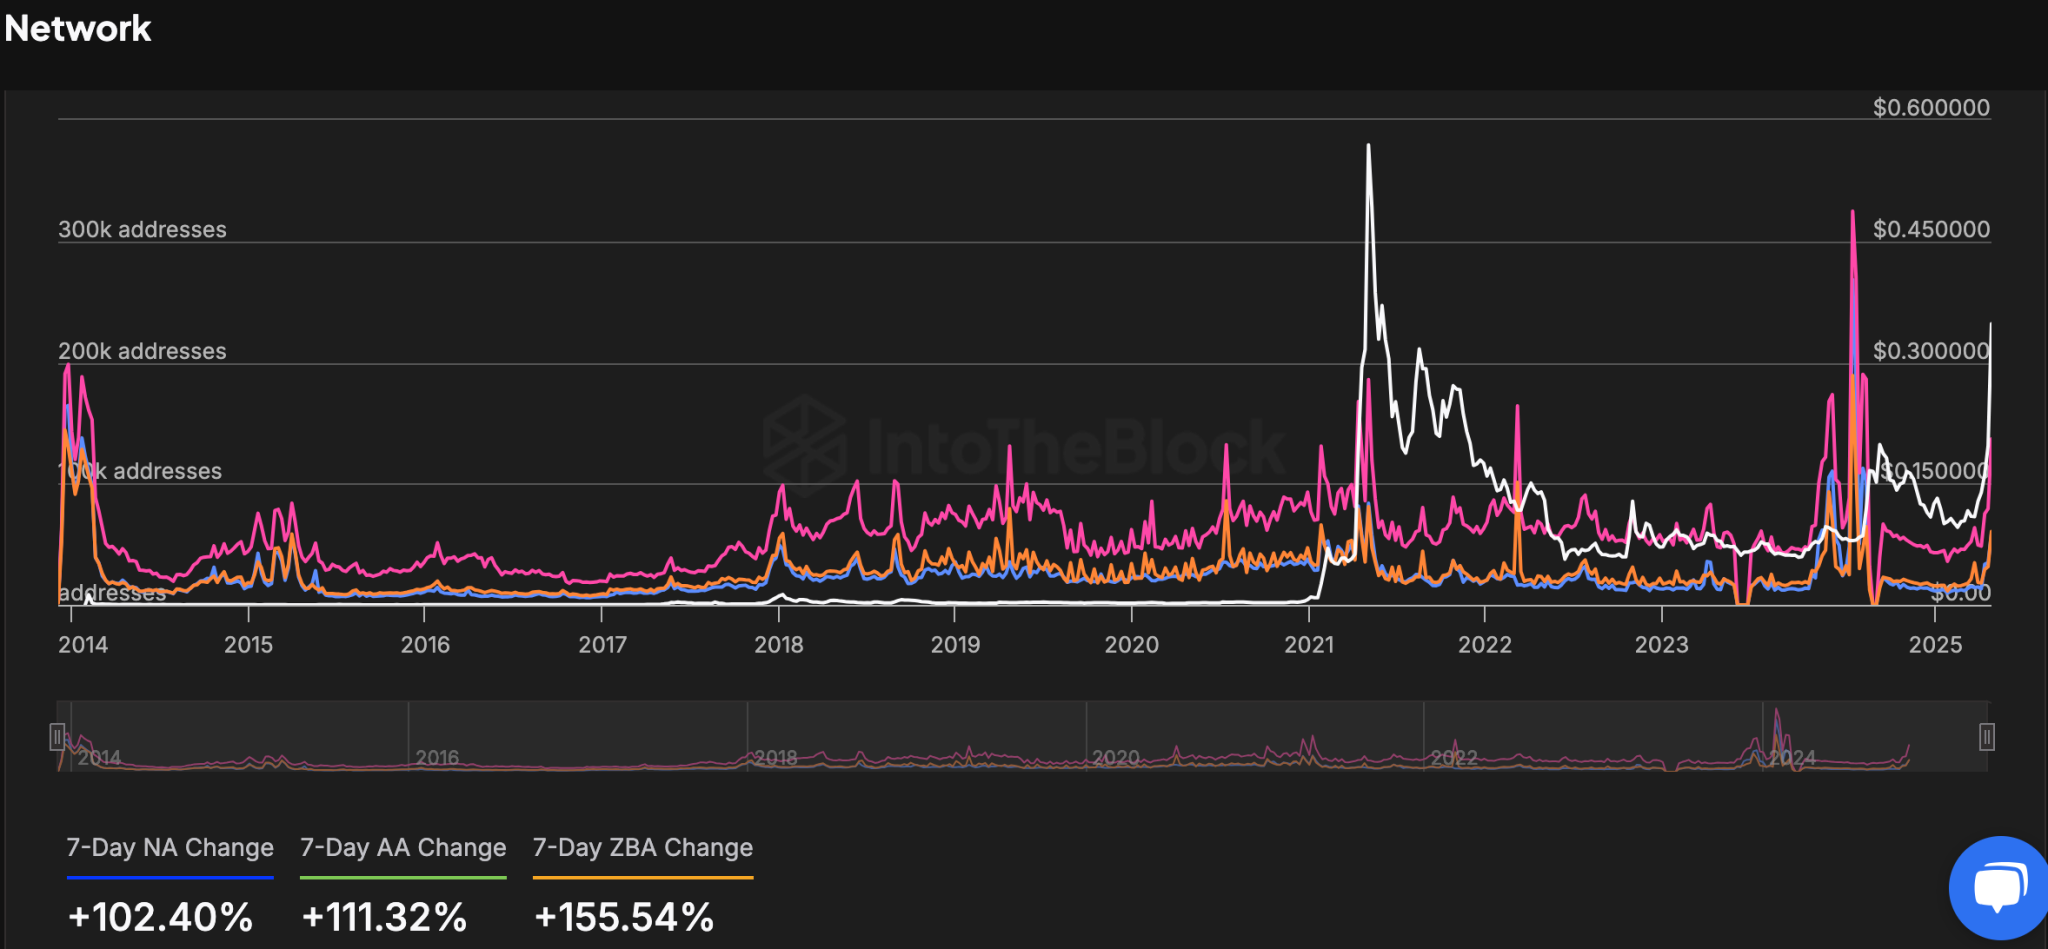
On-chain data from IntoTheBlock also supports the technical patterns, revealing substantial increases in Dogecoin network activity. The latest 7-day data highlights a 102.40% rise in new addresses, suggesting a sharp influx of new participants. 

Dogecoin Daily Active Addresses

Simultaneously, active addresses increased by 111.32%, pointing to elevated usage across the network. Additionally, the number of zero-balance addresses climbed by 155.54%, reflecting a surge in wallet creation or activity.

Shiba Inu Eyes 60% Upside to $0.000021 Amid Massive Short Liquidations

Shiba Inu rallies to $0.00001493 as short liquidations soar. Can SHIB sustain its bullish momentum toward $0.00002137, signaling a potential 60% upside?

As the crypto market experiences nearly $1 billion in liquidations, this bearish shakeout fuels an ongoing bullish rally. Amid the recovery trend, Shiba Inu has surged to $0.00001493, positioning itself for a potential breakout.

The meme coin has climbed 3% today, following a 12.5% gain on May 8. With the bullish trend continuing, is a breakout rally toward the $0.00002137 mark within reach?

Shiba Inu Price Analysis

After consolidating below the $0.000015 level following the early 2025 downturn, Shiba Inu is now forming a rounding reversal pattern. With two consecutive bullish candles, the meme coin has broken above the 50-day and 100-day EMA lines and the 23.60% Fibonacci level at $0.00001390.

Shiba Inu Price Chart

The ongoing recovery is now testing the critical supply zone near the psychological $0.000015 level. A successful breakout would invalidate the previous downtrend and kickstart a new bullish phase in SHIB’s price action.

Based on Fibonacci retracement levels and dynamic averages, the immediate resistance for this breakout rally lies at the 38.20% level, near $0.000016. As optimism across the crypto market grows, technical indicators reinforce the upward momentum.

Although short-term volatility recently caused a false signal on the MACD, the latest bullish crossover now indicates a renewed uptrend. In addition, upward movement in both the 50-day and 100-day EMAs suggests a trend reversal is underway.

According to Fibonacci projections, the breakout rally could face major resistance at the 61.80% level, around $0.00002137. This implies an upside potential of over 60% for SHIB from the current level.

On the downside, if Shiba Inu fails to break through the supply zone, key support levels remain at the 50-day EMA of $0.00001326 and the psychological level of $0.000010.

Bulls Shake Out $1.79M in Short SHIB Positions

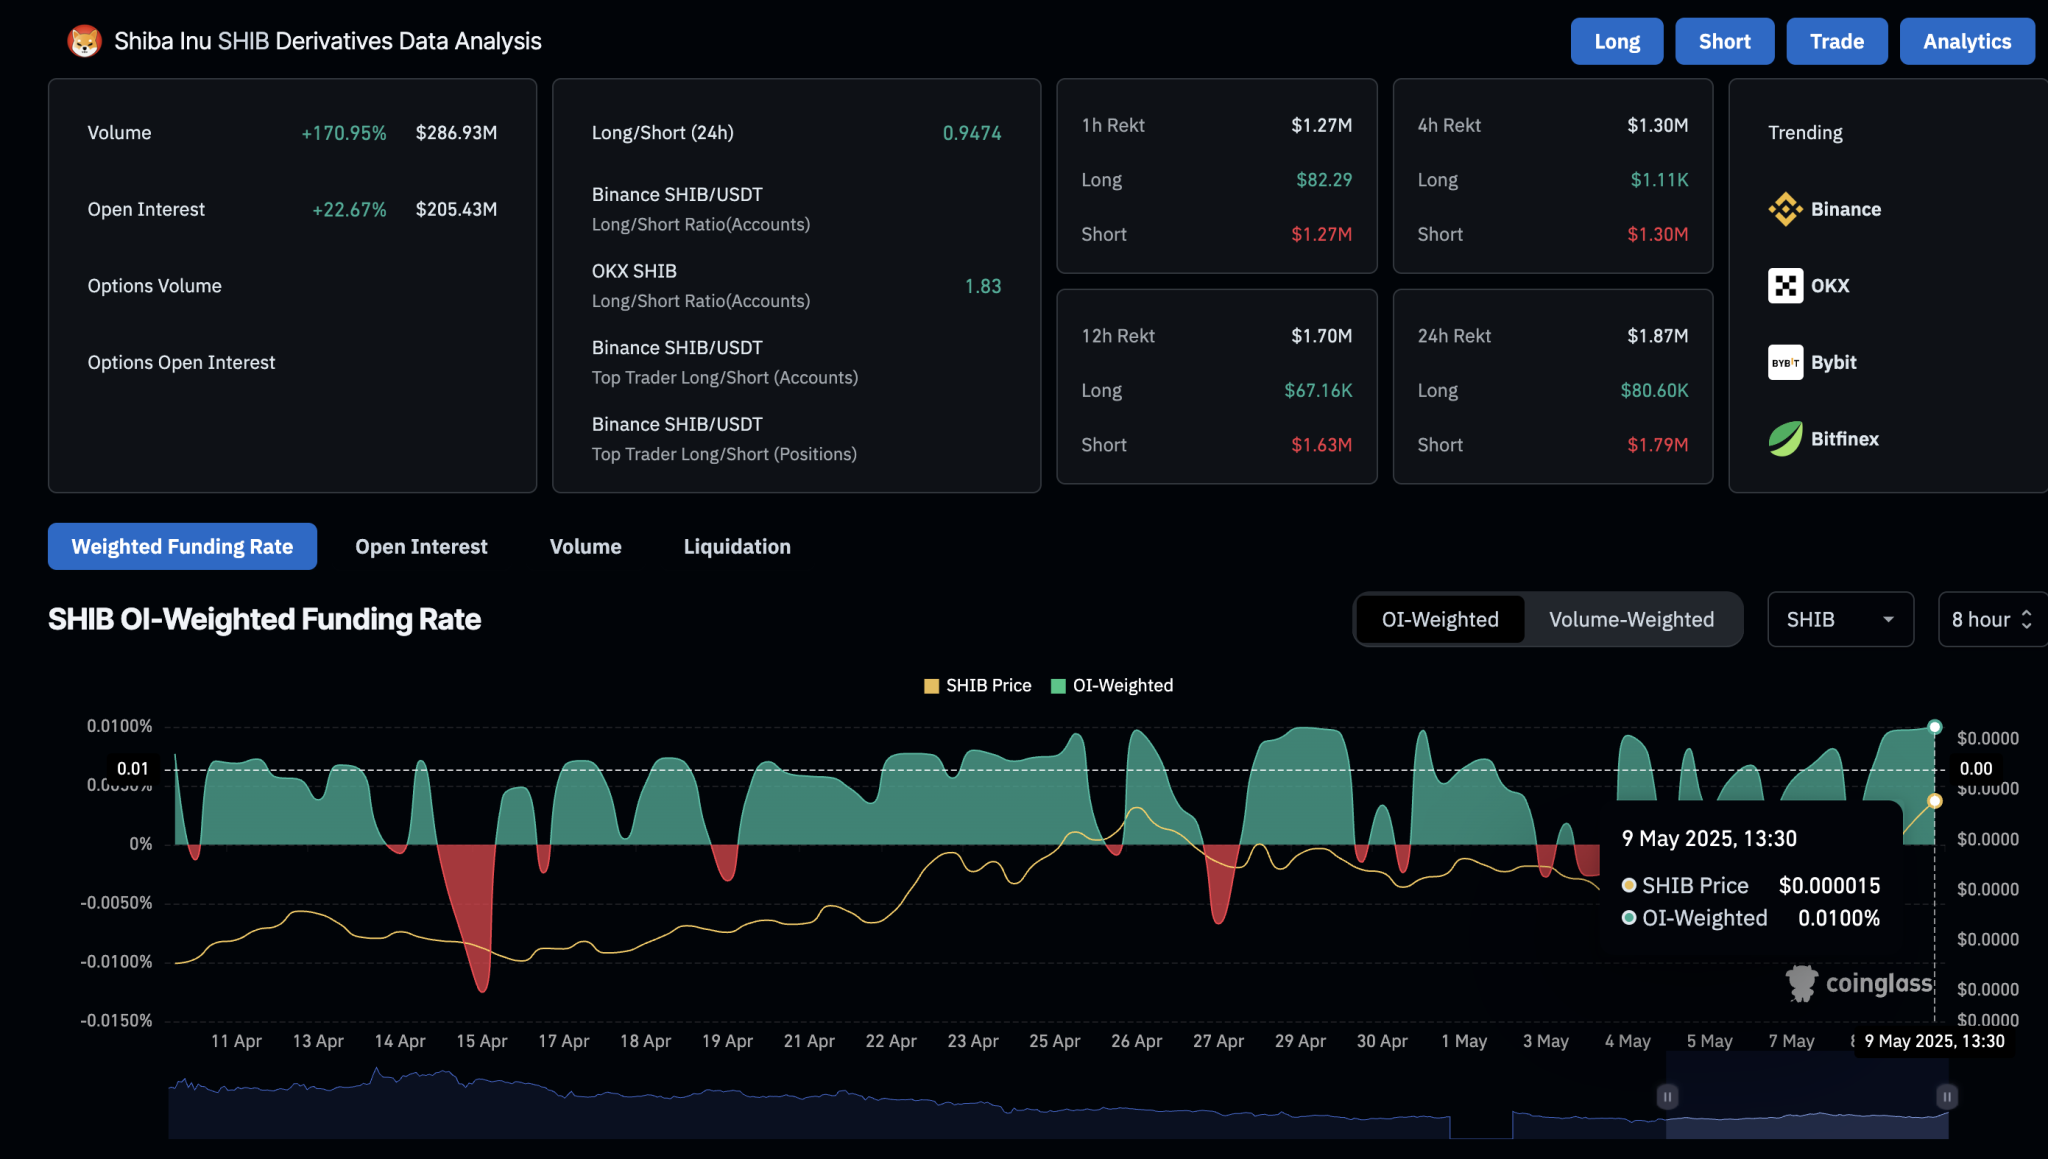
Amid the strong bullish momentum in Shiba Inu, data from Coinglass shows that short liquidations over the past 24 hours have surged to $1.79 million. Amid the bearish shakeout, the open interest surges by 25.43% to reach $209.75 million, signaling growing traders interest in SHIB.

Shiba Inu Derivatives

Further supporting the bullish narrative, the OI-weighted funding rate has climbed to 0.010%, indicating increased long positioning and bullish market sentiment.

Starks Founder Says Bitcoin Price Has One More 10x to $1 Million and It Is Inevitable

0

Recent Bitcoin price movements have revived long-term forecasts, as Muneeb Ali, the founder of Bitcoin Layer 2 platform Starks, says another 10x rise is inevitable.

While short-term volatility has remained, Ali’s projection has drawn attention due to Bitcoin’s historical trajectory and its continued expansion in market value. His statement arrives during a period of renewed optimism, following a notable climb in Bitcoin’s price earlier in the week.

Bitcoin Climbs Above $104K Before Daily Pullback

Beginning May 6, Bitcoin registered a sharp upward trend. It advanced from around $93,000 to exceed $104,000 by May 8, showcasing solid momentum over a short span.

This surge reflected a 1.54% increase across seven days, despite a 4.14% pullback within the last 24 hours. While this short-term dip marked a break from the rally, overall sentiment remained aligned with the asset’s broader upward pattern during the week.

Following this movement, attention turned to Ali’s long-term outlook. Muneeb Ali cited Bitcoin’s historical milestones to justify the projection. According to his breakdown, each prior surge followed a similar exponential trajectory.

He outlined three distinct phases, beginning with the leap from $100 to $1,000, continuing to $10,000, and eventually reaching $100,000.

For perspective, in July 2013, Bitcoin was trading at approximately $100, but within just four months, by November 2013, it surged to $1,000, marking a 10x increase. From there, Bitcoin continued its climb more gradually, reaching $10,000 by November 2017, exactly four years later. The growth trend extended further as Bitcoin eventually hit the $100,000 milestone in December 2024.

With the current price at approximately $103,741, the next move would require an 863.9% increase to reach $1 million. However, Ali did not specify the underlying reasons behind his prediction.

Bitcoin Price to $1 Million by April 2031

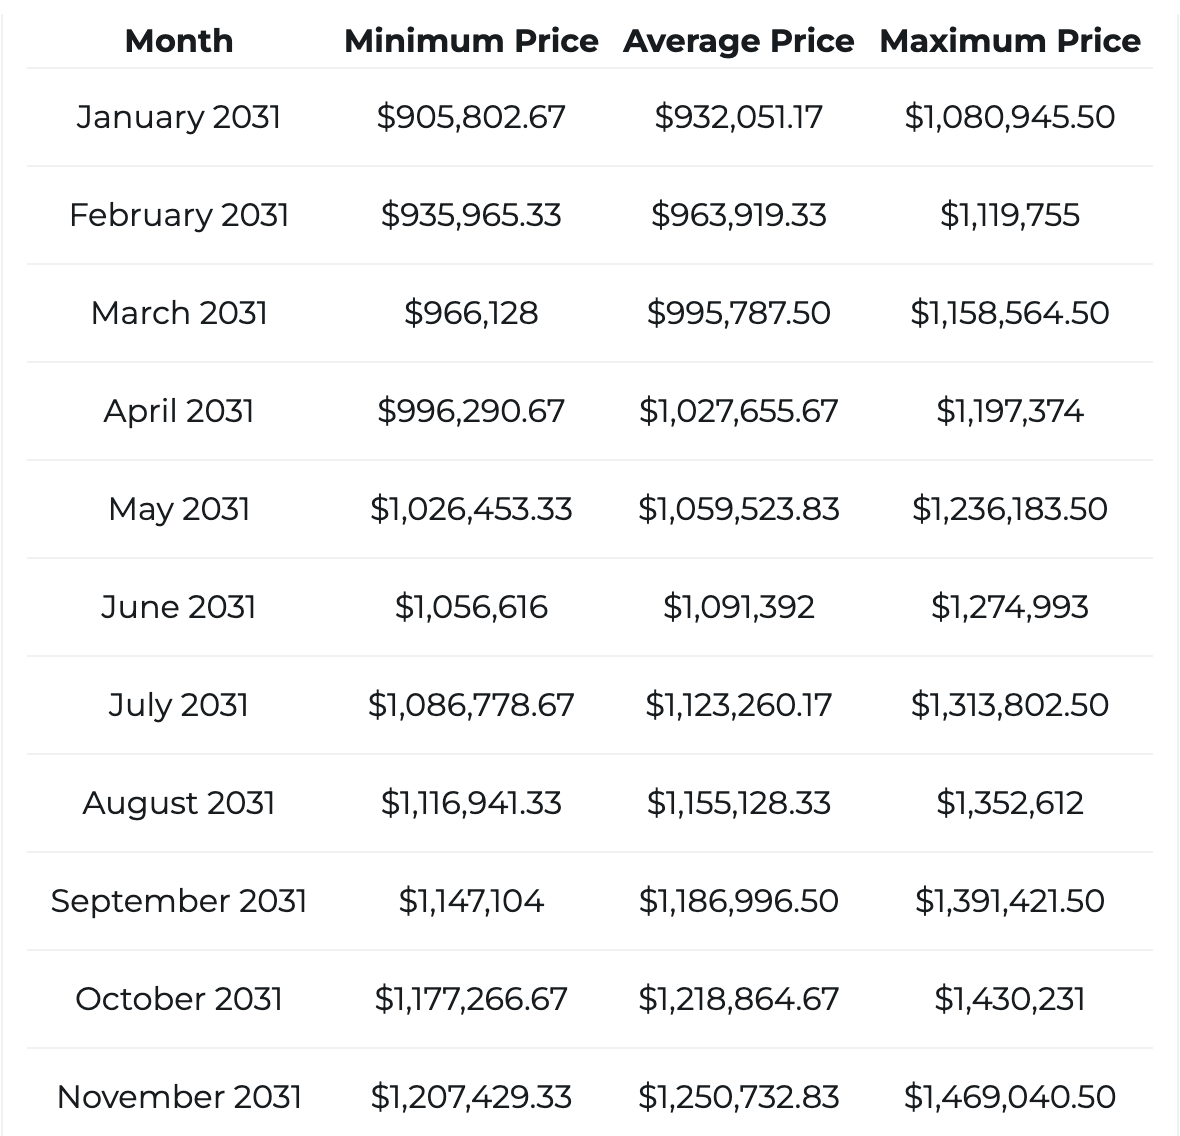
Notably, monthly projections from Changelly indicate that Bitcoin could cross the $1 million mark as early as April 2031, with minimum, average, and maximum prices steadily increasing throughout the year. In January 2031, the average price is expected at $932,051, rising to $1,027,655 by April and $1,250,732 by November.

Bitcoin Price Prediction

Elsewhere, yearly projections by Price Predictions suggest Bitcoin could surpass $1 million by 2033, with the maximum price that year estimated at $1,009,491.22. The outlook shows consistent growth, beginning with a high of $185,416.75 in 2025 and reaching $803,472.60 by 2031.

Analysts and Models Align on $1M Bitcoin Price Target

Ali’s prediction is just one of the many who believe Bitcoin is headed for $1 million. In April, attorney Zack Shapiro from the Bitcoin Policy Institute examined the potential impact of the Bitcoin Act, a bill reintroduced in March. The act proposes that the U.S. government acquire one million BTC—5% of the total supply—over five years. 

Shapiro noted that this acquisition plan, funded by gold revaluation, could trigger large-scale market reactions. He stated that such a move might drive Bitcoin to $1 million due to demand pressure and follow-on market effects.

Binance’s CZ Sees $1M This Cycle

Most recently, in May, Binance co-founder and former CEO Changpeng Zhao predicted that Bitcoin could reach $500,000 to $1 million during the current bull cycle. He made the statement on a RugRadio podcast with Farokh Sarmad. 

Zhao had previously made a similar call in February but did not assign a timeline until this appearance. 

Top Analyst Shares Cardano Exit Strategy for Maximum Gains All the Way to an $8.5 Target

0

A top market watcher has shared his exit strategy for Cardano, which he suggested will be crucial for maximum gains this bullish cycle.

Dan Gambardello shared his strategy to maximize the impending Cardano price explosion in a May 8 tweet. He insisted that such preparedness for the rally is crucial for profitability, as a lack of it would mean investors have nothing to show for despite severe market upsides.

He shared a template for this exit strategy using a simplified model customized to highlight asset holdings, average entry price, and price targets. Furthermore, he mentioned potential selling levels using technical analysis of ADA’s price development compared to the previous cycle.

Cardano’s Current Market Dynamics

Gambardello stressed that ADA’s current long-term risk score stands at 39, which he categorized as a moderate buy area. He identified this indicator as suggesting that the coin still has more in the tank and the current position is a good place to buy into the asset.

Interestingly, he noted that Cardano had a similar score on June 6, 2020, when prices were at $0.086. The asset went on to rally 3,574% to its all-time high of $3.160, confirming the early entry point that current levels provide.

Meanwhile, he noted that if his price outlook proves true, Cardano would surge to between $5 and $10. In terms of potential catalysts for this run, the analyst cited the current bullish clouds around the cryptocurrency industry poised to attract trillions and the Cardano ecosystem’s plot to unlock Bitcoin DeFi.

Exit Strategy for ADA’s Rally

He then presented a program with which investors could navigate their investments. First, Gambardello established that he would use an asset holding of 100,000 ADA and an entry price of $0.5 for the experiment. This translates to an initial investment capital of $50,000.

Furthermore, he noted that for a risk-averse holder, the bull market door at $1.25 would be the first sell target. Notably, he would sell 10,000 ADA at the price with a total gain of $7,500.

Meanwhile, he discussed taking another profit between the bull door and Cardano’s all-time high, setting the second sell order at $2.5. At that point, he would sell another 10,000 ADA with a total profit of $27,000.

Further, his third sell order would come above the all-time high, specifically at $3.80. He would sell another 10,000 ADA, with a $60,000 profit. Interestingly, Gambardello stressed that the best time to make decisive profit-taking decisions is at the price discovery range; hence, he increased his sell strategy above $3.80.

For context, he noted he would place sell orders of 15,000 ADA at $5.20 and another 15,000 ADA at $6.25, realizing $217,250, with 40,000 ADA left. He further confirmed adding a price target of $8.5 and selling 10,000 ADA there.

Interestingly, the analyst plans to sell 70,000 ADA for a 100,000 ADA portfolio, with a potential total profit of $330,250 and a realized return on investment of 660.50%.

Cardano Clears Crucial Resistance

Notably, Cardano’s renewed momentum has seen it trend above a resistance boundary, impeding a rally to higher prices. Analyst Ali Martinez identified this resistance, which lies at around $0.74, in a recent X analysis.

The resistance lay within a descending channel on the 4-hour time frame, which has checked ADA’s price for two weeks. As Martinez highlighted in the commentary, the asset would target levels above $0.80 after the breakout.

In the meantime, Cardano trades at $0.785.

Market Psychologist Says Wait Until You See The Incoming XRP Pump

While XRP has posted a notable 6% gain in the past 24 hours, market analysts believe the real XRP pump could still be in the works.

XRP is trading at $2.30, a new weekly high after rebounding from just above $2 earlier. This ongoing turnaround comes as Bitcoin reclaims the $100K region after three months of trading below it.

As Bitcoin continues to break barriers, market watchers like Michael XBT expect the momentum to spill into XRP, potentially allowing it to outperform BTC, as has historically been seen.

Commenting on XRP’s performance in a tweet, Michael recalled a time when sentiment around XRP was massively bearish. Notably, this was in early April, when XRP slipped toward a key support level of around $1.60.

XRP Holds Firm, Avoids Breakdown

At the time, many analysts called for a deeper correction. However, Michael, a self-described market psychologist, shared a chart showing that XRP had held its support line.

Contrary to the bearish calls dominating social media, he suggested the asset was primed for a reversal and warned that those advising to sell at support would likely be proven wrong.

The chart he shared highlighted multiple bounces from a long-term descending trendline, an early sign of strength that many had missed.

Since that call, XRP has rallied to $2.35, gaining over 47% from its April lows. Michael has now returned to the conversation, signaling that this rebound is just the beginning. He indicated that an even stronger pump could be on the horizon, reinforcing his conviction from earlier in the month.

His confidence comes as XRP breaks out from its downward pressure and invalidates the pessimistic outlook many held just weeks ago.

Track Record of Contrarian Calls on XRP

Meanwhile, Michael also reflected on his previous predictions regarding XRP, which ultimately materialized. Specifically, back in July 2024, he had called for an impending historic breakout for XRP, saying that in his eight years of trading, he had never seen an asset with a seven-year bull pennant like XRP. At the time, XRP was trading at around $0.58.

Given the widespread pessimism around XRP, his prediction of an explosive surge faced significant resistance from other market commentators. Nevertheless, he stood by his call, and it took four additional months for the breakout to occur, specifically in November. From that point, XRP surged nearly 600%, from $0.49 to above $3.

Now, Michael compares the current sentiment around XRP to that of Bitcoin when it hovered around $ 76K. He prides himself that his most successful market calls have come during moments of doubt, when the crowd leaned the other way.

Over his eight years of trading experience, he says he’s developed a sense for market turning points that few others possess.

Meanwhile, other market commentators maintain bullish outlooks on XRP despite resistance from critics, including Egrag, Javon, and XForceGlobal. All of them have projected target prices ranging from $10 to as high as $100 for XRP in this cycle.

What If XRP Becomes No. 2 Crypto by Market Cap, Here’s Its Potential Price

If XRP becomes the second-largest crypto asset by market cap amid the current market environment, its price will have surged 111%.

The crypto market is currently witnessing a resurgence amid the Bitcoin (BTC) spike above $100,000 yesterday. XRP has followed suit, albeit at a slower pace, soaring over 7% in the past week to change hands at $2.37. This has pushed XRP’s market cap to $138.97 billion at press time, as it maintains the fourth spot among the largest crypto assets.

XRP Looking to Transcend Its Fourth Position 

At the current position, XRP is merely $10.79 billion away from surpassing stablecoin USDT’s $149.76 billion valuation to reclaim the third spot. Notably, with its circulating supply steadying at 58.55 billion tokens, should XRP soar by an additional 8% from the current level to $2.56, it would overtake Tether.

However, the XRP community is more interested in claiming the second spot, as they already expect the asset to reclaim this third spot soon. Since November 2024, XRP has eyed the second position, but despite its massive uptrend, rallying nearly 600% to $3.3 in January 2025, it has failed to reach this milestone.

This is largely due to Ethereum’s comparative increase within this period. While XRP has largely outperformed Ethereum with a 385% gain since November 2024, ETH has observed occasional upsurges that have ensured it maintains its spot as the second-largest crypto asset.

Now, with Ethereum’s impressive 33% spike over the past seven days, as it reclaims $2,400 for the first time since March, the altcoin king has massively increased the gap between its market cap and XRP’s valuation.

XRP Price if It Becomes #2 Crypto by Market Cap

Currently, XRP boasts a market cap of $138.97 billion, while Ethereum’s valuation sits at $291 billion. At this position, XRP would need to add a whopping $152 billion to its market cap before it can surpass Ethereum. However, the question remains: by how much must XRP price surge to achieve this feat?

Notably, at the current valuation of $138.97 billion, the XRP price sits at $2.37. For the asset’s valuation to increase by $152 billion to the $291 billion mark, its price must increase to $4.97 or $5, essentially a new all-time high. From the current price, XRP would need to rise by an additional 111% to claim the $5 mark.

Interestingly, multiple analysts have predicted XRP to claim the $5 price. Particularly, in February 2025, market commentator Dark Defender called attention to an ABC correction, suggesting XRP could target $5 to $8 once it is completed. Last December, Vincent Van Code also predicted a rise to $5 in February, but this failed to materialize.

XRP’s journey to $5 might take longer. However, it remains to be seen if Ethereum’s market cap will rise further, demanding a greater price for XRP to eventually surpass it. Notably, XRP was at some point the second-largest asset in the market, especially in 2017. However, it eventually slipped, with ETH gaining ground amid XRP’s seven-year underperformance.

Dogecoin Price Eyes $0.30 as 71% of Binance Traders Bet Long

Dogecoin price is climbing toward $0.20, with 71% of traders holding long positions. Will a breakout rally propel DOGE to $0.30?

With Bitcoin momentarily reaching the $104,000 mark, meme coins are turning extremely bullish. The meme coin segment has surged by 11%, reaching a total valuation of $62.20 billion.

Amid the growing bullish sentiment, Dogecoin has risen by nearly 10%, pushing its market cap to $29.26 billion. As DOGE approaches the key $0.20 breakout level, it appears poised for its next major move. Could this breakout rally drive Dogecoin’s price up by 85%?

Dogecoin Price Nears $0.20 Breakout

On the daily chart, Dogecoin has staged a strong recovery after establishing support around $0.14, making several bullish attempts to break through the $0.20 resistance zone. This ongoing struggle, paired with increasing bullish momentum, has led to the formation of an inverted head-and-shoulders pattern.

Dogecoin price chart

The pattern’s neckline aligns with the psychologically significant $0.20 mark. Moreover, a 15% jump on May 8 formed a large bullish candle on the chart, surpassing the 50-day exponential moving average (EMA) at $0.1795 and the 23.60% Fibonacci retracement level at $0.1869.

Currently, Dogecoin is testing both the neckline resistance and the 100-day EMA at $0.20. A breakout appears imminent. Supported by broader market recovery, a successful breakout could spark a major trend reversal and initiate a fresh bullish phase.

The 38.20% Fibonacci level sets an immediate price target at $0.2227. Optimistically, a breakout from the inverted head-and-shoulders pattern could propel DOGE to the 61.80% Fibonacci level at $0.2957, suggesting a potential 45% rally and a possible retest of the $0.30 mark.

On the downside, the 50-day EMA at $0.1795 remains a crucial support level.

71% of Binance Traders Anticipate DOGE Breakout Rally

As Dogecoin gains momentum, sentiment in the derivatives market remains highly bullish. Open interest has surged nearly 17% to $2.11 billion, while a funding rate of 0.0102% reflects aggressive bullish positioning.

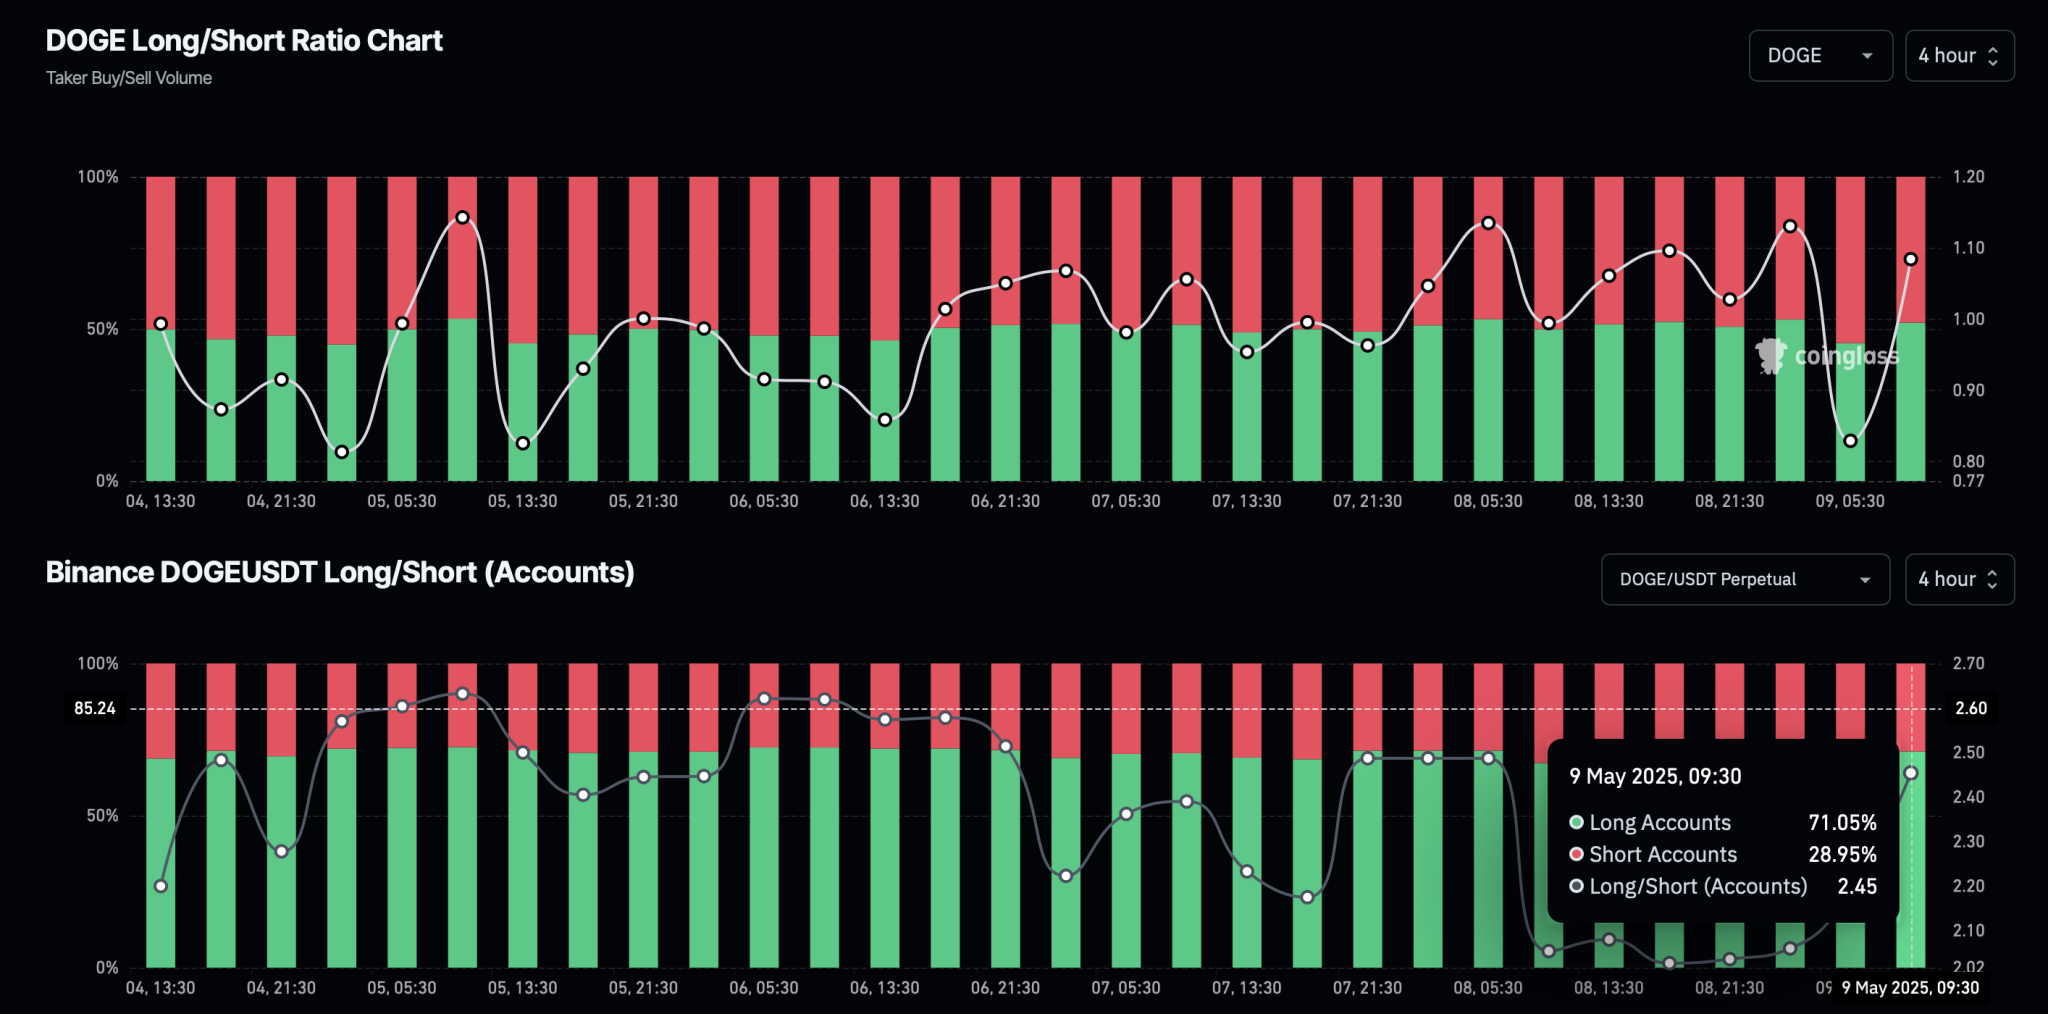
According to Coinglass, the long-to-short ratio has seen significant fluctuations over the past 12 hours. However, the bullish narrative currently dominates, with long positions comprising 52.02% of trades, bringing the long-to-short ratio to 1.0842. This indicates increased odds of a bullish continuation.

Dogecoin Long/Short Ratio Chart

On Binance, the bullish narrative peaks with long accounts rising to 71.05%. Hence, traders anticipate a breakout rally in Dogecoin for an extended rally.