Home Blog Page 801

Bitcoin Trading Surges 14% at Banking Institution Xapo Bank Despite Q1 Price Drop

Xapo Bank, a private banking institution in Gibraltar, has reported a 14.2% increase in Bitcoin trading volumes during Q1 2025.

The figure defied broader market sentiment after Bitcoin recorded its worst start to a year since 2018. Notably, the price of Bitcoin dropped 11.7% in the first quarter, yet Xapo’s high-net-worth clients leaned in, actively purchasing BTC amid the market downturn.

The bank noted in its report that clients viewed the dip as a strategic buying opportunity. Specifically, Xapo Bank’s head of investment, Gadi Chait, emphasized that institutional investors remain focused on Bitcoin’s long-term performance rather than short-term market swings despite global tension.

Alongside the trading volume boost, the financial institution also logged a 50% quarter increase in euro deposits. It attributed this to growing concern over fears of a U.S. recession. 

In March, Xapo became the first licensed bank in the UK to launch interest-bearing accounts for both Bitcoin and fiat, along with Bitcoin-backed loans of up to $1 million.

Stablecoin Activities on Xapo Bank

Furthermore, stablecoin activity on Xapo’s platform also shifted dramatically. USDC deposits rose 19.8%, while USDT deposits fell 13.4%. The drop likely reflects European exchange delistings of USDT in response to the EU’s Markets in Crypto-Assets (MiCA) regulatory framework.

Bitget Trading Volume Soars Past $2 Trillion

Meanwhile, crypto exchange Bitget also released its first quarter Transparency Report, showcasing a record-breaking $2.1 trillion in trading volume, a trend consistent with what was observed with Xapo Bank.

Notably, spot trading surged 159%, reaching $387 billion. Bitget’s customer base also exploded, adding nearly 20 million new users across its centralized exchange and wallet app. This brings its total global user count to over 120 million.

In a notable display of industry solidarity, Bitget also loaned 40,000 ETH (~$100M) to Bybit following the February security breach. The interest-free, collateral-free loan has since been fully repaid.

Meanwhile, in its Q1 2025 report, CoinMarketCap emphasized the significant market pullback of the first quarter of the year. It noted a growing disconnect between price and sentiment and a renewed focus on core blockchain technology.

The report attributes the overall market decline to Bitcoin’s underperformance, a drop in retail investor activity, and ongoing macroeconomic uncertainty.

Right now, Bitcoin is attempting to recover, posting an 8% gain over the past week as it reclaims the $86K region.

ZK Token Crashes 17% in 30 Minutes as Hacker Gains Control of $5M in Unclaimed ZKSync Airdrop Tokens

0

The ZK token has crashed 17% within a short timeframe amid a hack event that saw the exploiter gain control of millions in unclaimed ZKSync airdrop tokens.

The ZKSync ecosystem has again found itself in the midst of controversy, this time following a serious security breach that led to a sharp plunge in the price of its native token, ZK. 

ZKSync Suffers Exploit

On-chain activity on April 15 confirmed that an entity successfully minted 110 million ZK tokens earlier today. Of this staggering amount, the individual has already sold 66 million tokens, triggering massive volatility and panic across crypto exchanges.

Notably, the ZKSync security team quickly released a statement on X regarding the development. They acknowledged that an admin account suffered a compromise, granting the attacker access to nearly $5 million worth of unclaimed tokens from the project’s airdrop allocation. 

The team emphasized that the exploit only impacted the airdrop contract and did not affect the broader ZKSync protocol, the ZK token smart contract, or user wallets. According to them, security teams have already initiated emergency protocols, and a thorough investigation is underway to determine the full scope of the breach.

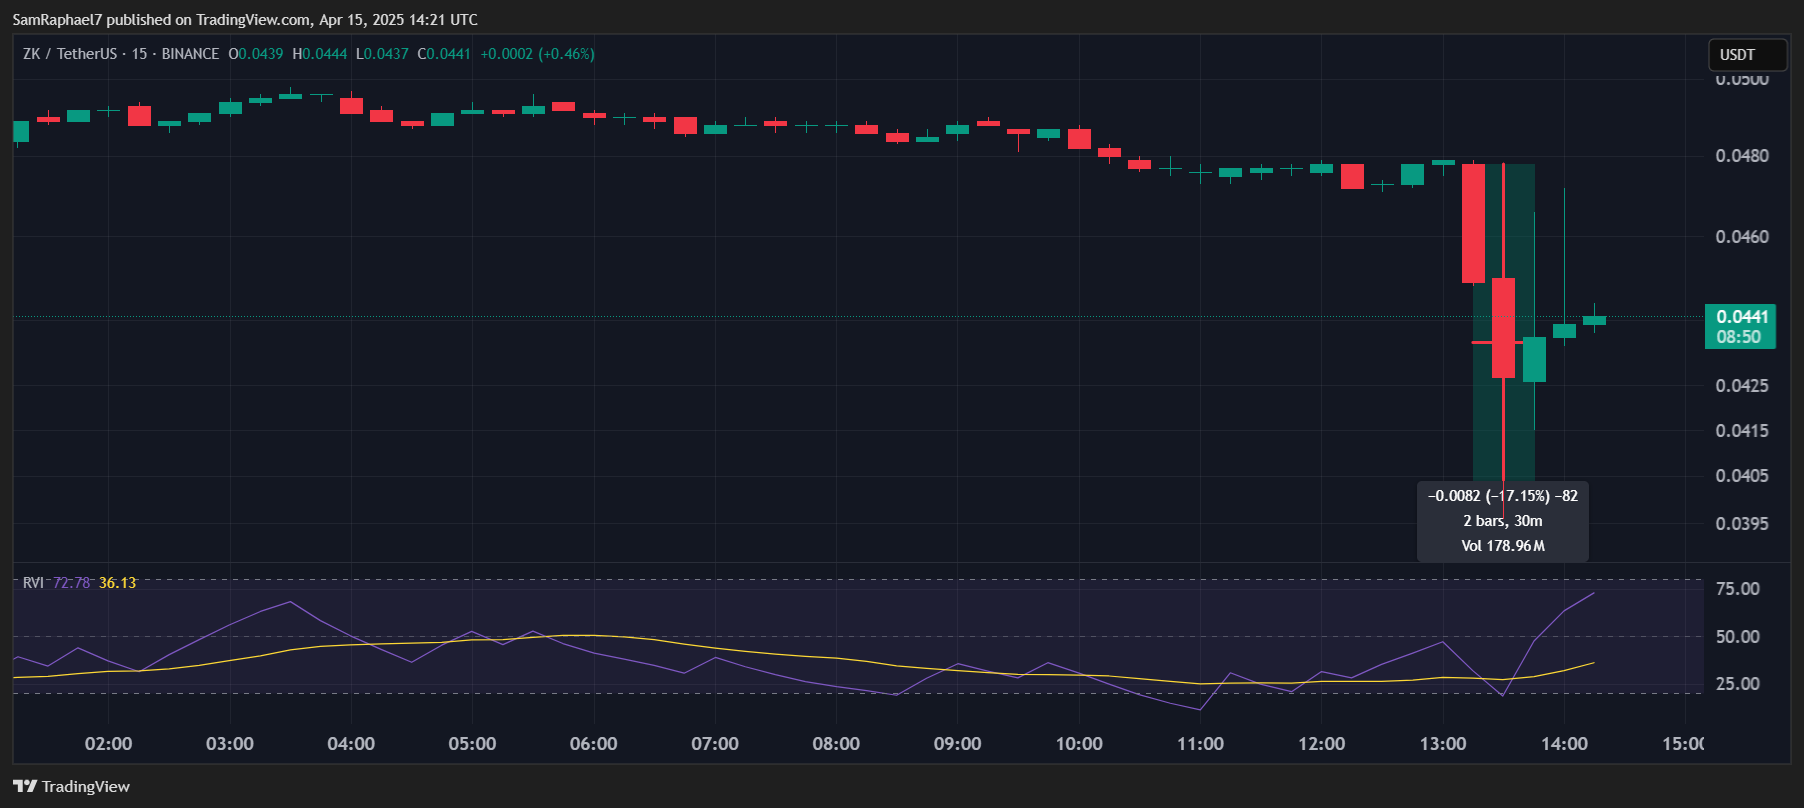
While the core infrastructure remains intact, the market reaction was immediate. Within a mere 30-minute window, ZK token’s price plummeted from $0.0478 to $0.0396 — a brutal 17% drop that rattled holders and traders alike. 

Although the asset made a partial recovery, rebounding to $0.0441, the market sentiment remains overwhelmingly bearish. In addition, the Relative Volatility Index (RVI), a metric for tracking price turbulence, surged from a low 18.68 to a hyperactive 72.81 within just an hour.

ZKSync Token Crash
ZKSync Token Crash

Community Reactions

The recent exploit has only amplified growing discontent among zkSync’s community members, many of whom have been vocal about their frustrations since the controversial airdrop. 

Pseudonymous commentator Hanky Pym criticized the team, likening zkSync’s path to that of Mantra’s OM token, which suffered a catastrophic 98% collapse. He claimed the team misused its substantial funding of around $400 million and slammed them for what he perceives as deceitful behavior. 

Another member of the community highlighted a perceived contradiction in zkSync’s narrative. The user questioned the legitimacy of the hack, suggesting it might be part of a larger trend where projects exploit the “we were hacked” narrative to cover questionable actions.

Meanwhile, Zener, founder of the Web3 infrastructure project Modularity, also weighed in, declaring that zkSync had effectively severed its bond with the community. He argued that the project’s credibility has collapsed.

ZKSync’s Earlier Controversies 

This incident compounds existing concerns surrounding ZKSync, which has been under scrutiny since its controversial airdrop rollout in June 2024. 

Designed to reward early adopters and ecosystem participants, the airdrop allocated 3.675 billion ZK tokens, 17.5% of the total 21 billion supply, to 695,232 wallet addresses. This selection represented only about 10% of all active wallets on the network.

Notably, the distribution process faced intense criticism. One of the major points was the uneven allocation of tokens. While eligible wallets received anywhere between 450 and 100,000 ZK tokens, more than half of the entire airdrop ended up in the hands of less than 1% of participants. 

The situation was further exacerbated by apparent vulnerabilities in Sybil attack prevention. Several users manipulated the eligibility system using multiple wallets, effectively gaming the airdrop. Notably, one individual reportedly secured over 3 million ZK tokens through 85 separate wallets.

Unknown Whale Deposits 29,532,534 XRP to Coinbase: Details

0

An unknown crypto whale has transferred over 29 million XRP coins to a blockchain address affiliated with U.S.-based exchange, Coinbase. 

According to data from Whale Alert, the user initiated the transaction today at 12:12 p.m. (UTC), transferring 29,532,534 (29.53 million) XRP from an unlabeled address to a Coinbase deposit address, ‘rUj…8Ln.’ 

The dollar equivalent of the transaction is $63.81 million, indicating that XRP was priced at around $2.16 at the time of the transfer. 

Sender’s Identity

Although Whale Alert claims that the sender’s identity is unknown, on-chain data suggests that the transaction was an internal transfer between two Coinbase wallets. 

Such transactions are common among exchanges. These trading platforms usually shuffle funds between their wallets to manage liquidity or enhance security.

It is worth mentioning that Coinbase activated the sending wallet, ‘rPe…AzU’, on April 11, 2025. Ever since, it has received XRP from multiple sources, including other Coinbase-affiliated addresses. 

After receiving over 29.53 million XRP in more than 40 transactions, the exchange moved the funds today to ‘rUj…8Ln,’ leaving a balance of 10 XRP ($21.6). 

Apparently, the recipient address caters to users’ withdrawal requests. Since receiving the 29.53 million XRP, it has disbursed nearly 28 million XRP to multiple wallet addresses in over 100 transactions. At press time, it had a balance of 1.55 million XRP, currently worth $3.34 million XRP. 

Meanwhile, the transaction comes as Coinbase prepares to launch XRP futures contracts on its platform. The exchange aims to list the contracts for trading next week by April 21, 2025. 

Ripple Sends 70M XRP to Unknown Wallet 

Prior to the Coinbase transaction, Whale Alert had highlighted another major XRP movement over the past day. The crypto tracking service reported that an unknown whale transferred 70 million XRP worth $150.36 million to another unidentified wallet on April 14 at 20:08 p.m. (UTC). 

Data from Bithomp shows that Ripple activated the sending wallet–’rP4…xv3’–in October 2023 with 70 million XRP. This wallet has been involved in several Ripple-related transactions. The latest of such transactions occurred on April 11, 2025, when it received 200 million XRP from the crypto payment giant. 

As previously reported, an XRP community figure, XRP_Liquidity, suggested that the funds could be utilized for several purposes, including providing liquidity on exchanges, meeting ODL clients’ demands, and backing XRP-related exchange-traded products (ETPs). 

Amid these transactions, XRP still sits comfortably above the $2 price mark, with the asset trading at $2.16 per coin. It is currently up 11.66% over the past seven days and 31.69% from its April 7 low of $1.6401.

Brandt Warns Trendline Breaks Don’t Signal Bitcoin Trend Reversal, Calling Trendlines ‘the Least Significant’

0

A prominent market analyst, Peter Brandt, has issued a cautionary warning to analysts suggesting a change in Bitcoin’s trend following a trendline breakout.

The expert sounded the alarm on an X post today, urging caution amid Bitcoin’s recent resurgence. He cited a trendline on the daily timeframe, which some traders he calls “amateur charters” have identified as a possible Bitcoin trend reversal.

Meanwhile, the analysis comes amid Bitcoin’s recent rejection from the $86,000 level. The pioneering cryptocurrency retested the level again today after a failed attempt to break above the price mark over the weekend.

Trendlines: The Least Significant Chart Construction?

Brandt shared a 1-day chart showing a possible Bitcoin breakout. Notably, a descending resistance trendline has contained the crypto asset since its January 20 all-time high of $109,300, with four attempts to defy the supply line failing flat.

Bitcoin’s Possible Breakout

However, Bitcoin finally seems to be breaking above the trendline, inducing “hopium” among market participants. The market veteran identified this quick bullish flip and advised caution.

According to Brandt, a trendline breakout is the least significant in chart construction, insinuating that indications other than a mere resistance line need to confirm the trend transition.

Meanwhile, Brandt insisted there was more to it when queried about a similar trendline breakout that saw Bitcoin rally from around $73,000 in November to its January peak price. The expert suggested that aside from the obvious bullish fundamentals following Donald Trump’s election win, the rally came from “a well-known, well-established” price pattern.

For context, Bitcoin broke from a seven-month flag pattern formed from its earlier yearly high of $73,808 in March until late October before the price explosion to six figures.

Possible Levels to Watch

Nonetheless, Brandt’s chart highlighted crucial levels to watch out for to confirm a trend shift. If Bitcoin continues its price growth, it must break above a resistance level at $88,839 for a sustained uptrend.

However, if momentum fails to hold and Bitcoin slides, the analysis highlights a crucial support line around $78,000 as its next muster point. Notably, the crypto leader has found solace around the area multiple times in the last three months.

In the meantime, Bitcoin has faced severe rejection from $86,000, dumping to $85,145 at the time of writing.

Analyst Identifies Two Scenarios For Dogecoin Price to Reach $0.70

0

An analyst has presented various scenarios through which Dogecoin could soar back to its all-time high based on a rising channel.

Over the past 24 hours, Dogecoin has attempted a recovery above the $0.161 level several times but has faced significant resistance. During this press, Dogecoin is trading at $0.1594, down 3.5% over the past day.

DOGE has also plummeted by over 7% in the past 14 days. Amid this dip, analysts are offering insights into potential future movements for Dogecoin, noting key levels and trends to watch.

Two Scenarios for Dogecoin to Rebound to $0.7

One notable analysis comes from “FuaCompany,” a TradingView account presenting a monthly DOGE chart against USDT. This chart shows DOGE moving within a rising channel, identified by two parallel lines. 

This pattern indicates that the price has been bouncing between these boundaries, reflecting higher highs and higher lows. FuaCompany highlighted two potential scenarios for Dogecoin’s future price action based on this pattern.

In the first bullish scenario, Dogecoin may continue to respect the rising channel. If the price hits the lower boundary of the channel, it could bounce back, leading to further upward movement.

The chart shows a previous instance when DOGE bounced at the lower boundary around $0.05, then surged toward the upper boundary.

Alternatively, a bearish correction before rebound is also possible. In this scenario, the price could drop sharply to the lower part of the channel, potentially falling below it to around $0.08 before recovering.

Meanwhile, despite these short-term fluctuations, both scenarios point toward a potential long-term target of $0.70. Notably, the price target would DOGE within arm’s length of reclaiming its 2021 all-time high of $0.73.

Dogecoin Price Prediction | TradingView

Bullish Breakout Setup by Another Analyst

Meanwhile, another analyst, Jack, shared a bullish breakout setup for Dogecoin in his commentary on TradingView. According to Jack’s analysis, Dogecoin has recently broken out of a descending channel following a strong consolidation phase.

Dogecoin Support and Resistance | TradingView

Jack’s trade idea suggests entering the DOGE market at $0.16650 with three key price targets: $0.20575 and $0.23916, while the furthest target is at $0.27872.

The stop-loss is below $0.15160, while key support levels include $0.16659 and $0.15160. Another support zone can be seen around $0.13833. The setup implies a solid swing opportunity if the price maintains bullish momentum above $0.16650.

Strong Bullish Sentiment Amid Dip

Further analysis by Ali Martinez sheds light on a surge in whale activity surrounding Dogecoin, a bullish signal. Martinez reported that over 800 million DOGE were purchased in a 48-hour period. 

This surge in whale buying could signal increased confidence in Dogecoin’s future potential. Whales tend to have significant influence on price movement due to their large transactions.

Martinez also observed that whale activity increased as Dogecoin’s price dropped to around $0.15. This surge in accumulation suggests that whales were buying the dip, potentially preparing for a price increase as the market stabilizes.

Here Are Most Extreme XRP Price Glitches Ever Recorded—From $0.0001 to $161M

0

Numerous instances of XRP price glitch events have added to the intrigue surrounding XRP, making it a frequent topic of discussion among market participants.

Over the years, XRP has experienced multiple price anomalies. Each glitch has ranged from unusually low to absurdly high. However, data shows that most of them have been the result of technical malfunctions or illiquid markets. 

Notably, these glitches did not reflect actual market sentiment or trades at the time but showed how vulnerable crypto platforms can be to data feed errors or low liquidity issues. Here’s a chronological breakdown of XRP’s most striking price glitches.

XRP Price Glitch Events from 2019 to 2023

The earliest widely reported XRP price glitch occurred on Jan. 4, 2019, when Coinbase’s 1-minute chart bizarrely showed XRP priced at $7,308. This spike, out of sync with market reality, came from a technical error, possibly due to a data crossover with Bitcoin, which traded at a similar figure around that period.

Notably, another noticeable glitch happened on TradingView. The platform erroneously displayed XRP trading at $9,864, despite its actual market price hovering between $0.20 and $0.22. The issue remained isolated to TradingView’s interface and didn’t reflect real-time exchange pricing.

In December 2021, a dramatic system error on CoinMarketCap and Coinbase falsely displayed XRP’s value at a staggering $161 million. The anomaly wasn’t limited to XRP, as many other assets showed similarly inflated values. Both platforms responded swiftly, correcting the data feed malfunction.

By October 2023, CoinMarketCap was again at the center of another XRP price glitch. This time, the platform listed XRP at $34,603, even though the actual market price was around $0.5655. 

March 2024 saw another bizarre event, this time on the Atlantis Exchange. XRP spiked to $70 on this lesser-known platform. The cause appeared to be limited liquidity, which often leads to dramatic and unrealistic price movements on low-volume exchanges.

Meanwhile, one of the most publicized XRP price glitch events occurred on Aug. 10, 2023, when Gemini listed XRP for the first time. Moments after, XRP’s price surged to $50, far above the market rate. The sudden spike likely resulted from a thin order book combined with high user demand during relisting.

Further Anomalies Between 2024 and 2025

Further, in April 2023, Bitrue’s derivatives platform experienced a sharp XRP price crash to $0.0001. The drop triggered widespread long position liquidations before prices rebounded. Though brief, the glitch led to massive losses for leveraged traders.

Meanwhile, in July 2024, MEXC saw XRP’s spot price climb 228% within a single minute, momentarily hitting $2 while the broader market still priced it at around $0.60. The price returned to normal within four minutes. They confirmed the event as a temporary glitch in a specific trading pair.

On Aug. 18, 2024, Coinbase briefly showed XRP price at $22.50. However, the actual value remained steady between $0.56 and $0.57. Further, in October 2024, Binance registered another anomaly. Participant, a trader’s video captured XRP spiking to $5,791, then briefly correcting to $579 before surging back to the initial erroneous figure.

Now, the most recent XRP price glitch occurred last month, but not on traditional exchange or price data platforms. This latest anomaly occurred on live American TV, reaching a broader audience, as XRP price spiked to $21,000 on the Real America’s voice, a U.S. news channel.

Here’s a Guide on How XRP Holders Can Earn Passive Income Through XRPL AMMs

0

XRP holders have an opportunity to earn passive income by providing liquidity on XRPL AMMs, but it is important to weigh the risks.

Following the introduction of AMM functionality on the XRP Ledger (XRPL) last March, the growth of Automated Market Makers (AMMs) in the ecosystem has triggered interest among XRP holders seeking ways to earn passive income. 

To provide a guide for willing traders, the analyst behind the “All Things XRP” community-driven account, recently shared an explanation on how to take advantage of this trend. The analyst outlined a step-by-step guide to becoming a liquidity provider on XRPL-based AMMs, providing a practical entry point for everyday holders.

Steps to Add Liquidity on AMMs

For the first step, the analyst noted the importance of setting up a compatible wallet, with Xaman (formerly Xumm) being his top recommendation due to its seamless integration with AMM platforms. 

He explained that it’s important to ensure the wallet is updated to version 2.8 or higher and funded with XRP. For those interested in dealing with non-XRP tokens, he advised adding the necessary trust lines.

Once the wallet is ready, the second step involves using an interface such as Magnetic, a user-friendly platform for interacting with XRPL’s AMMs. However, he urged users to stick with trusted links to avoid scam sites. Essentially, users can link Xaman with Magnetic to securely connect to the AMM interface and begin exploring available liquidity pools.

For the next step, the analyst explained that investors should review the current AMM pools, such as XRP paired with tokens like USDC, TST, or XPM, and choose ones with healthy trading activity and volume. He added that while they could create new pools, newcomers should begin with established options.

Meanwhile, according to the guide, users can contribute liquidity in two ways. They can either deposit both assets in a pair, which avoids extra fees, or contribute only one, which comes with a fee. 

He advised starting with the double-asset method. Notably, this typically has better efficiency and eliminates slippage. After selecting the pool and entering the deposit amount, ideally matching the existing asset ratio, the investor can then confirm the transaction through the wallet and receive LP tokens that represent their share of the pool.

These LP tokens track both the user’s liquidity share and the trading fees it generates. Traders can monitor their position using tools like XRPScan, an XRPL block explorer, withdraw liquidity whenever they choose, and view how much income they’ve earned over time. 

XRPL AMMs See Massive Boost

Remarkably, this guide arrives at a time when XRPL’s AMM ecosystem is growing at a fast pace. When the AMM functionality officially went live in March 2024, the network began seeing a steady climb in participation. 

Just weeks later, more than 315 AMM pools were active, with over 2.2 million XRP locked in liquidity. That momentum surged further by June 2024, as the locked XRP exceeded 10 million across nearly 600 pools. By early 2025, the ecosystem had ballooned to over 18,000 pools holding more than 13 million XRP, worth about $30 million.

However, there are risks worth considering alongside the potential for passive income. One of the most discussed is impermanent loss, which happens when the value of tokens within a pool changes considerably from when they were first deposited. This can lead to lower returns than simply holding the assets independently. 

Ripple CTO David Schwartz highlighted this risk last year. In addition, crypto markets are largely volatile, and sharp price swings may affect the value of liquidity positions. It is important to consider these risks before choosing to become a liquidity provider for an AMM pool.

Analyst Identifies Historical Dogecoin Symmetrical Triangle Breakouts, Targets the $2.9 Level

0

Analyst highlights historical patterns set out by Dogecoin and the meme coin’s recent breakout, predicting potential for a rally.

Dogecoin (DOGE) has been on a steady upward trajectory over the past week, demonstrating a 5.2% gain as it rose from $0.13 on April 9 to around $0.15. The token is now testing a crucial resistance level at $0.16, which has capped its price recently. 

Despite the overall upward movement, Dogecoin has experienced moderate volatility, including minor retracements on April 12 and 13. Currently, the price has seen a slight 2.08% decline over the past 24 hours.

Dogecoin’s Historical Patterns 

Amid these movements, analyst Trader Tardigrade has examined Dogecoin’s price action using a 3-day chart that spans from 2014 to the present, which highlights key technical patterns. The chart displays a series of symmetrical triangle formations that have historically preceded significant breakouts.

Dogecoin Price Prediction

The first triangle formed between 2014 and 2016, during which Dogecoin saw a downward price trend before breaking out to $0.004 and then consolidating underneath a descending trendline. This led to another breakout and subsequent surge in mid-2017. It sustained this run until January 2018, eventually hitting a new all-time high of $0.0187.

Similarly, the second symmetrical triangle, which developed between 2018 and 2021, followed a comparable pattern with a breakout that eventually resulted in a sharp price rally, peaking at the latest all-time high of $0.74. 

After Dogecoin collapsed from this peak as the 2021 bull run cooled, it formed a third symmetrical triangle. However, it finally broke out of this third triangle in late 2024 and sustained the breakout until recently, with the recent drop allowing it to retest the descending trendline.

According to Tardigrade, the latest breakout signals a potential for another upward move, with an anticipated price target of $2.9. With Dogecoin currently trading to $0.1593, a run to $2.9 would demand a 1,593% rally. Interestingly, last November, analyst Scofield already predicted a DOGE surge to $3.

Ali Martinez’s Separate Insights

Ali Martinez has also weighed in on Dogecoin’s price movement, offering insights into the coin’s recent price fluctuations. Martinez points out that Dogecoin retraced from its yearly high of $0.485 before stabilizing at the $0.145 level, which aligns with a rising trendline that began in November 2023. 

The price has previously tested the trendline level twice, failing to break below it. Martinez suggests that as long as Dogecoin holds above the $0.13 support, it may be poised for a significant move upward. A close above $0.17 could potentially open the door to higher price levels, including $0.21 or even $0.29.

Bullish Sentiment Supported by Address Activity

Meanwhile, data on Dogecoin’s address activity further supports the optimistic outlook for the coin. The number of new addresses has surged by 102.4% in the past week, signaling a strong influx of new participants into the ecosystem. 

Dogecoin Daily Active Addresses

This is mirrored by a 111.32% increase in active addresses, indicating growing engagement with the token. Additionally, the number of zero-balance addresses has risen by 155.51%, suggesting the creation of new wallets or changes in holdings within the Dogecoin network.

Binance Distributed 94% of All Launchpool Airdrop and Rewards, Totaling $2.64 billion in 2024

0

Prominent cryptocurrency exchange Binance distributed 94% of all the centralized exchange launchpool airdrops and rewards in 2024.

Binance is the largest cryptocurrency exchange in terms of spot trading volume. Controlling about 50% of the global trading volume, the Changpeng Zhao-co-founded exchange has established itself as a leader in the centralized exchange business.

Interestingly, Binance’s lead goes beyond the market attention it commands; the exchange has also positioned itself around projects looking to give back to the crypto community. A recent CoinMarketCap report shows that the trading platform handled a staggering 94% of all launchpool rewards in the past year.

Binance’s User Reward Exceeds $2.64B

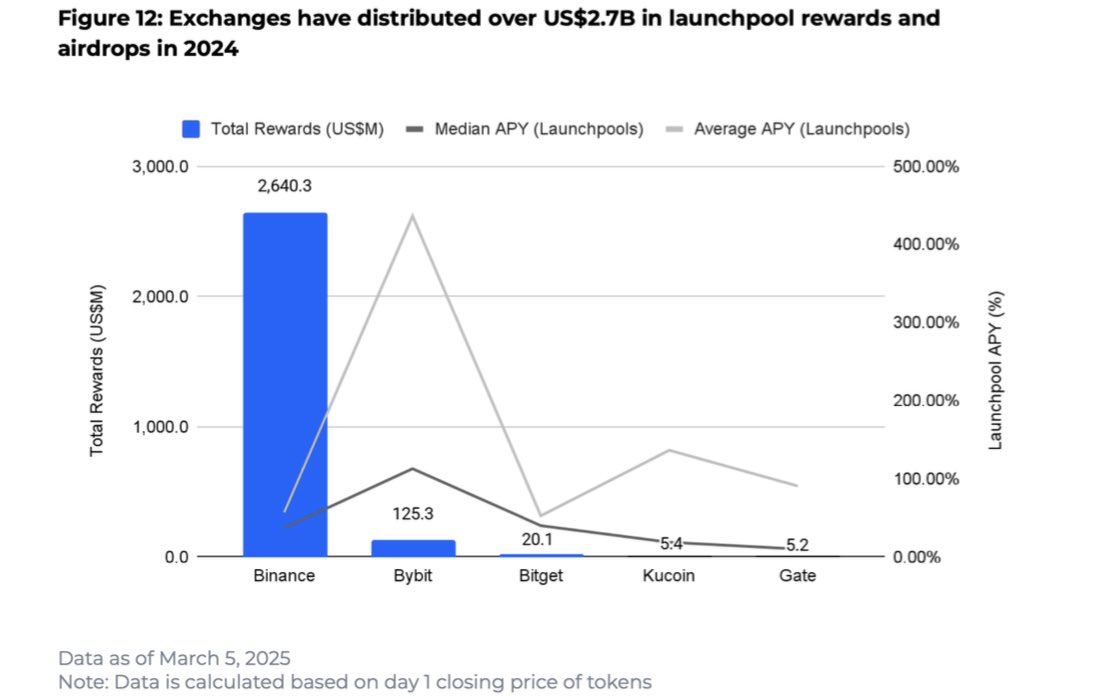
The report “Examining Token Listings on CEXes” highlighted several activities among top centralized exchanges, including their token listing and reward performances. Among others, the piece shows that Binance is way ahead in rewarding platform users through airdrops and launchpools.

For context, launchpools are programs organized by centralized exchanges to offer holders alternative income. CEXs allow holders of certain assets to stake them, offering them early access to new tokens while earning rewards on staked assets.

Meanwhile, Binance goes beyond the launchpool program by offering MegaDrops and launchpads, which help new and promising projects access early investments through initial exchange offerings (IEO). Per reports, users of the leading crypto exchange received $2.64 billion in rewards from these programs in 2024.

Interestingly, the figure accounts for almost all the rewards users gained across all other exchanges. For context, an accompanying chart shows that Bybit, which has the second-largest airdrop, managed a meager $125 million (4.62%) compared to Binance’s. Other mentioned exchanges like Bitget, KuCoin, and Gate.io gave back $20.1 million, $5.4 million, and $5.2 million, respectively.

Launchpool Rewards per Exchange

Launchpool Participants Cash Out Big

Moreover, participants in launchpools across major exchanges recorded staggering returns, increasing the program’s appeal. CoinMarketCap highlighted that users’ median average percentage yield (APY) ranged between 11% and 112%.

Furthermore, the normal APY looks even better, ranging between 52% and 436%. Notably, the exact percentage depends on the asset the user staked on and the terms of the launchpool.

Notably, major assets stood out as the top Binance launchpools for 2024. For context, Saga (SAGA)’s April 5-9 launchpool stood out, attracting over ten million staked BNB. The project distributed rewards worth 45 million SAGA, sealing its place among the most lucrative launchpools of last year.

Other prominent pools include Etherna (ETHERNA), where users earned a cumulative 240 million ETHERNA from March 31 to April 1 farming; PIXEL, which gave out over 280 million of the token in its February 9-18 farming, with users earning an average of $9.47 per BNB; and others like the March 28-31 Gunzilla Game (GUN) pool.

In general, last year was good for crypto listings on CEXes through several launch protocols, as they did not perform poorly. The data shows an average return on investment of 167.48%, with Gate.io, Binance, Bitget, and Bybit listing the average best performers in 2024.

Average ROI for Tokens Listed on Exchanges

Solana Eyes $150 Breakout: Can ETF Hype Drive SOL to $200?

Solana is gaining momentum following a breakout from an inverted head and shoulders pattern.

As Canada prepares to launch the first spot SOL ETFs, bulls are targeting the $150 and $200 levels.

Currently trading at $132, Solana has posted over 20% growth in the past seven days. Following a brief dip below $100, the recovery rally confirmed a bullish breakout pattern. Could growing support for Solana push prices to $200?

Solana Price Analysis

On the 4-hour chart, SOL shows a bullish reversal from $97, coinciding with a market recovery after a 90-day pause in the tariff war. Solana’s breakout past the $122 supply zone confirmed the inverted head and shoulders pattern.

Solana Price Chart
Solana Price Chart

At present, Solana’s price action has shifted sideways, finding support along the 200 EMA on the 4-hour timeframe. A sudden surge in buying momentum has also triggered a bullish crossover between the 50 and 100 EMA lines.

However, as Solana consolidates above the $130 mark, waning momentum is flashing warning signs of a potential bearish reversal. This is highlighted by a negative crossover in the MACD and signal lines.

Despite this, the recent rebound, marked by three consecutive bullish candles, indicates a possible rally continuation.

Short-Term Bearish Sentiment Suggests Increasing Bullish Struggles

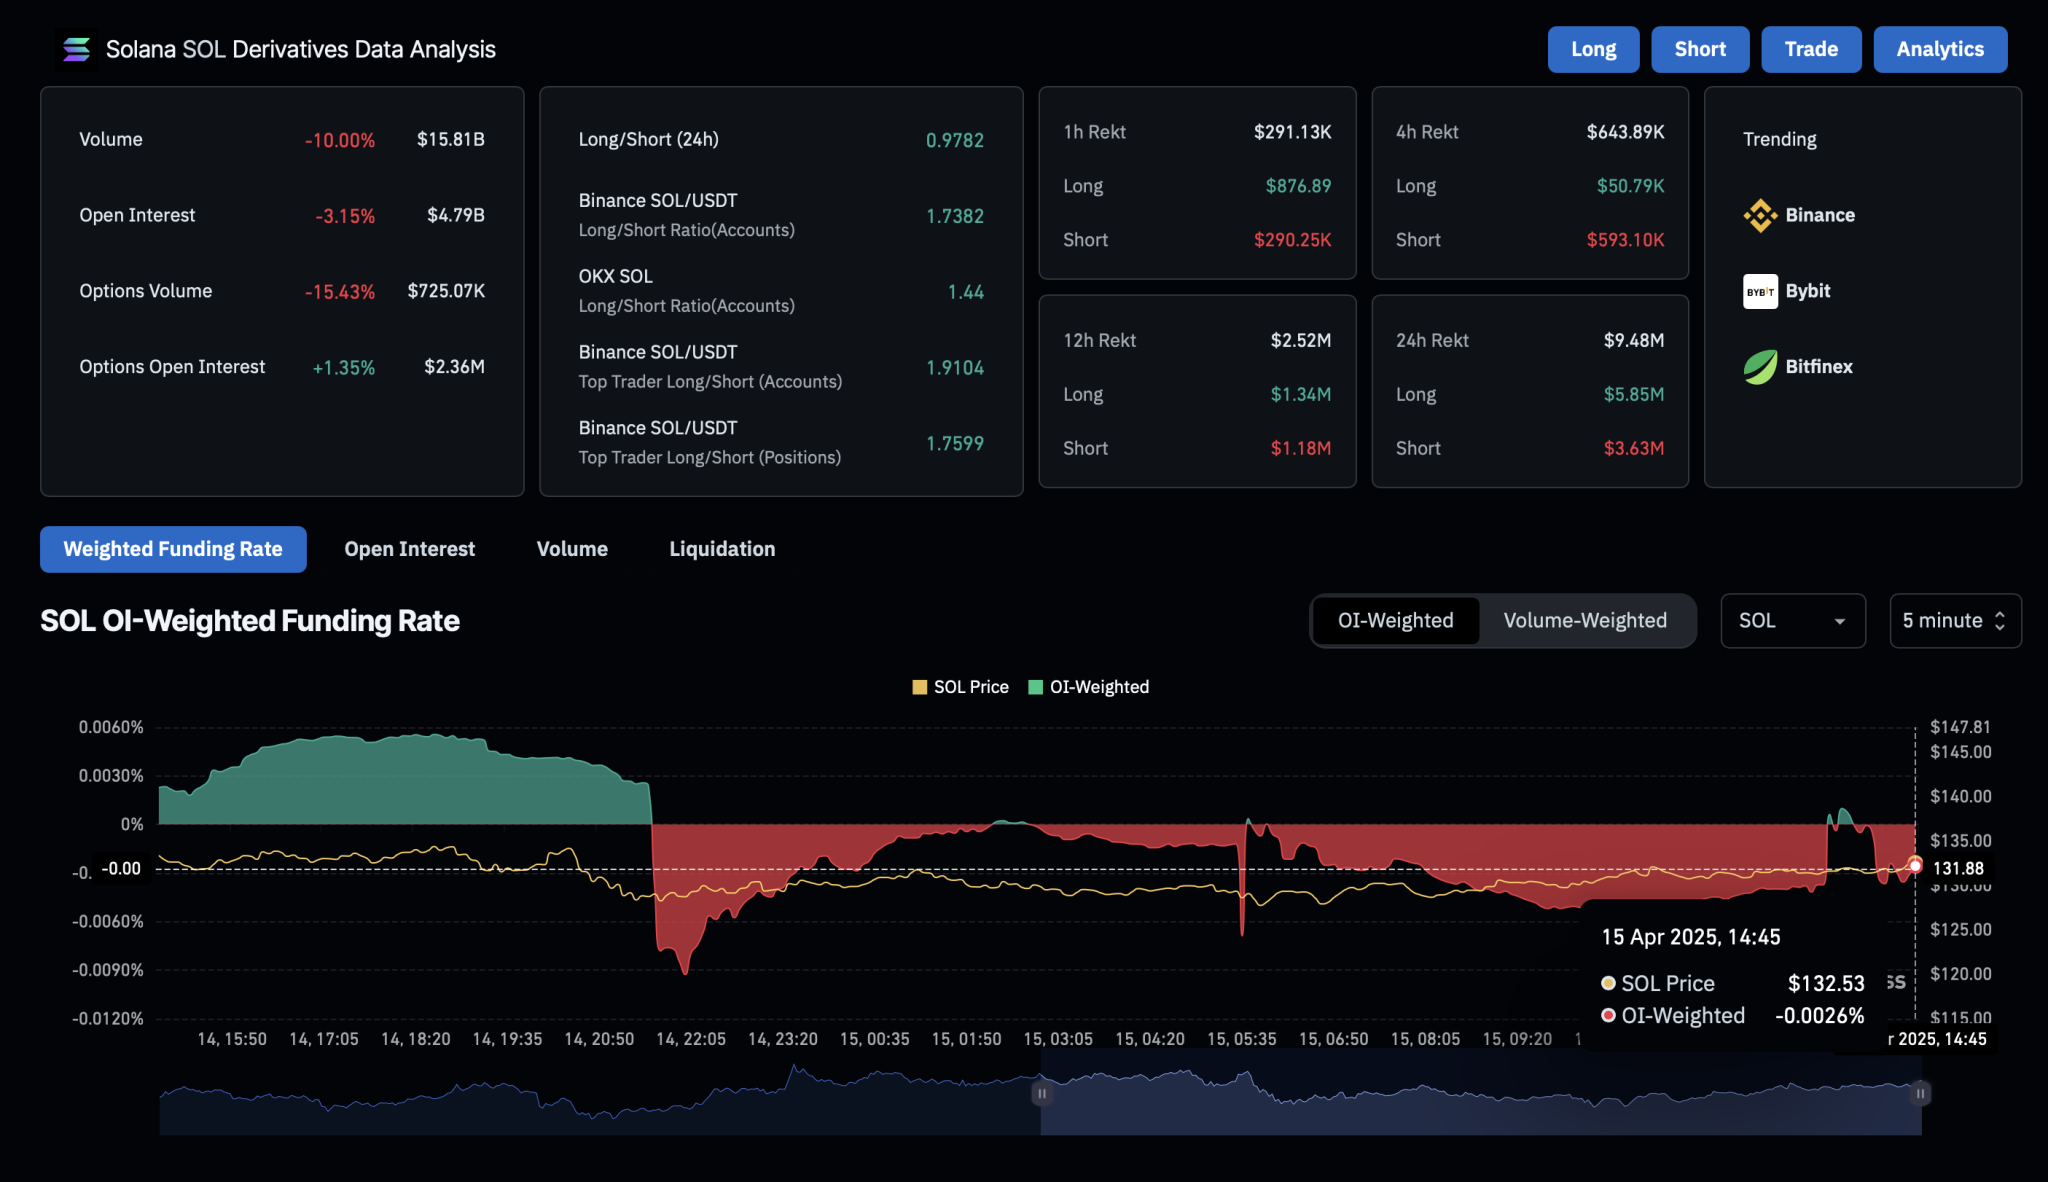
Declining Solana open interest suggests weakening trader engagement amid broader market uncertainty. According to Coinglass, open interest currently stands at $4.79 billion, reflecting a 3.15% drop in the past 24 hours.

Solana Derivatives Data Analysis

Additionally, the funding rate remains at -0.0026%, indicating rising bearish sentiment. The long/short ratio has slipped slightly to 0.97 over the last 24 hours, indicating a modest increase in short positions.

Solana Spot ETFs Launching in Canada

Amid Solana’s short-term recovery, the upcoming launch of spot Solana ETFs in Canada reinforces bullish expectations. In a recent tweet, Bloomberg ETF analyst Eric Balchunas confirmed that Solana ETFs are set to become a reality this week.

The Ontario Securities Commission (OSC) has approved multiple issuers—including Purpose, Evolve, CI, and 3iQ—to launch Solana ETFs. The world’s first spot Solana ETFs will debut tomorrow, April 16, 2025.

Will SOL Price Reach $200?

As the breakout rally builds momentum above the 200 EMA, the anticipated ETF launch could further fuel bullish sentiment. Based on Fibonacci levels, the ongoing uptrend will likely challenge the $150 supply zone near the 50% retracement level.

A successful breakout above $150 could shift the focus to the $200 price target. Conversely, the key support to watch is at $116.