Home Blog Page 802

Pundit Explains Why XRP May NOT Go Parabolic After This Big Upcoming Event

Crypto commentator Austin Hilton recently shared a cautionary take on the XRP outlook that challenges a common belief.

Notably, his commentary focused on the widespread expectation that XRP’s price will surge following a resolution of the SEC vs. Ripple lawsuit. In a video, Hilton explained why this long-anticipated development might not trigger the explosive rally many XRP holders hope for.

According to Hilton, the Ripple vs. SEC lawsuit has been “essentially” settled behind closed doors. The parties are considering a reduced fine of $50 million, down from the initial $125 million, and have paused the appeals process.

However, a final public statement from the SEC announcing these agreements is still pending. Despite that, Hilton argues that the crypto market has already priced in the outcome.

“Everybody who’s active in XRP [community] knows the lawsuit is done,” he says. “It’s not like it’s some secret. That’s why we may not see a massive jump.”

Hilton, an XRP holder himself, clarifies that he wants XRP to rise in value, but he stresses the significance of managing expectations.

Market Sentiment Is Low

Furthermore, Hilton points out that broader market conditions may also hinder a price surge. The crypto space has been bearish since late January, with major news events failing to move the market.

He attributes this to ongoing global tension, ranging from geopolitical pressures to economic concerns like tariffs and inflation.

“Retail liquidity has largely left the market,” he notes, adding that fear and uncertainty still dominate sentiment across financial sectors.

This suggests that even the final announcement of the Ripple lawsuit’s conclusion may not be enough to trigger a significant price run for XRP, as the broader market is still trying to recover from earlier sharp declines.

Still a Win for Ripple

While the lawsuit’s resolution might not send XRP skyrocketing in the short term, Hilton believes it’s still a significant long-term win. He believes regulatory clarity will finally open the door for Ripple to secure major partnerships with financial institutions such as Bank of America, JPMorgan, and Citi.

“This gives Ripple a green light to scale operations, especially in the U.S. financial sector,” he said.

Already, the company is showing signs of expansion. Just last week, it announced the acquisition of a brokerage firm, Hidden Road, which processes $3 trillion annually. The announcement coincides with the SEC’s official decision to pause the appeal proceedings in the lawsuit.

Ripple’s Chief Technology Officer, David Schwartz, noted that a portion of this massive transaction volume could flow through the XRP Ledger to improve efficiency—something the acquired firm previously lacked.

Ultimately, Hilton stressed that XRP may not see an immediate parabolic run following the lawsuit’s conclusion. Yet, that doesn’t mean it lacks potential. In his view, the legal win sets the foundation for future adoption and long-term value growth. For XRP holders, patience remains the most valuable asset.
Mike Novogratz’s Galaxy Digital Offloads 25,000 ETH Worth $40M to Binance in 3 Days: What’s Going On?

0

Michael Novogratz’s crypto investment firm, Galaxy Digital, has offloaded another 12,500 Ethereum to the Binance exchange, continuing a trend of large-scale transfers.

This latest movement follows a similar deposit of 12,500 ETH on April 12. Collectively, the firm has sent Binance 25,000 ETH worth over $40 million in the last three days.

Ethereum Deposits and Market Impact

Notably, the latest transfer saw Galaxy Digital move Ethereum tokens in separate transactions. These include 2,500 ETH, valued at $4.05 million, and 10,000 ETH, valued at $16.32 million.

The April 12 movements included 4,500 ETH, valued at $7.11 million, and 8,000 ETH, valued at $12.63 million, moved to Binance.

Image
Image from Lookonchain on X

Meanwhile, the price of Ethereum declined during the recent deposit, dropping from $1,677 on April 14 to $1,641 during this press.

This decrease highlights how institutional movements could impact market prices. Market watchers have pointed out that these sizable transfers might influence trading strategies and market dynamics.

Other Notable Transfers and Holdings

After Ethereum, Galaxy Digital also made notable stablecoin transactions, transferring 5 million USDT to Binance. Furthermore, the firm moved 100,000 USDC and $1,000 worth of Avalanche (AVAX). 

According to data from intelligence platform Arkham, the firm’s current holdings after the transfers include 199.795 ETH worth $328,470 and 18,150 AVAX tokens worth $363,180.

Additionally, Galaxy Digital holds 4.208 million DAI and 3.757 million USDC, collectively valued at approximately $7.97 million.

Legal Troubles for Galaxy Digital 

Notably, Galaxy Digital’s ongoing movement of crypto assets follows the recent legal settlement in the LUNA market manipulation case.

Notably, the firm agreed to pay a $200 million settlement after the New York Attorney General accused it of offloading LUNA holdings without proper disclosure. 

Galaxy Digital had promoted LUNA in 2020, securing a deal to buy the token at a discounted price. Prosecutors allege that as Galaxy Digital promoted LUNA, the token’s price began to surge.

With the rise in value, the firm reportedly offloaded its holdings, reaping hundreds of millions in profits. However, these transactions were allegedly carried out without proper disclosure.

Here’s What 100M, 500M, and 1B Shiba Inu Could Be Worth at a Realistic Target of $0.0001

0

Shiba Inu investors holding 100 million, 500 million, and 1 billion tokens could achieve massive returns if the price of SHIB rises to $0.0001.  

Shiba Inu is still recovering from last week’s downturn, which pushed it below the $0.000011 price mark. At press time, SHIB traded at $0.00001198, marking an increase of 6.39% over the past week. However, it is currently down 86.45% from its all-time high of $0.00008845. 

While this hefty decline has sparked concerns among some investors, others consider it an opportunity to grow their SHIB portfolios in anticipation of a price surge toward “realistic” targets like $0.0001. 

As this forecast gains momentum, TheCryptoBasic estimates the worth of portfolios holding 100 million, 500 million, and 1 billion Shiba Inu tokens if SHIB hits the $0.0001 psychological target. 

Potential Worth of 100M, 500M, and 1B SHIB at $0.0001 

At the current price of $0.00001198, investors can procure 100 million, 500 million, and 1 billion SHIB tokens for $1,198, $5,990, and $11,980, respectively. The value of these SHIB holdings would soar tremendously if SHIB successfully clinches the $0.0001 target. 

In particular, a portfolio containing 100 million SHIB will skyrocket to $10,000 if the price reaches $0.0001 per token, while holdings of 500 million and 1 billion SHIB tokens would be valued at $50,000 and $100,000, respectively. 

Shiba Inu to $0.0001 Predictions 

Meanwhile, the $0.0001 forecast has gained popularity within the Shiba Inu community, with several analysts setting timelines for SHIB’s potential surge to the target. 

As reported earlier, Forbes highlighted a prediction from top industry expert Himanshu Maradiya, who forecasted that SHIB would clinch the $0.0001 target in the 2024/2025 market cycle. 

Specifically, renowned market expert Alan Santana projected that the $0.0001 target would materialize in the second half of this year. Similarly, popular market commentator Eunice Wong sees SHIB clinching the $0.0001 target this year. 

However, experts at Changelly suggested that it could take longer before SHIB reaches the $0.0001 milestone. According to them, Shiba Inu would surge to the $0.0001 mark in the next four years, particularly by May 2029. They expect SHIB to reach a maximum target of $0.000102 during that period. 

Is $0.0001 Realistic? 

Clinching the $0.0001 target requires Shiba Inu to soar 734.72% from the current price. Despite the challenging growth rate, many experts still believe the target is realistic, emphasizing that it could materialize as early as this year. 

However, some critics have a different view. They believe SHIB’s enormous supply could hinder its chances of reaching $0.0001. 

Recall that SHIB had previously surged close to the $0.0001 target four years ago when its supply was more significant than it is today. At the time, the canine-themed token soared to an all-time high of $0.00008845, pushing its market cap to around $40 billion. 

If the SHIB circulating supply remains stable at 589.25 trillion tokens, each worth $0.0001, Shiba Inu’s market cap would skyrocket to $58.92 billion. Proponents see the projected valuation as feasible under favorable market conditions and positive developments in the Shiba Inu ecosystem, including increased burns and adoption. 

However, skepticism about loftier price targets like $0.001 or $0.01 if Shiba Inu’s supply remains unchanged.

For context, if Shiba Inu’s supply remains stable at 589.25 trillion tokens, a surge to the $0.001 target would push the market cap to $589.25 billion. The $0.01 target would take SHIB’s valuation to $5.89 trillion, something many call unrealistic. 

Analyst Says XRP Showing Bullish Signs, But Is Momentum Sustainable?

A prominent analyst observes the recent XRP surge and highlights bullish signs but questions whether the momentum will be sustainable in the coming days.

XRP has gained momentum over the past week, surging by 22% and surpassing the $2 mark for the first time in several months. As of today, the crypto asset is trading at $2.14, reflecting a modest 0.52% increase in the last 24 hours. 

While the uptick has caught the attention of many, an analyst is questioning whether XRP can maintain this upward trajectory. Notably, several important indicators suggest bullish and cautious signals.

Cooling RSI and Bullish Indicators

Core DeFi Researcher on X observed that XRP’s Relative Strength Index (RSI) surged dramatically from 34.7 to 67.8 in just six days, signaling a shift from an oversold to near-overbought condition. 

However, the RSI has since cooled slightly to 60.5, indicating that momentum may have slowed but remains between neutral and bullish. This suggests that while XRP’s price action remains bullish, the market could be entering a phase of consolidation or a brief pause after such a rapid rally.

XRP RSI | X
XRP RSI | X

More Bullish Outlook

In addition to the RSI, Core DeFi Researcher pointed to the Ichimoku Cloud analysis, which presents a more bullish outlook. As seen from the chart, XRP is currently trading above the cloud, as well as the Tenkan-sen and Kijun-sen lines, signs of a bullish trend. 

XRP Ichimoku Indicators | X

The presence of a green cloud ahead further supports the possibility of continued upward momentum. However, narrowing gaps and flatlining indicators indicate that bulls may be losing steam, potentially leading to a brief pause before any further price movement.

The analyst also highlighted a tightening of the Exponential Moving Average (EMA) lines, signaling the potential for a golden cross—a bullish pattern where the short-term EMA crosses above the long-term EMA. If this pattern materializes, XRP could break above the $2.23 resistance level and potentially move toward $2.50. 

XRP Resistance & Support | X

Key support levels sit at $1.96 and $1.61, which could act as significant defense zones if the breakout fails to materialize. Ultimately, the analyst says XRP is showing strong bullish momentum, but the crypto’s momentum must hold.

Strong Support at $1.6 – $2 Range

Meanwhile, pseudonamed analyst $0uL also provided insights into XRP’s price action, pointing to a significant price pattern that could signal a bullish reversal. $0uL used a 1-day chart, indicating that XRP has consistently bounced off key support levels between $1.6 and $2. 

XRP Target | X
XRP Target | X

This repeated failure to break below these levels suggests strong buying interest, which could pave the way for further upward momentum.

According to $0uL’s analysis, XRP’s rebound from the recent support just above $1.6 in early April indicates a recovery is underway, and a breakout could lead to substantial upside potential.

The target identified by $0uL is around the $3.40 to $3.60 range, representing a potential price increase of about 68.22% from XRP’s current level of $2.14. 

Key Support Zones Per Casi Trades

In a different analysis, Casi Trades offered a more cautious view of XRP’s current price action, focusing on the key support zones that could determine the asset’s next move. Casi noted that the $1.90 level, which aligns with a .5 Fibonacci retracement, is a crucial area for a potential short-term bounce. 

Additionally, the $1.55 level, marking the .618 Fibonacci retracement, is another important support zone that could play a pivotal role in XRP’s price action. Casi also referenced the Elliott Wave Theory, with the $1.55 level corresponding to the Wave 2 target, which could signal a reversal if the price fails to hold these key levels.

Casi highlighted that the RSI across multiple timeframes is showing bearish signals, which could suggest a shift in market momentum.

Given these developments, she cautioned that the focus should not be on pinpointing exact tops and bottoms but rather on staying grounded in the market structure. She advised traders to prepare for potential opportunities without reacting impulsively to market fluctuations.

US SEC Extends First Decision Deadline on Adding Staking to the Grayscale Ethereum ETFs

0

The US Securities and Exchange Commission has delayed a decision on Grayscale’s request to add staking services to its Ethereum ETFs.

In an April 14 notice, the Wall Street’s top regulator disclosed that it is extending the first deadline on the decision by 45 days. The US SEC took a proactive move on Monday, announcing the delay three days before the actual decision date.

Grayscale would now wait until July 1 to know the SEC’s next course of action. Meanwhile, the final deadline for an SEC decision on the rule change request is in late October.

US SEC Postponed Decision

For context, the New York Stock Exchange (NYSE) Arca filed a rule change request with the US SEC on February 14, seeking to amend the listing and trading guidelines of the Grayscale Ethereum ETF (ETHE) and the Grayscale Ethereum Mini ETF (ETH). The submission requested permission to introduce staking services to both US-native Ether investment funds.

The funds, with a net asset of $1.93 billion and $744.5 million, launched in July 2024 with seven other Ethereum spot ETFs. Nonetheless, the launch has failed to live up to the hype, especially compared with similar products tracking Bitcoin’s performance. For context, the Ether ETFs have seen a cumulative net inflow of $2.27 billion, with ETHE contributing negatively with a $4.23 billion net outflow.

Meanwhile, for the uninitiated, staking involves locking up an underlying asset (Ethereum) in a network to become a validator. While staked, the locked assets yield passive income for the user as they aid in processing transactions and improve the network’s security.

As a result, if the SEC approves the application published in the Federal Register on March 3, Grayscale will add staking services to its funds. This means users can decide to lock up their shares on the ETHE and ETH and earn staking rewards for doing so, further improving the attractiveness of these funds.

Notably, the average annual staking reward on-chain ranges between 2.3% and 3.5%, while that of centralized exchanges varies slightly. For context, Binance offers 3.82%, Lido between 3% and 3.28%, and Kraken up to 7%.

Tall Order for the US SEC?

The US SEC has received multiple applications to add staking services to existing Ethereum ETFs. In addition to Grayscale, 21Shares, through the CBOE BZX Exchange, has leveraged the evolving regulatory landscape to make demands of the commission.

Recall that the Wall Street securities watchdog, under Gary Gensler, refuted all attempts to add staking services to the Ethereum funds amid its unregistered security bias during the approval process. However, the new hierarchy has attempted to understudy the pros and cons of introducing staking following contacts with Jito Labs and Multicoin Capital.

However, the recent extension may have raised skepticism among market observers, who cite mixed feelings within the regulator’s camp. Nonetheless, prominent ETF analyst James Seyffart expects a favorable decision by the fourth quarter of the year.

Moreover, the SEC’s recent approval of options trading on the Ethereum spot ETFs on Nasdaq and NYSE has further fueled optimism that the regulator will sanction staking too.

Dogecoin Risks Triangle Breakdown: Will $0.13 Be Tested Again?

The V-shaped recovery in Dogecoin faces exhaustion near $0.168, risking a triangle pattern breakdown. Will DOGE dip to the $0.13 zone?

At $0.15936, Dogecoin struggles to hold a triangle pattern as selling pressure grows. The biggest meme coin has a market cap of $23 billion and has dropped 3.54% in the last 24 hours. 

As market volatility persists, meme coins are poised for high-momentum moves in either direction. Could Dogecoin see a swift correction toward $0.13?

Dogecoin Price Analysis

On the 4-hour technical chart, Dogecoin forms a V-shaped recovery from the $0.13219 level, initiating a short-term rally that peaked at the $0.1680 resistance.

Alongside this recovery, DOGE’s price action forms a triangle pattern. Recently, Dogecoin completed a downswing, testing the local support trendline within this pattern.

CRYPTO:DOGEUSD Chart Image by Trojan69420
Dogecoin chart

Facing short-term pressure, DOGE has slipped below the 50 and 100 EMA lines on the 4-hour chart. Moreover, the sudden decline in bullish momentum has triggered a bearish crossover in the MACD and signal lines.

As a result, technical indicators suggest a potential breakdown and price drop due to a triangle pattern meltdown.


Rising Bearish Sentiments Signal Downside Risk

As Dogecoin price nears a potential triangle pattern breakdown, bearish sentiments are growing in the derivatives market. The Long/Short ratio has dropped to 0.8025, with the short positions reaching 55.48%. 

DOGE Long/Short Ratio

The increasing bearish sentiments meet increased trading activity, reflected by the 0.82% rise in open interest. Currently, the open interest stands at $1.57 billion, with the funding rate dropping to 0.0007% on Bybit.

Analyst Remains Optimistic on DOGE

Analyst Trader Tardigrade remains optimistic on DOGE despite the increasing downside risk. The analyst identified an inverted head-and-shoulders pattern on the 4-hour price chart, highlighting a potential rally.

The pattern’s neckline aligns with the $0.17 supply zone. A breakout above this level could propel DOGE toward the $0.20 mark.

Dogecoin Price Targets

Based on Fibonacci retracement levels, Dogecoin is hovering near the 38.20% level at $0.15957. A sharp correction following a breakdown could push the price down to the 23.60% level at $0.14910.

On the upside, DOGE’s key resistance is at $0.1680. If a breakout rally occurs, Dogecoin could potentially climb to $0.18852.

If You Bought $1,000 Worth of XRP on Its First Day, Here’s What It’s Worth Now

Early XRP investors are enjoying an extraordinary return on investment—almost 400-fold based on today’s prices.

XRP has been around for nearly 13 years, and its price performance has been impressive. The XRP Ledger launched in June 2012 with a total supply of 100 billion XRP tokens. However, the popular price-tracking platform, CoinMarketCap, began tracking XRP’s price in August 2013.

At that time, XRP was the third-largest crypto asset, trailing only Bitcoin and Litecoin—Ethereum hadn’t even launched yet. Notably, XRP traded as low as $0.005882 back then.

What $1,000 Invested in XRP 13 Years Ago Is Worth Today

Since then, XRP’s value has surged, reaching an all-time high of $3.84 in 2018. Before hitting that peak, XRP also saw a significant dip to an all-time low of $0.002802 in July 2014.

As of today, XRP is trading at $2.20. An investor who bought $1,000 worth of XRP in 2013, when it was trading at $0.005882, would have acquired approximately 170,010 XRP tokens.

Remarkably, this amount would currently place the holder among the top 0.5% of XRP’s wealthiest investors. For context, only 31,878 accounts hold 100,000 or more XRP tokens out of the 6.37 million active XRP wallets.

At today’s value, that $1,000 investment would be worth approximately $374,022—a staggering 373x return over just 13 years. Meanwhile, at XRP’s all-time high of $3.84, that same investment would have been worth $652,829. This highlights just how profitable early XRP investments have been.

Would $1,000 Have Done Better in Bitcoin?

While these XRP gains are impressive, they pale in comparison to the returns from early Bitcoin investments.

At Bitcoin’s current price of $84,125, investors who bought in during its earliest days when BTC traded for as little as $0.058 have seen returns of 136,057,545%.

To put this in perspective, a $1,000 investment in Bitcoin at $0.05816 would have purchased 17,193 BTC. At today’s price, that portfolio would now be worth a jaw-dropping $1,446,440,852—nearly $1.5 billion.

Given Bitcoin’s performance, XRP investors remain hopeful. Enthusiasts frequently speculate about a future where 1 XRP could be worth as much as $10,000. In such a scenario, even someone holding just 100 tokens would become a millionaire—at least hypothetically.

Canada Regulators Approve World’s First Solana Spot ETFs

0

Canada is set to welcome multiple spot exchange-traded funds (ETFs) that would track the performance of Solana (SOL). 

Bloomberg ETF analyst Eric Balchunas shared the development on Monday, noting that the SOL ETFs will hit the Canadian market on April 16, 2025. 

The anticipated launch comes after the Ontario Securities Commission (OSC) approved multiple issuers to launch spot SOL ETFs in Canada yesterday. 

Notably, the approved issuers include prominent names like 31Q, Purpose Investments, CI Global Asset Management, and Evolve. These financial institutions will issue the spot Solana ETFs later this week. 

Canada’s Spot SOL ETFs Support Staking  

While the ETFs will directly invest in SOL and hold the coin, they will track a different Solana price index. The OSC permits the Solana ETF issuers to stake a portion of the SOL holdings, which could give investors additional returns. 

Balchunas attached a note from Canada-based financial institution TD (Toronto-Dominion) Bank, which claims that the yields from staking SOL may be higher than those generated from Ethereum staking. 

The note characterizes the funds as ‘the world’s first spot Solana ETFs,’ suggesting that the approved products are the first of their kind. 

Image

Solana Futures ETFs Underperform in the US

In a follow-up comment, the Bloomberg analyst highlighted how two separate SOL futures ETFs have fared in the United States. 

Balchunas indicated that the ETFs–Volatility Shares 2x SOL ETF and Volatility Shares SOL ETF–have underperformed massively, seeing little AUM since their debut in March 2025. Both ETFs have a combined AUM of $13.8 million at press time. 

However, the expert noted that a different futures ETF tracking XRP–the Teucrium 2x XRP ETF (XXRP)–has outperformed the AUM of both SOL futures ETFs despite launching after the SOL ETFs.

While he advised his followers not to overinterpret the analysis, Balchunas noted that the comparison marks an early glimpse into the altcoin ETF race. 

US Yet to Approve Spot SOL ETF

In the meantime, prospective spot Solana ETF issuers in the United States are awaiting the SEC’s decision on their applications. Some of the prospective issuers include Grayscale Investments, Bitwise, 21Shares, Canary Capital, Fidelity Investments, and VanEck. 

The U.S. SEC has acknowledged the exchange filings for these ETFs. However, it has not approved any of the products for launch.

Last month, the securities regulator delayed its decision on VanEck Solana Trust ETF, setting a new deadline of May 19, 2025. Whether the SEC will extend this deadline or approve the applications remains to be seen. 

Here Are Factors Strengthening Bitcoin Despite Macro Chaos

0

Santiment, a market intelligence platform, has identified factors strengthening Bitcoin stability amid the chaos of the global trade war.

In the past few days, Bitcoin’s price has rallied significantly, climbing by 12.9% from its low of $75,000 on April 8. The catalyst for this rebound came after President Donald Trump announced a 90-day pause on tariffs, which temporarily alleviated some market pressure.

At press time, Bitcoin is changing hands at $85,584, up 1.3% in the past 24 hours and 7% in the past week. 

Factors Supporting Bitcoin Price Rally

Beyond tariff easing, several blockchain metrics indicate that Bitcoin’s recent price increase is supported by improving fundamentals and positive on-chain metrics. 

First, Santiment’s report highlighted shifting market sentiment with traders becoming more optimistic about Bitcoin’s prospects. 

Whale Accumulation and Less Selling Pressure

Notable figures in the crypto community, such as Michael Saylor and his company, Strategy, continue to make significant Bitcoin acquisitions.

MicroStrategy recently added $285 million worth of Bitcoin to its growing reserves. This move further highlights the increasing confidence among long-term investors.

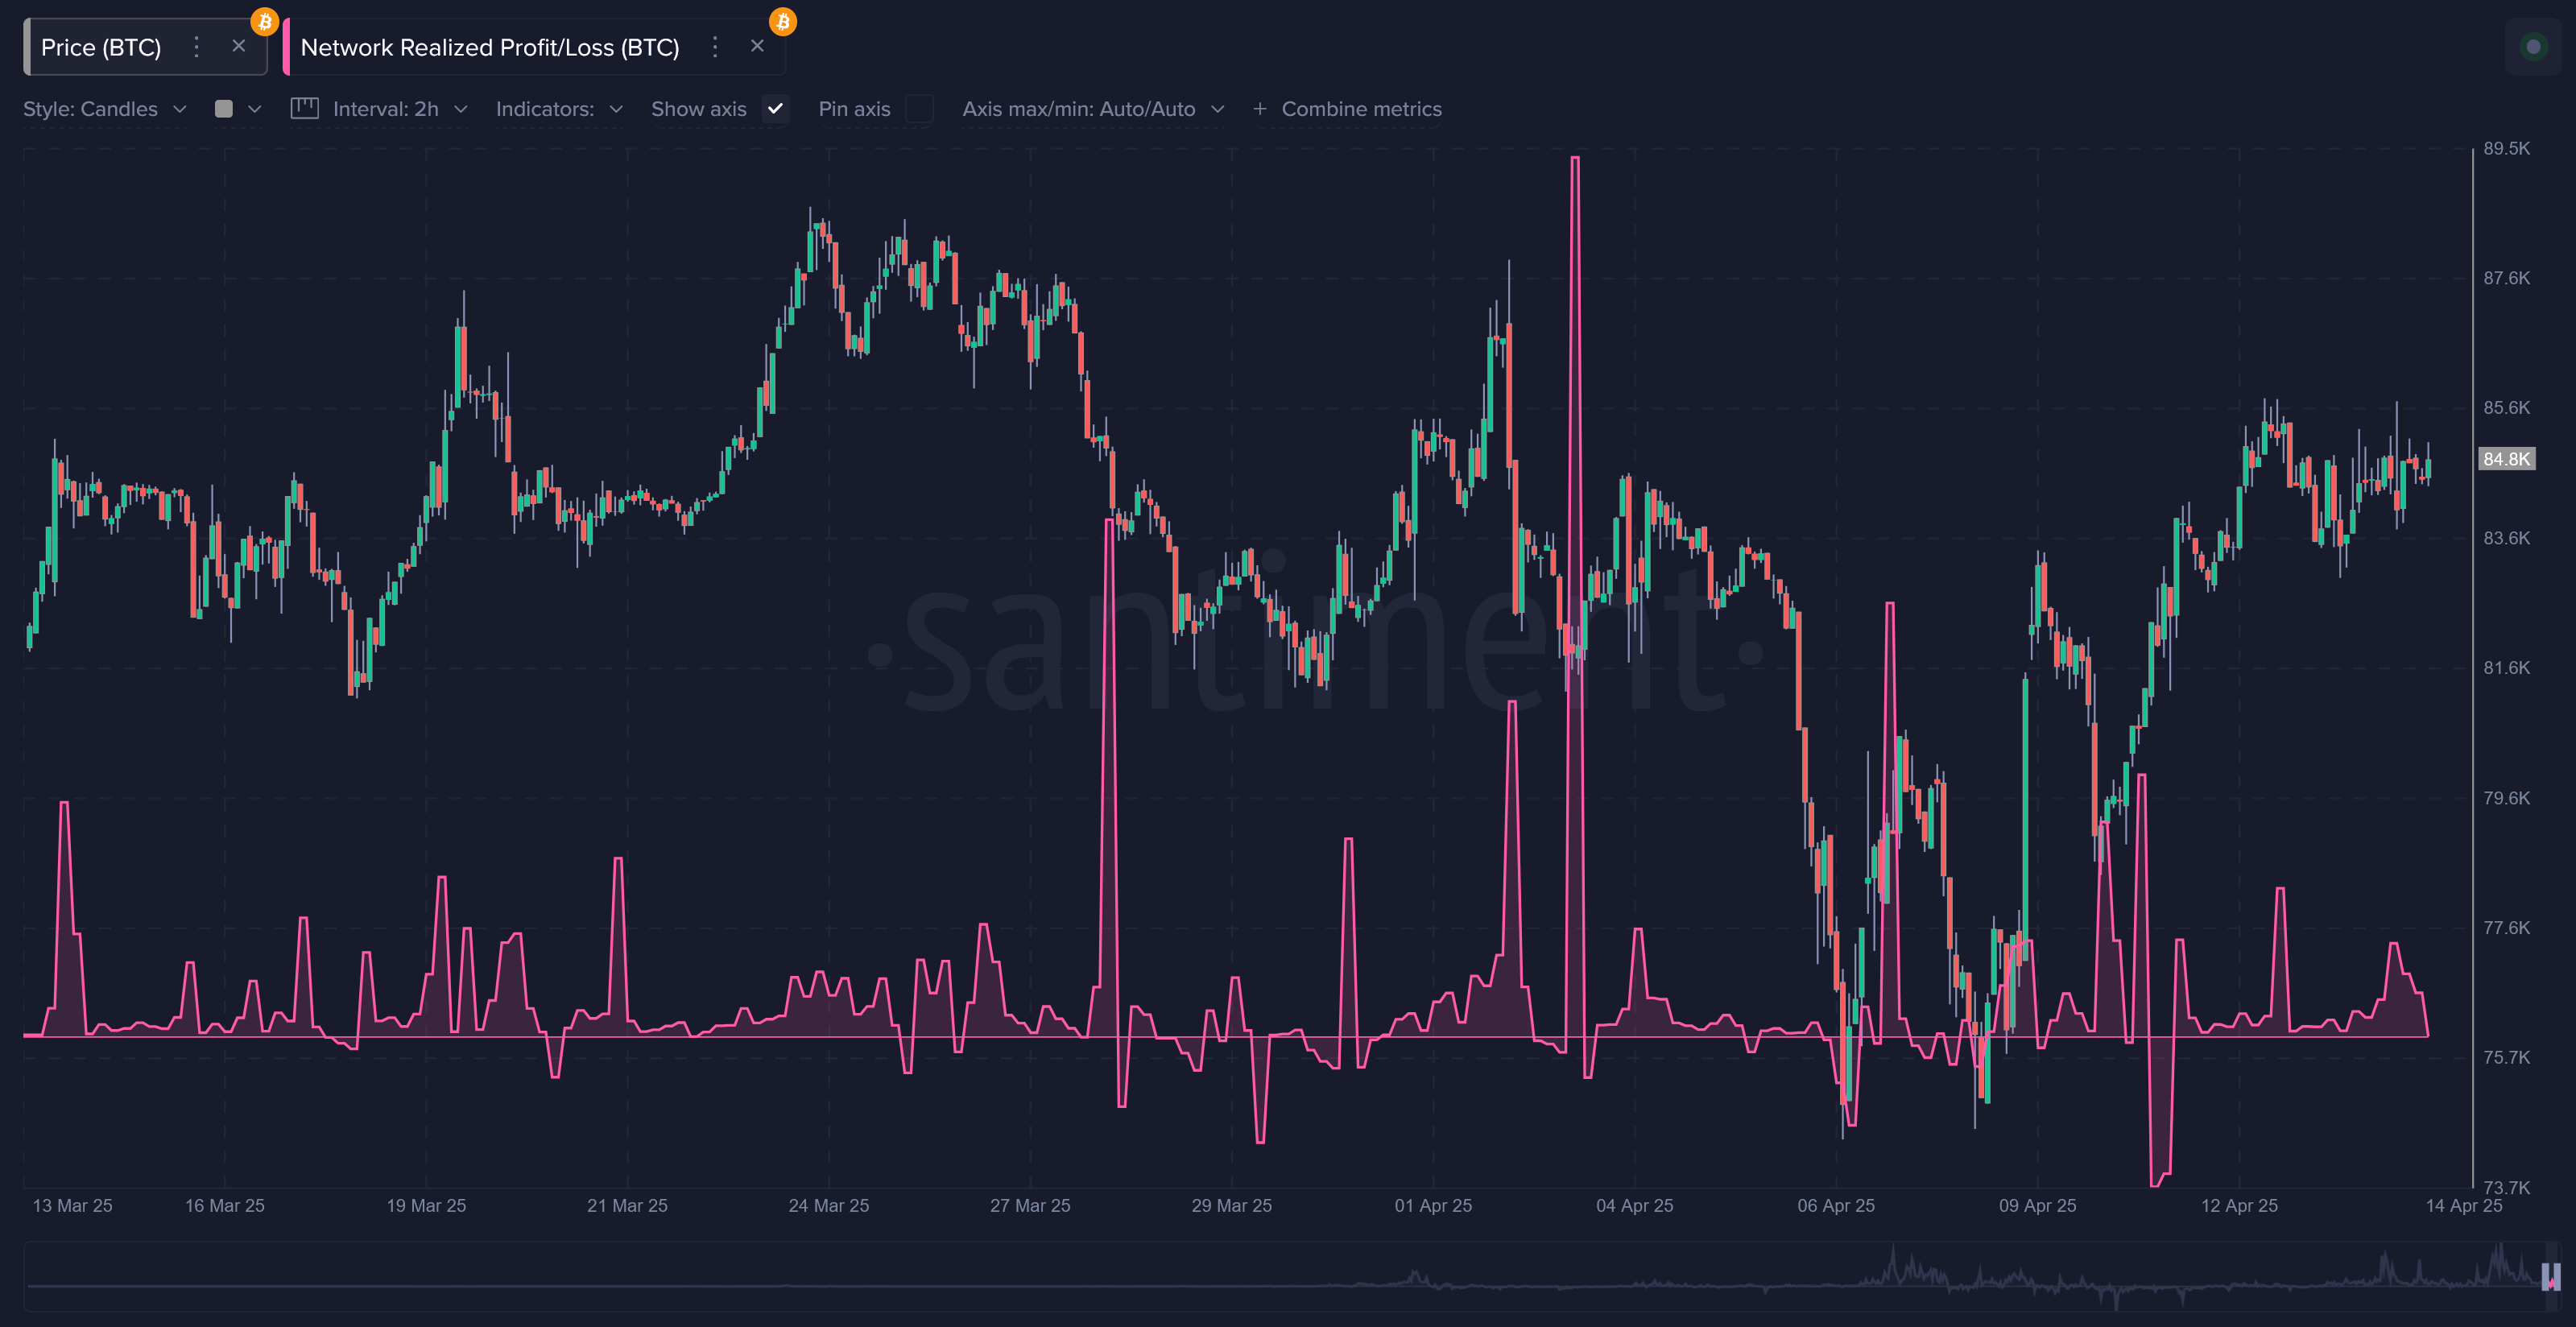
Santiment’s data further show a significant rise in the Network Realized Profit/Loss (NRPL), a key indicator that often signals the potential for sustained rallies. This metric suggests that more Bitcoin holders are in profit, which can help reduce sell pressure.

Santiment’s chart shows that the price tends to move upward when the realized profit/loss metric is positive. Conversely, prices follow the downside when the realized profit/loss metric moves to the loss zone.

Bitcoin Price vs Realized Profit/Loss

Supply on Exchanges Dropping

Meanwhile, the supply of Bitcoin on exchanges has decreased, meaning fewer coins are available for sale. This decline in exchange supply typically signals that investors are holding onto their positions long-term, contributing to Bitcoin’s price stability.

As Santiment’s chart shows, the supply of Bitcoin on exchanges started to fall in mid-March. At one point in April, while the supply into exchanges surged, the price started to drop, although it recovered after the supply started falling again.

Bitcoin Price vs Exchange Supply

Notably, the accumulation of Bitcoin by large holders, or “whales,” has been another crucial factor. Wallets holding 10 or more BTC have reached an all-time high of 16.36 million BTC, demonstrating growing interest from significant investors. 

Bitcoin Accumulation

Further, even during price declines, whales have continued to increase their holdings. As reported earlier, whales have consistently taken advantage of retail panic selling to accumulate more Bitcoin, further supporting the crypto’s price stability.

Blockchain’s Role in Global Trade Transparency

Per Santiment, beyond its use as an investment asset, blockchain technology is also playing an increasing role in global trade, a key issue in the context of current tariff debates.

Blockchain provides a transparent and reliable way to track the movement of goods, which can help customs officials verify whether products are being routed through countries with lower tariffs. 

This feature has drawn interest from government software vendors, with projects like Truebit working to integrate blockchain solutions into global trade and compliance systems.

Santiment highlighted that these developments point to crypto’s expanding role in areas outside of price speculation, offering solutions to longstanding supply chain challenges.

Cardano Eyes $1 Amid Breakout Formation: Can ADA Bulls Overcome $0.66 Resistance?

As Cardano approaches a key breakout pattern, a sudden surge in whale outflows signals a downside risk. Can ADA break through the crucial $0.6673 resistance?

At press time, Cardano is trading at $0.6438, reflecting a 1.37% intraday gain. The price action on the daily and 4-hour charts suggests a strengthening bullish trend.

The recent upward movement hints at the formation of a potential morning star pattern, possibly paving the way for a breakout rally. Could this rally push Cardano’s price toward the $1 mark?

Cardano Nears Breakout from Inverted Head and Shoulders Pattern

The daily chart shows Cardano taking off from the support trendline for the fourth consecutive time. This highlights the strong possibility of a new upswing in the ADA price trend. 

Cardano Price Chart
Cardano Price Chart

Bouncing off the 23.60% Fibonacci retracement at $0.5346 and the support trendline, Cardano is challenging the 38.20% level. This crucial Fibonacci level at $0.6673 acts as the immediate threshold. 

As bullish momentum grows, the MACD and signal lines give a positive crossover. However, the declining EMAs (50-day, 100-day, and 200-day) act as dynamic resistances. Additionally, the “death cross” in the 50- and 200-day EMAs carries a bearish signal on the daily chart. 

On the 4-hour timeframe, the recent rebound has shaped an inverted head and shoulders pattern, with the neckline aligning with the 38.20% Fibonacci level at $0.6673.

Despite bullish momentum, the price continues to struggle at the neckline, suggesting a possible post-retest correction if buyers fail to push through this resistance.

Cardano 4-hour Price Chart

Analyst Warns of Potential Downside Amid Whale Activity

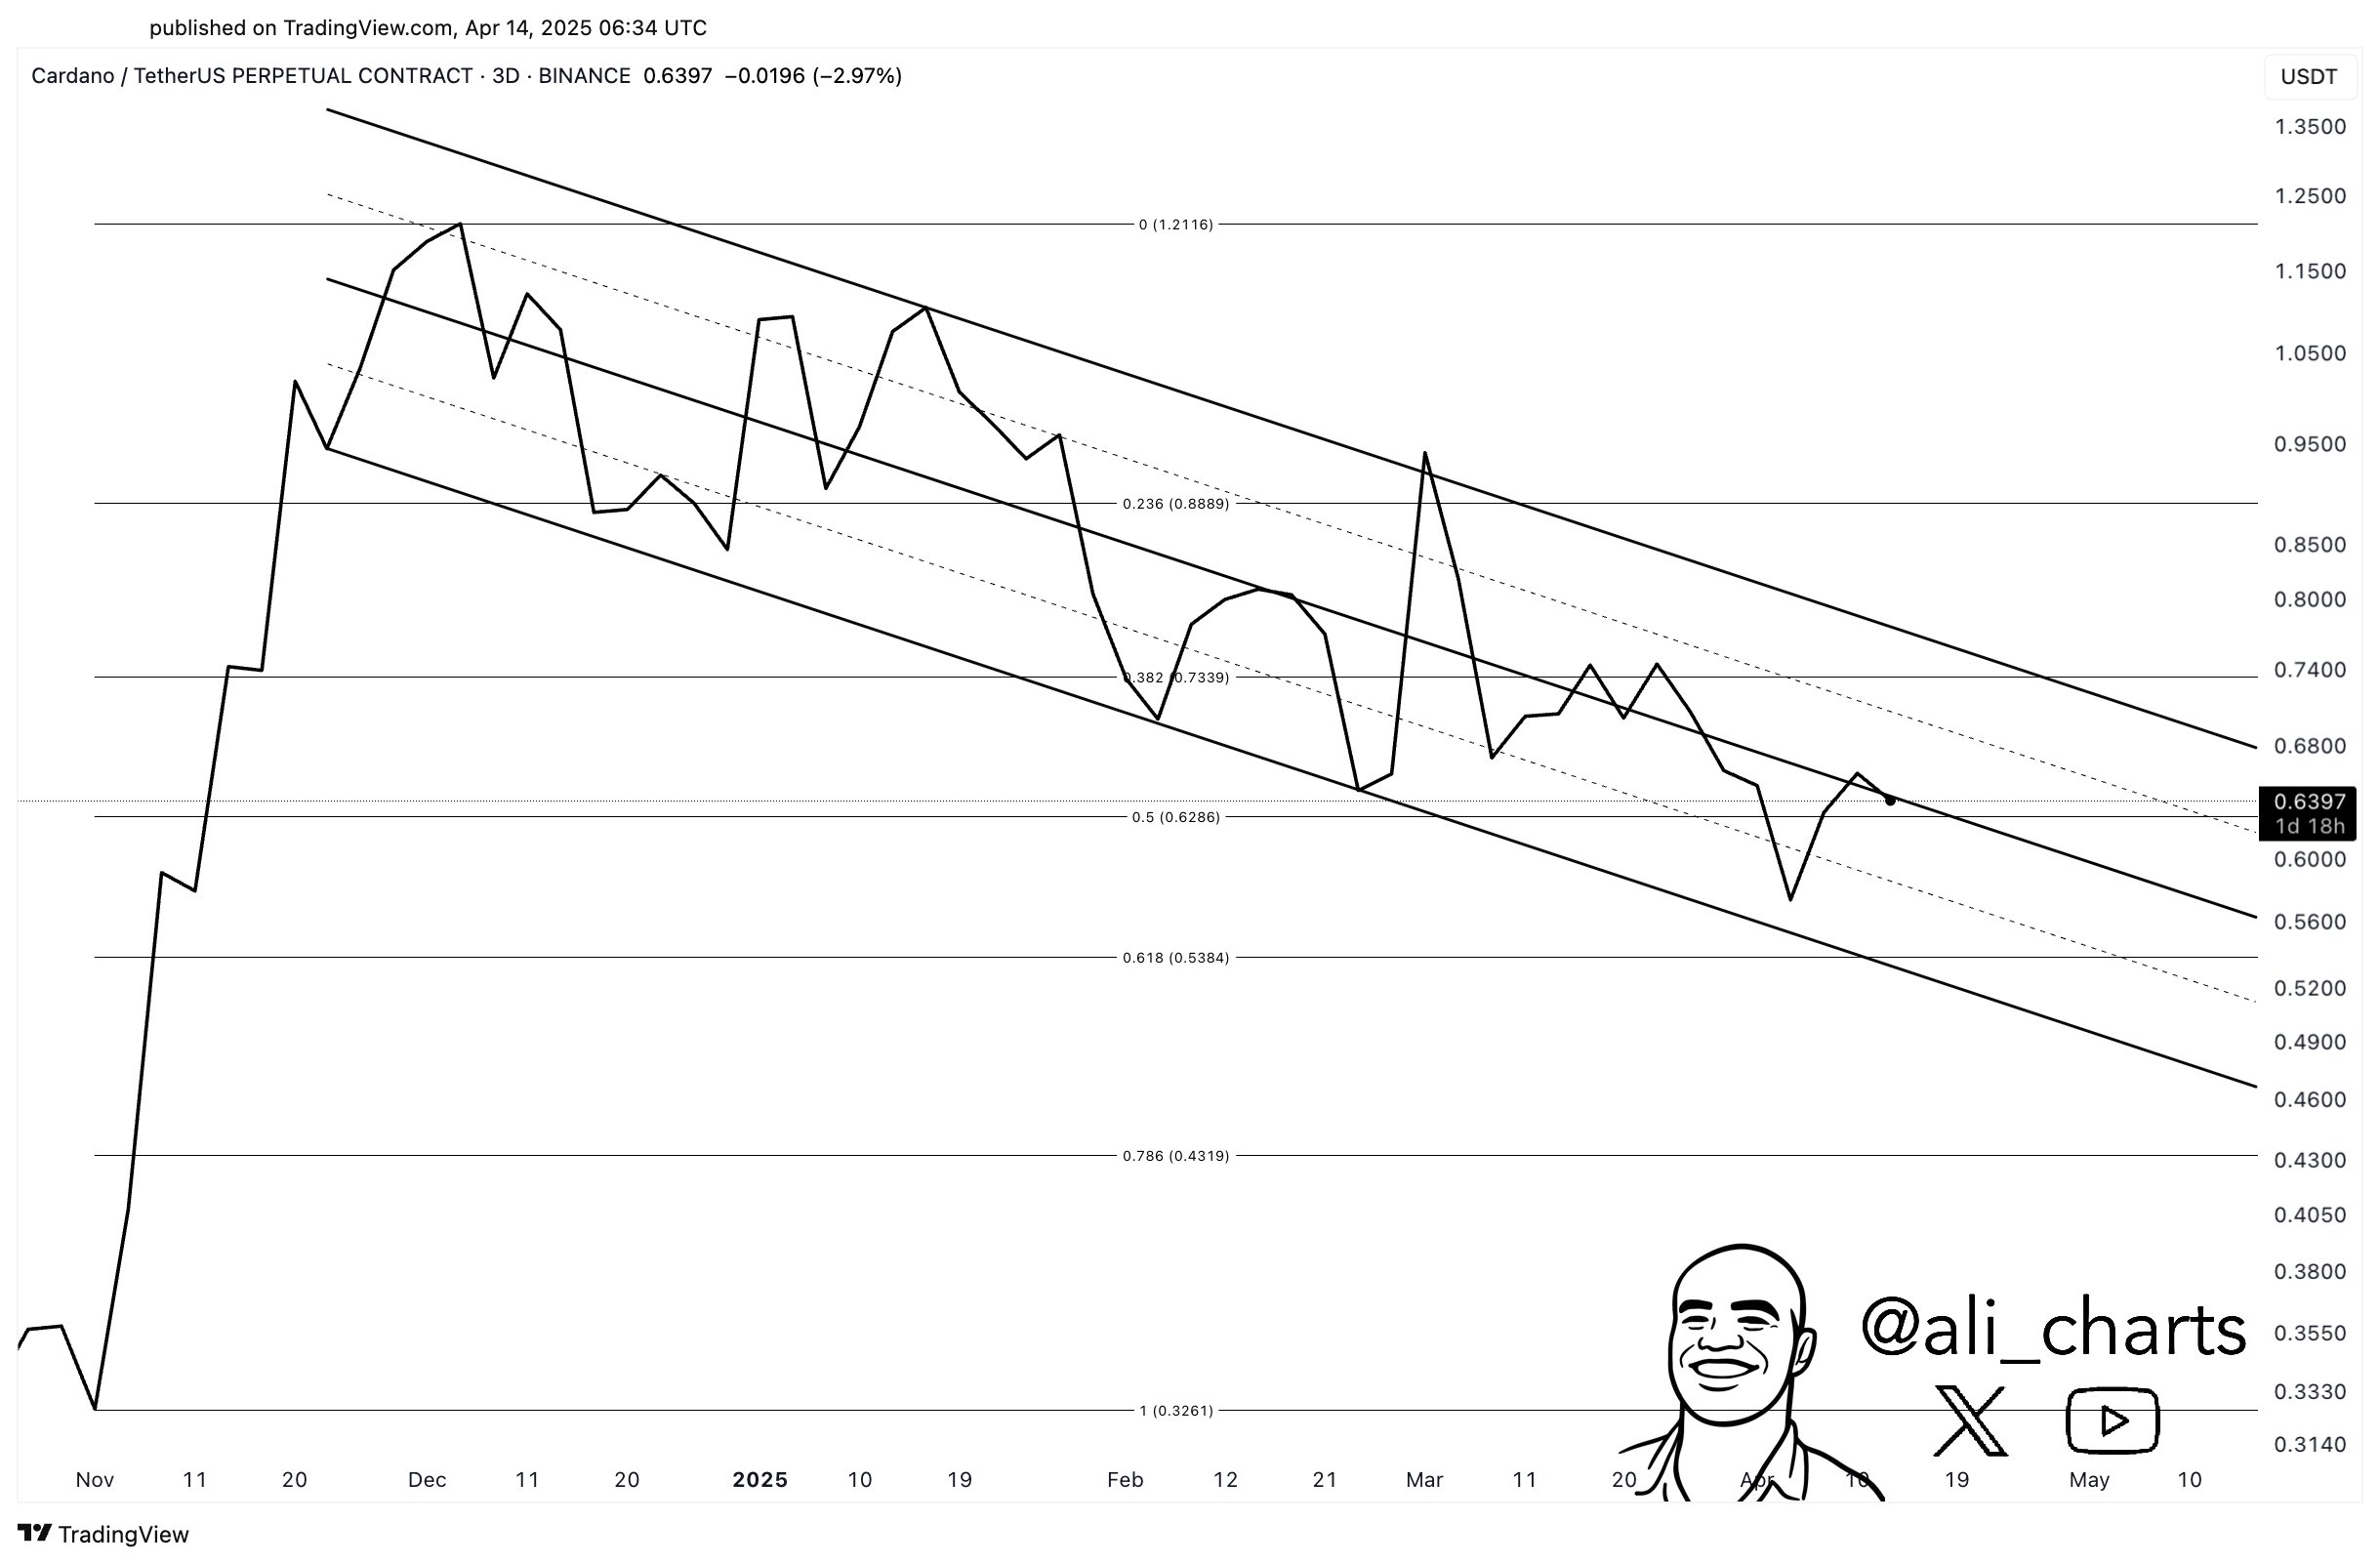
Despite the bullish signals, crypto analyst Ali Martinez warns of a potential downswing in Cardano as it reaches a crossroads. Martinez highlighted a declining channel pattern in the 3-day ADA price chart. 

The reversal in Cardano has reached the midline of the parallel channel, raising the possibility of a retest of the lower boundary. Key support lies at $0.63—considered the last line of defense.

A breakdown below $0.63 would likely plunge ADA prices toward $0.54.

Image

Furthermore, Martinez notes a sudden wave of whale offloading. According to Santiment data, whales have dumped 100 million ADA tokens over the past week. As a result, whale holdings (ranging from 1 million to 10 million ADA) have dropped to 5.65 billion ADA.

Will Cardano Hit $1?

A breakout of the inverted head and shoulders pattern on the 4-hour chart could serve as a key entry point for bullish traders. Based on Fibonacci retracement levels, the breakout rally may target the 61.80% level at $0.8819.

This would significantly increase the likelihood of Cardano reclaiming the 78.60% retracement level at $1. Conversely, a failure to surpass $0.6673 could send ADA back to retest support at $0.53.