Home Blog Page 81

XRP Open Interest Climbs Despite Price Slump as Market Eyes Reversal and $0.95 Liquidity Sweep

XRP is seeing growing activity in the derivatives market despite recent price weakness. 

The development suggests it could be setting up for a reversal once bearish sentiment reaches an extreme. The token is trading at $1.05, up 2.45% over the past 24 hours. 

However, XRP is still down 8% over the past week and has fallen 43% since the start of the year, reflecting broader weakness across the crypto market.

Open Interest Rises as Price Declines

XRP’s open interest has continued to rise even as its price trends lower. Over the past day, XRP open interest rose by 1.13%, reaching $2.37 billion. This figure suggests traders are opening new leveraged positions during the decline. Notably, open interest options dipped 67% to $21.66 million while options volume surged 16% to $5.4 million.

XRP | CoinGlass
XRP | CoinGlass

The accompanying chart shows XRP futures open interest steadily increasing over recent months. Meanwhile, the token has continued to post lower highs and lower lows.

Funding rates have also turned negative. This means short traders are paying long traders to keep their positions open, a sign that bearish sentiment is becoming more dominant in the perpetual futures market.

Image

Negative Funding Could Support a Rebound

Rising open interest and negative funding are creating conditions that may support a potential reversal. The market appears to be “charging up for a reversal,” one analyst observed. However, buyers may need to regain momentum before bulls can take control. 

Negative funding rates can sometimes precede sharp rallies. If the price suddenly rebounds, heavily leveraged short positions may be forced to close, triggering a short squeeze that pushes prices even higher.

Possible Sweep to $0.95

Despite the longer-term bullish outlook, XRP could first revisit $0.95. Many market watchers, including Ali Martinez, have forecast a fall to this level and even lower.

The idea is that the market may target liquidity below current prices before reversing. Such liquidity sweeps happen when the price briefly moves into areas with large clusters of stop-loss orders. This can flush out excess leverage before a new trend begins.

If buyers step in after that move and overall sentiment improves, XRP could be positioned for a stronger recovery.

The Case for Deeper Bear Markets

Notably, XRP is down about 69% from its July 2025 peak of $3.66. While significant, this decline is milder than past bear markets, which saw drops of 85%–96%, such as in the 2013–2014 and 2018–2020 cycles.

If XRP matched its worst historical drop (96%), the price could fall near $0.15, about 87% below current levels. Ali Martinez recently floated this target as a possibility, which would place XRP at a level last seen in 2017.

Regardless of how low the coin may go, many believe buying XRP under $1 offers significant opportunity for the next bull run.

Dogecoin Triple ZigZag Structure Shows Possible Low Before Rebound to $0.20

0

The Dogecoin triple zigzag Elliott Wave pattern suggests where the meme coin could find a possible final low before a rebound toward $0.20.

Dogecoin (DOGE) currently changes hands at $0.0733, down 2.95% over the past 24 hours. While the recent price movement already shows weakness, the larger chart pattern indicates DOGE could drop further below $0.04 before ending the ongoing correction.

Dogecoin Triple ZigZag Pattern Shows Ongoing Correction

Based on the Elliott Wave count, the entire structure on the daily chart suggests an ongoing corrective move, not the start of a new uptrend. 

The correction has played out in three separate phases: W, Y, and Z. Each phase contains its own three-part structure, beginning with an “a” wave decline, followed by a “b” wave rebound that often makes buyers believe the correction has ended, before a final “c” wave decline brings the strongest selling pressure.

Between these corrective phases, Dogecoin formed X waves, which acted as short-lived rallies before the broader downtrend resumed. These movements make up what Elliott Wave theory calls a triple zigzag, one of the most bearish corrective formations.

Earlier Dogecoin Declines

The first corrective phase, Wave W, pushed Dogecoin down from its December 2024 high of $0.48 to around $0.13 by April 2025. After reaching that level, the market entered its first X wave, lifting the price back to about $0.26 by May 2025 before sellers took control again.

The market then entered Wave Y, which followed another three-wave decline and eventually dropped to $0.10 by October 2025. 

After the drop, Dogecoin attempted another recovery through a second X wave, but this rally was much weaker than the previous one. Notably, the price climbed only to around $0.20 during October 2025, suggesting that buyers were no longer able to produce a stronger recovery.

Final Wave Could Push Dogecoin to $0.039

Chart data shows that Dogecoin is now trading inside Wave Z, the third and final stage of the larger corrective pattern. Within this phase, the “a” wave pushed prices lower from late 2025 into early 2026, ending at $0.10 in February 2026.

Dogecoin Triple ZigZag Pattern

After reaching this low, Dogecoin moved into a “b” wave recovery that carried the price to around $0.1184 by May 2026. However, that rebound has now failed. At roughly $0.0733, Dogecoin has already fallen nearly 40% from the $0.1184 peak. 

Meanwhile, the market has repeatedly failed to stay above $0.08, as sellers continue to step in whenever prices rise during the day. These signs confirm that the “c” wave of Wave Z is now in progress.

The earlier corrective phases also guide what could happen next. Specifically, during Wave W, the c wave dropped about 69% from the b wave high. In Wave Y, the same move measured roughly 66%, giving an average decline of 67%. 

If the current c wave follows a similar pattern from the $0.1184 b wave high, the final Dogecoin low could come in near $0.039 to $0.040.

Potential Dogecoin Recovery After Correction Ends

Although the current outlook remains bearish, the Elliott Wave theory also suggests a possible recovery once the correction finishes. A completed triple zigzag would mark the end of the corrective cycle that started after Dogecoin reached its peak in December 2024.

The chart projects a move higher after Wave Z reaches its final low. If this plays out, Dogecoin could recover toward the $0.18 to $0.20 range as a new bullish trend begins. 

However, this depends on the market first forming and confirming the Wave Z bottom through a clear structural reversal. So far, neither the expected bottom nor that confirmation has appeared, meaning the current downtrend remains in place.

XRP Drops 4% as Long Liquidation Spikes to $43 Million in 24 Hours

0

XRP is facing fresh selling pressure, with its price dropping close to the $1 psychological level and sparking a long liquidation frenzy.

XRP has continued to slide lower in the past 24 hours. It fell deeper than Bitcoin and other large-cap altcoins during this period, except for Ethereum.

The asset is down 4%, only lower than Ether’s 5.4% in the top 10 cryptocurrencies by market cap. XRP slumped to a low of $1.008 before buyers stepped in to spark a rebound to $1.036. Now, bulls are fighting to keep the $1 psychological price mark, as the dip is the closest XRP has come to breaking below this level.

XRP Correction Spikes Long Liquidation

As expected, leveraged long positions suffered severe losses. Amid the 4% drop, $43.18 million worth of XRP bull bets were liquidated from the market. This accounted for 97% of the total XRP positions forced to exit the market in the past 24 hours.

The total figure is $44.3 million, with XRP short positions accounting for just $1.13 million.

Notably, this trend temporarily changed in the past 4 hours, as shorts dominated XRP liquidations. Out of the $398,100 leveraged positions wiped out, $325,470 were shorts, and just $72,620 belonged to longs. This change aligned with the period where XRP rebounded from the intraday low to its current price, wrecking late shorts.

XRP Liquidations/Coinglass

Meanwhile, in the past hour, the market has returned to hunting long positions as they top the liquidation chart again. Specifically, $56,510 in long liquidations of the total $56,530 tells the whole story.

The XRP liquidation is just a fraction of the total positions wiped out from the broader crypto market. Over the past 24 hours, $1.09 billion worth of positions have been forcefully closed, with $846 million being long positions and $244 million short positions.

XRP Dip Buying Efforts

Amid the dip, market users appear to be accumulating. The Coinglass XRP spot flows show that outflows have surpassed inflows to exchanges, indicating withdrawals from platforms where XRP is easily sold to third-party and self-custody wallets.

Inflows stood at $159.9 million and outflows at $167.8 million. This means that a net of $7.85 million left crypto exchanges in the past 24 hours, culminating in about 7.62 million XRP tokens at the current market price.

XRP Spot Flows/Coinglass

Nonetheless, the dip buying is not supported by futures enthusiasm. The growing liquidation has forced a cautious stance among derivative traders, with open interest dropping 8.7% to $2.3 billion. Futures flows also reflect this trend, with outflows surpassing inflows by $44 million in the past 24 hours.

Key Supports as $1 Grip Is Loosening

With bears consistently testing the $1 support, their persistence could pay off, especially if the current market conditions endure. Per the UTXO Realized Price Distribution (URPD), XRP recently broke the $1.06 support, where over 830 million XRP changed hands.

For the uninitiated, the URPD metric measures the amount of an asset’s supply last moved at a particular price. The higher the volume moved, the more significant a level becomes, offering either support or resistance, depending on the price direction.

According to the URPD, the next core support level is $0.80, where wallets transacted 923 million XRP. After this is the $0.62 level, with 1.16 billion XRP moved there. A deeper correction could take XRP to $0.51, where 1.06 billion XRP changed hands.

XRP URPD Supports per Ali Martinez

Dogecoin Approaches Major Support After 90% Crash

Dogecoin is approaching a major historical support zone after another sharp selloff across the crypto market. 

Notably, the meme coin is trading around $0.0735. It is down about 3% over the past 24 hours, 11% over the past week, and 55% over the past year.

The latest decline followed a sharp drop in Bitcoin. The largest cryptocurrency briefly fell to $58,000 for the first time since October before recovering to around $59,400.

Despite the rebound, Bitcoin could still move lower. Continued weakness in the largest cryptocurrency has also weighed on altcoins, including Dogecoin.

$0.05-$0.06 Emerges as a Long-Term Buying Zone

Dogecoin’s price is nearing one of its strongest historical support areas. The $0.05-$0.06 range stands out as a potential long-term accumulation zone.

The weekly chart suggests DOGE could revisit support near $0.0607 before attempting a recovery. If buyers hold that level, DOGE could make a long-term move back toward resistance around $0.49. The projection also includes a possible 1,270% rally to $1.05 during the next major bull market.

Meanwhile, Bitcoin could also decline toward $54,000 before the broader crypto market begins to recover.

Dogecoin Weekly chart| TradingView

Buy Signal Appears as Bulls Defend Support

Despite the ongoing selloff, some technical indicators suggest selling pressure may be easing.

The TD Sequential indicator has flashed a buy signal on Dogecoin. Traders often watch this pattern for potential trend reversals after extended declines.

The $0.073 level is now acting as key short-term support. Holding above that price could allow DOGE to rebound toward $0.081. However, a break below $0.073 would invalidate the short-term bullish setup and increase the risk of further losses.

DOGE Returns to Levels Seen After the COVID Crash

The recent decline has pushed Dogecoin into one of its weakest on-chain positions in years. DOGE is now about 90% below its all-time high, recorded more than five years ago. 

On-chain data also shows that only 17% of the circulating supply remains in profit. That highlights the scale of investor losses.

The last time Dogecoin experienced similar market conditions was in April 2020, shortly after the COVID-19 market crash. At the time, the token was trading near $0.002.

Extreme pessimism has historically appeared near major market bottoms. Interest in meme coins often fades after prolonged declines, when many holders have already capitulated. 

While that does not guarantee a rebound, current sentiment resembles previous accumulation periods that preceded stronger market recoveries.

Bitcoin Hits New Cycle Low After Bull Trap Plays Out, but Breakdown Is Not Over

Bitcoin extended its downward trend this week after a short-lived recovery earlier this month.

Its price fell to a new cycle low of around $58,075, marking the first new cycle low since BTC peaked at $126,200 in October 2025. The latest decline followed a brief rebound that initially gave bulls hope.

After dropping to approximately $59,100 on June 5, Bitcoin quickly recovered to $64,185 two days later before extending its gains to $67,248 by June 15. However, sellers soon regained control, sending the asset back toward the $58,000 region.

At the time of writing, Bitcoin has recovered modestly to around $60,300. Even so, it remains down 2.35% over the past 24 hours, 21% over the past month, and about 31% year-to-date.

Support Breakdown and Rejection

Bitcoin’s recent price action has followed a textbook breakdown pattern. The asset first lost a key support level, then attempted to reclaim it during a retest but was rejected. This failed recovery reinforces the bearish outlook and suggests sellers remain firmly in control. In other words, the recent bounce appears to have been temporary.

The daily chart also shows Bitcoin trading below its former support zone. It remains below several major exponential moving averages while continuing to record fresh yearly and cycle lows.

Bitcoin daily chart | TradingView

RSI Points to Ongoing Bearish Momentum

Meanwhile, momentum indicators continue to favor the downside. The recent rebound resembles a bull trap. Although the price briefly recovered, the RSI failed to confirm the move with a bullish signal. Instead, the chart shows hidden bearish divergence, a pattern often viewed as a continuation signal during established downtrends.

Based on this setup, the RSI still has room to decline further. This suggests the broader correction may not yet be complete.

Bitcoin Cycle Bottom Still Not In

Despite Bitcoin’s recent bounce, the overall trend remains bearish. In a recent post on X, CryptoQuant founder Ki Young Ju said he does not believe Bitcoin has reached its cycle bottom.

He pointed to a log-scale chart of the 4-year rolling realized price risk/reward ratio. The chart shows Bitcoin is still trading well above its realized price, which reflects the average on-chain cost basis of investors.

Image

In previous market cycles, Bitcoin fell to its realized price before forming a bottom. That move improved the risk/reward profile as the market approached investors’ average purchase price. Ki Young Ju said that if Bitcoin does not follow this pattern, it could mean “this time is different.”

BTC Short-Term Holder Realized Price Turns Negative

Separately, CryptoQuant analyst Zizcrypto said the Short-Term Holder (STH) Realized Price YoY turned negative in mid-March, falling to around -2.4%. The metric has continued to weaken, reaching about -24% by June 23.

This means the average cost basis of short-term Bitcoin holders is now about 24% lower than it was a year ago. According to Zizcrypto, this reflects weakening momentum among short-term investors and fading speculative demand.

He noted that previous market reset phases saw much steeper declines of 55% to 65%, making the current drop relatively mild by comparison. However, he added that momentum among short-term holders has yet to show signs of a meaningful recovery, even if Bitcoin’s price stabilizes.

Cardano Prints Buy Signal but Watch Out for a Bull Trap

0

Cardano has printed a buy signal on the daily chart as its price reaches a deeply depressed state, but it could end up being a bull trap.

On the 1-day chart, the Tom Demark (TD) Sequential has printed a buy signal, suggesting that Cardano (ADA) could be gearing up for a reversal. If this plays out, the coin could push to higher prices in what could be a short-term rally.

Positive Sign Amid Recent Cardano Project Hack

The TD Sequential identifies trend reversal through exhaustion points numbered from 1 to 9. Usually, the bar lettered 9 is the point where prices could likely reverse course, signaling the end of the earlier trend.

On Thursday, this indicator flashed a buy signal on the daily ADA chart following its dip to an intraday low of $0.138. It suggests that after three consecutive days of downtrend where Cardano dropped nearly 10%, a rebound could be on the horizon.

Notably, this signal comes as the pessimism around a recent ecosystem project hack cools off. SecondFi, a Cardano-based wallet protocol, suffered a security breach resulting in a loss of over 16 million ADA ($2.4 million) from 374 wallets. However, an independent insight from SlowMist estimated the losses to be around 129 million ADA, worth roughly $20 million.

The event further added pressure to the Cardano ecosystem, which has been in the spotlight for several negative reasons lately. Governance issues, treasury budgeting, and major stakeholders threatening to step back have set the network back before the hack.

However, the negativity seems to be fully priced in. The TD Sequential suggests this with the buy signal. Interestingly, ADA is already experiencing a rebound. The coin has bounced nearly 6% from its intraday low of $0.138 today to its current price of $0.1454.

On-Chain Activity Supports Rebound

Further supporting this technical buy signal is the recent network activity highlighted by Santiment. Active addresses have climbed to 29,025, suggesting that more users are now leveraging the network on a daily basis.

Additionally, ADA’s social dominance surged to 0.33% as discussions mentioning Cardano on social platforms increased. The hack and its governance issues aided this spike, with FUD dominating the conversation.

However, Santiment highlighted that these events historically precede a mild price rebound. The two previous occurrences this year saw ADA recover considerably as buyers stepped in to tame selling pressure.

Is the Cardano Bounce a Bull Trap?

While both technical and on-chain developments point to a possible rebound, the broader market trend remains bearish. As such, the rebound could end up as a relief rally before the subsequent leg down.

The levels to watch closely are the $0.160 to $0.176 range, which represents a 10% to 21% increase from the current market price. If bears defend this resistance area, then the rebound would be a bull trap before a bearish continuation to lower lows.

Cardano TD Sequential and Rebound Target

However, breaking above the resistance makes things interesting for ADA. It opens the path to the previous lower high at $0.190 in early June. If Cardano reclaims and trades above this level while the broader market conditions start to improve, a durable bottom could start to form.

For now, the attention is on the buy signal from the TD Sequential and how Cardano will react to it.

Shiba Inu Investors Withdraw Over 350 Billion SHIB From Exchanges

0

Despite Shiba Inu’s recent price weakness, investors have resumed accumulating the token, withdrawing more than 300 billion SHIB from exchanges over the past 24 hours.

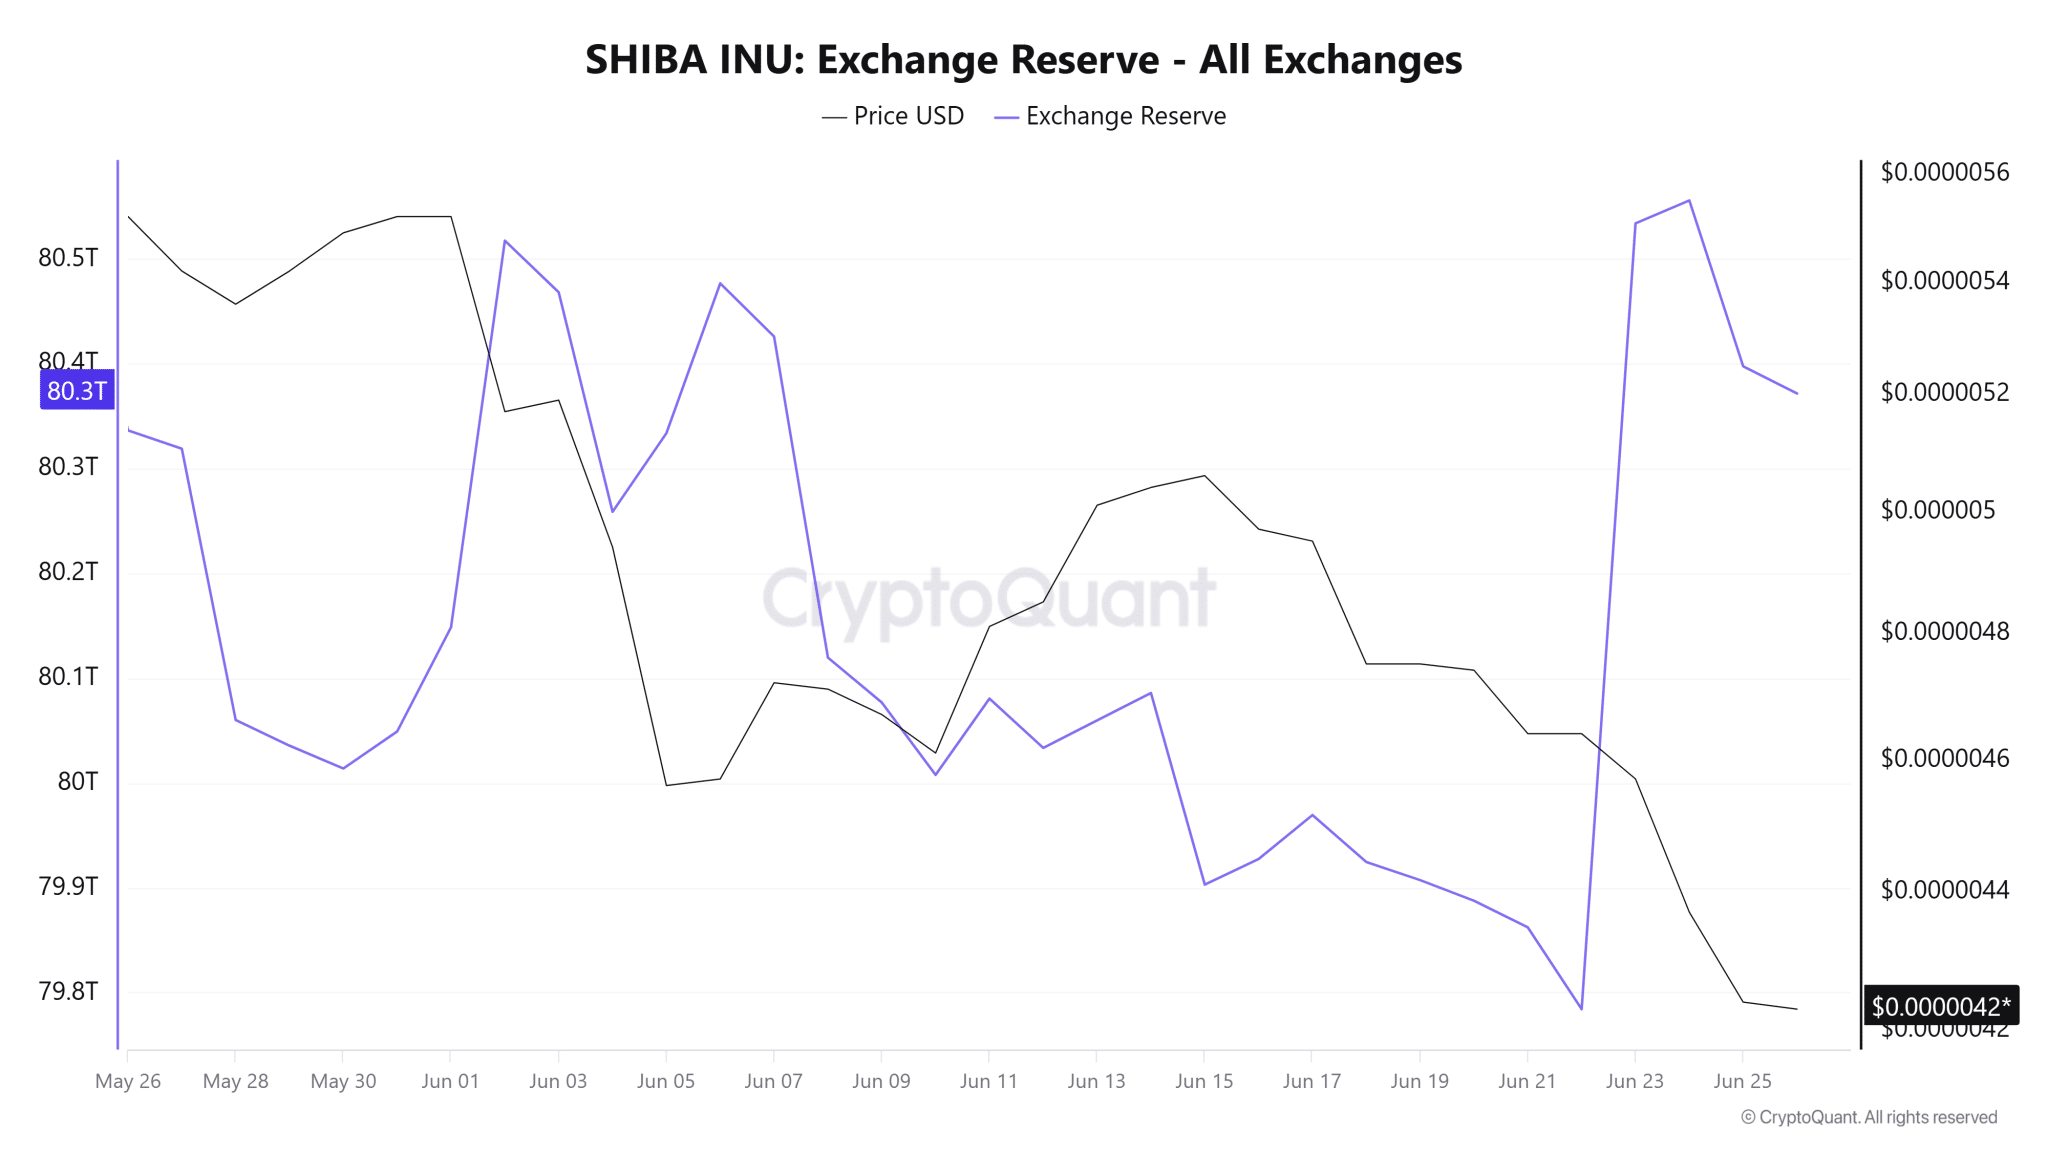
Notably, Shiba Inu’s exchange reserve have retreated from recent highs, signaling renewed accumulation activity. The metric, which tracks the amount of SHIB held in exchange wallets, fell from approximately 80.5 trillion tokens to 80.37 trillion in less than 48 hours.

Recent Exchange Inflows Interrupted a Multi-Week Trend

Before this week’s developments, Shiba Inu’s exchange reserves had been declining steadily for several weeks and had even fallen below the 80 trillion SHIB mark.

However, the trend briefly reversed earlier this week when investors transferred large amounts of SHIB to exchanges, according to data from CryptoQuant. Approximately 749 billion SHIB flowed into trading platforms, pushing exchange reserves to 80.53 trillion on June 23 and further to 80.55 trillion the following day.

Investors Return to Accumulation 

Contrary to expectations, exchange reserves failed to rise further as SHIB’s price plunged. Instead, they resumed their decline, dropping to 80.37 trillion tokens by press time.

The reversal suggests that many investors have returned to accumulation despite the broader market downturn. In particular, some holders appear to view current price levels as an opportunity to increase exposure rather than reduce positions. 

SHIBA INU Exchange Reserve All Exchanges

Negative Netflows Strengthen the Bullish Accumulation Case

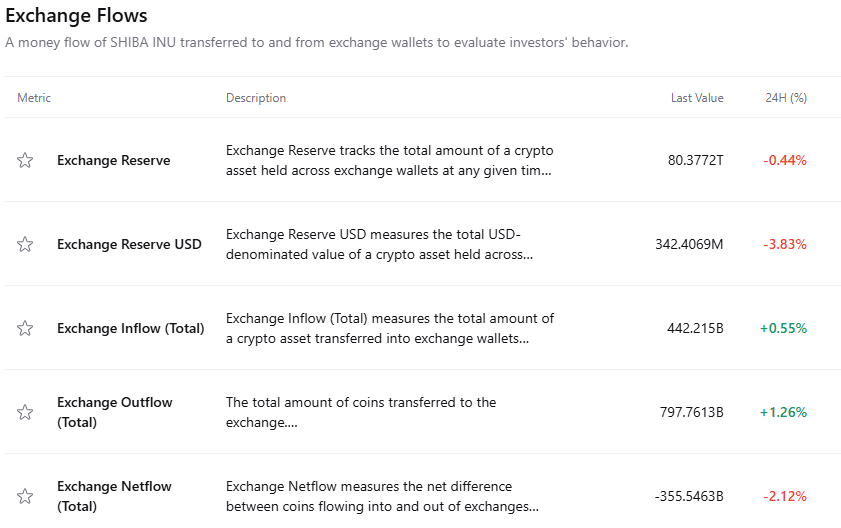
Exchange netflow data further reinforces the accumulation narrative. The metric, which measures the difference between exchange inflows and outflows, has turned negative and currently stands at -355.54 billion SHIB, representing a 2.12% decline in exchange balances over the past 24 hours.

Although inflows surged to 442.21 billion SHIB during the period, outflows significantly exceeded that figure and reached 797.76 billion tokens. As a result, exchanges recorded a net outflow of more than 355 billion SHIB, highlighting continued investor accumulation despite the recent correction. 

Shiba Inu Flows to Exchanges

Liquidation Wipes Out Over $200K Shiba Inu Leveraged Bets 

The latest accumulation trend emerged as Shiba Inu experienced another sharp decline that briefly pushed the token to around $0.0000040 earlier today. SHIB later recovered part of its losses and rebounded to approximately $0.0000042.

Nonetheless, the sell-off inflicted heavy losses on leveraged traders. According to liquidation data from CoinGlass, SHIB derivatives traders lost approximately $210,820 over the past 24 hours.

Long traders absorbed the overwhelming majority of the losses, with liquidations approaching $194,000. Meanwhile, short traders recorded comparatively smaller losses totaling about $16,870.

Shiba Inu liquidation

Charles Hoskinson Proposes Zero-Knowledge Wallet Recovery System for Cardano

0

Cardano founder Charles Hoskinson has introduced a new idea to make wallet recovery safer without compromising user privacy. 

In a post shared on June 26, 2026, Hoskinson revealed that he is experimenting with a Cardano smart contract to help users recover lost wallets securely.

The proposed system would allow users to recover ADA and Cardano Native Tokens (CNTs) stored in a dedicated pool by proving they own a wallet’s 24-word recovery phrase through a zero-knowledge proof (ZKP). Importantly, users would not need to reveal the phrase itself during the process.

A Recovery System Built Around Privacy

Hoskinson’s proposal revolves around the use of zero-knowledge technology. Specifically, users would simply prove that they know the recovery phrase that controls the wallet instead of exposing sensitive wallet information.

Cardano founder Charles Hoskinson on X

This would keep private information hidden from both the blockchain and outside parties. With this proposed setup, funds would remain locked inside a smart contract or special recovery pool. Once the contract confirms the proof, it will automatically release the assets to the rightful owner.

Such a system could support ethical recovery efforts by helping users regain access to lost or stolen funds but reduce the need to trust third parties. The goal is to make self-custody easier and safer without giving up the security that cryptocurrencies are known for.

To move the project forward, Hoskinson said he plans to work with several well-known members of the Cardano ecosystem. These include Pi Lanningham, CTO at Sundae Labs, Sebastien Guillemot, a major contributor to both Cardano and Midnight, and the wider Midnight team.

The proposed recovery system also builds on several existing Cardano features, including its UTxO model, Plutus smart contracts, and growing support for zero-knowledge applications. These technologies could help make self-custody more practical but maintain security standards.

The SecondFi Incident

Hoskinson’s announcement comes at a time when wallet security has become a major topic within the Cardano community. Notably, the recent SecondFi security incident brought attention to the risks associated with wallet recovery.

SecondFi, a Cardano-based self-custodial platform, suffered a security breach from its key-generating software that led to losses initially reported at $2.4 million. The issue affected certain wallet addresses linked to the neofinance platform. 

SecondFi has advised users not to import their recovery phrases into other wallets because the threat activates when users sign transactions, not during the restoration process itself. The platform is currently preparing a verification and claims procedure for affected users.

Meanwhile, recent Cardano wallet updates have continued to focus on restoration performance, Mithril snapshots, and security improvements. 

However, some older versions of SecondFi still use 15-word recovery phrases, which may limit how easily those wallets can work with a recovery system designed specifically for 24-word phrases.

Crypto Industry Searching for Better Recovery Solutions

Across the cryptocurrency industry, managing recovery phrases remains one of the biggest challenges facing users. Notably, standard 12-word and 24-word BIP39 seed phrases provide a reliable way to restore wallets, but they also create a single point of failure. 

If users lose both their device and recovery phrase, they usually lose access to their funds permanently. Many security breaches also come from phishing attacks, malware, and social engineering schemes.

As a result, developers continue to explore ZK-based recovery systems. Similar ideas have appeared in discussions about quantum-resistant recovery methods and privacy-focused blockchain networks. However, developers still need to address issues involving legacy wallets and implementation security.

The industry is also testing other approaches, including social recovery systems, multi-party computation (MPC), biometric and hardware-based authentication, and hybrid custodial models. Some projects, such as Chia, have introduced features like clawbacks and vaults to reduce the impact of theft.

Historical XRP Midterm-Year Trends Hint at Where This Cycle Could Bottom

0

XRP has always struggled in June of any midterm year, and this historical performance provides hints into where this cycle could bottom.

The bearish trend that began in the fourth quarter of 2025 has already pushed XRP below the psychological levels of $3 and $2, and the asset is now at risk of falling below the $1 mark.

If XRP loses the $1 level, it could return to prices last seen before the November 2024 rally. As the downtrend continues, XRP’s performance during June in previous midterm years suggests that the asset could bottom between $0.79 and $0.91 this cycle.

Past XRP Midterm Years

Historical data shows that XRP has consistently struggled during June in every midterm year. In some cases, the lowest price recorded during the month either marked the cycle bottom or came very close to it.

For instance, in June 2014, the first midterm year after XRP began trading publicly in 2013, the price fell from $0.004515 to a low of $0.00379, representing an 8.67% decline. 

Although this drop did not mark the exact bottom, it came close. XRP later declined further to $0.00281 in July 2014 before finally finding support and beginning a recovery.

For June 2018, XRP dropped from an opening price of $0.61117 to a low of $0.42420, resulting in a 30.59% decline. However, unlike the 2014 cycle, the June low was still far from the bottom. XRP remained under pressure and eventually fell to $0.11400 in March 2020 before the downtrend finally ended.

XRP Midterm Year Performance

Meanwhile, during June 2022, after the Terra collapse, XRP declined from an opening price of $0.42091 to a low of $0.2870, a drop of 31.68%. Notably, the $0.2870 level turned out to be the exact bottom of the 2022 bear market.

While XRP did not recover immediately afterward, it never revisited that low. Even the collapse of FTX in November 2022, which triggered heavy losses across the crypto market, failed to push XRP below $0.2870.

Historical Trends Suggest Possible Downside Ahead

Looking at the last three midterm years, XRP recorded an average decline of 23.6% during June. So far in June 2026, the asset has already fallen 24.27%, dropping from $1.33 at the start of the month to a low of $1.00795 before recovering slightly to around $1.03.

Since the current decline already matches the historical average, some investors may believe that XRP has already reached its bottom for this cycle. However, historical patterns suggest that this may not necessarily be the case.

In a more bearish scenario, based on the 31.68% decline seen in June 2022, XRP could still fall below $1 and drop toward the $0.91 level. However, technical data from the daily chart shows that this area does not align with a significant Fibonacci support zone.

As a result, a move down to $0.91 could expose XRP to additional selling pressure, potentially sending the price lower until it reaches the next major support area between $0.79 and $0.80. This zone aligns with the Fibonacci 1.272 extension and currently represents the next strong support level.

XRP Daily Fibonacci Levels

XRP Must Reclaim a Key Resistance Level

Despite the ongoing weakness, XRP could still recover from its current levels. However, the market remains uncertain, and the asset may continue setting new lows unless buyers regain control.

For sentiment to improve, XRP needs to break decisively above the Fibonacci 0.5 retracement level at $1.56. A sustained move above this level would signal that bulls have regained control of the market.

Even then, reclaiming $1.56 would not completely remove the risk of further declines. Notably, if broader market conditions remain weak and selling pressure continues, XRP could still face another pullback.

James Wynn Says Shiba Inu Is ‘Dead, Old, and Boring’

0

Crypto analyst James Wynn has renewed his criticism of Shiba Inu after the meme coin plunged to around $0.0000042 during the latest market downturn.

Shiba Inu suffered significant losses over the past day as the broader crypto market continued its downward trajectory. Bitcoin fell below $60,000, Ethereum dropped under $1,526, and XRP slid toward the $1 mark. However, Wynn directed his criticism toward SHIB, which declined by 6.65% yesterday before trading near $0.0000042.

Wynn Declares Shiba Inu Dead, Says “SHIB Would Never Come Back” 

In an X commentary yesterday, Wynn dismissed Shiba Inu’s recovery prospects, declaring that “SHIB would never come back.” He argued that the project has become old and less attractive compared to newer meme coins entering the market.

Wynn described SHIB as “dead and boring.” Nevertheless, he acknowledged that nostalgia could eventually revive interest in the token over the next five to ten years and potentially trigger another major rally. 

Analyst Targets BONE and the Shiba Inu Ecosystem

Meanwhile, Wynn accused the Shiba Inu development team of executing a “cash grab” through the launch of Bone ShibaSwap (BONE). 

The team launched BONE in July 2021 as the governance token for ShibaSwap, the ecosystem’s decentralized exchange. Later, developers selected it as the gas token for the Shibarium blockchain. Despite the token’s utility, critics like Wynn believe that investors became trapped in a liquidity drain following the token’s massive collapse.

For context, BONE has since fallen roughly 99.9% from its all-time high and currently trades near $0.040, reinforcing Wynn’s criticism of the project.

Weak Ecosystem Activity Adds to Bearish Sentiment

Following Wynn’s criticism, SHIB extended its decline to $0.00000408 before recovering to around $0.000004228 earlier today. Despite the rebound, the token remains down 4.8% over the past 24 hours. Its market cap stands at $2.49 billion, making it the 30th-largest cryptocurrency by market value.

Notably, SHIB’s price action continues to mirror the broader market’s performance. However, the ecosystem has produced few major developments capable of supporting demand or attracting new investors.

Furthermore, the strong community enthusiasm that powered SHIB’s historic rally has weakened considerably, with many retail investors shifting their attention to newer projects and narratives.

The Shiba Inu team’s priorities have also evolved in recent months. Lead ambassador Shytoshi Kusama has increasingly focused on developing an independent artificial intelligence (AI) initiative rather than expanding the core SHIB ecosystem.

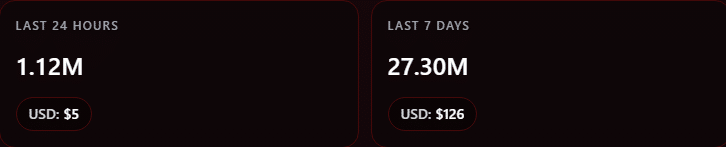
In addition, the token burn program, which many supporters expected to boost scarcity and support prices over the long term, has slowed significantly. Only 1.12 million SHIB tokens were burned over the past 24 hours, while weekly burns totaled just 27.3 million tokens. 

Shiba Inu burn
Shiba Inu burn

These factors have strengthened the bearish case against Shiba Inu and fueled criticism from analysts such as Wynn, who argue that the meme coin may struggle to recover from the current downturn.