Home Blog Page 820

As XRP Falls Below $2, Here’s How Much Needed to Enter the XRP Rich List of Top 10%, 5%, and 1% of Wallets

0

XRP slumps below a key support level amid the broader market crash, but this drop has reduced the amount necessary to enter the top XRP rich list.

The global financial scene is witnessing a large-scale bloodbath due to President Donald Trump’s recent tariff announcement. Amid this widespread panic, the broader crypto market has slumped, losing $310 billion since April 5, with XRP also suffering an impact.

Particularly, XRP has collapsed by a massive 22.74% since Sunday, April 5, with a 12.73% drop this morning alone. This rapid price crash has resulted in a loss of about $27.1 billion in XRP’s valuation, with its market cap dropping below the $100 billion mark for the first time since it reclaimed it in November 2024.

Meanwhile, perhaps one of the most bearish developments amid this downtrend is that XRP has slumped below the pivotal $2 psychological support. While most analysts have suggested that losing this mark would lead to steeper declines, some have highlighted the silver lining.

Amount Needed to Enter XRP Top Rich List Amid Price Drop

Notably, with this drop, the cost of procuring XRP necessary to enter the coveted top rich list has drastically reduced. For context, data from the community-driven Rich List resource confirms that to enter the top 10%, an investor must hold at least 2,500 XRP.

At the time XRP price soared to the $3.4 peak in mid-January, the investor would have spent $8,500 to amass these tokens. However, at the $2 price, this would require $5,000. Now, with XRP currently trading for $1.68, to amass the same 2,500 tokens would demand a capital of $4,200, less than half the $8,500 price tag.

Meanwhile, data shows that to enter the top 5% XRP rich list, a market participant must hold at least 9,000 XRP, worth $30,600 when XRP traded for $3.4. Interestingly, at the current price, the cost of accumulating these 9,000 XRP tokens has dropped by $15,480 to $15,120.

Further, those who wish to be part of the top 1% on the XRP rich list would need to possess 51,861 XRP tokens or above. At the $3.4 yearly peak, these tokens cost $176,327. However, as XRP has collapsed to $1.68, these tokens are now worth $87,126, a discount of over $89,000. 

Optimism in a Bloodbath

Due to the massive discount for XRP prices that has emerged from the recent downturn, some traders are already looking to fill their bags. The Crypto Basic confirmed this morning that despite large selling activity from Korean traders, some traders on Binance and Coinbase placed buy orders at low price such as $1.9 and $1.85.

This buying spree is a result of optimism around XRP’s potential to recover. Market experts like Oscar Ramos continue to champion the “buy the dip” narrative. Interestingly, most recently, analyst EGRAG suggested that XRP is still in a bull run, anticipating a 1,000% or 2,700% upsurge from current levels. 

Ethereum Breaks Below $1,500: Will It Test the $1,000 Mark?

Ethereum price slips under $1,500 amid rising bearish pressure. Will it plunge toward the critical $1,000 level?

The crypto market has experienced $1.38 billion in liquidations over the past 24 hours, with the altcoin market (excluding Bitcoin) dropping 12%. The total market capitalization currently stands at $869.1 billion, with the largest altcoin, Ethereum, falling below the $1,500 mark.

As bearish sentiment grows, will Ethereum’s price trend move towards the $1,000 support? Let’s explore.

Ethereum Price Falls Under $1,500

On the daily chart, Ethereum’s price is following a falling channel pattern. Currently, the sudden reversal from an intermediate resistance trendline is retesting the local support trendline.

Ethereum Price Chart

Over the past 36 hours, Ethereum has dropped from $1,800 to a 24-hour low of $1,411. As of now, it is trading at $1,499, showing a 5% intraday pullback after a 12% drop on Sunday.

As bearish pressure mounts, the possibility of a further downside in Ethereum increases. However, the lower price rejection from the 24-hour low hints at a potential positive turnaround within the falling channel.

Additionally, the lower price rejection comes from the S1 pivot support level at $1,424, close to the local support trendline.

Nevertheless, Ethereum’s overall trend remains bearish, with the recent decline triggering a bearish crossover in the MACD and signal lines. This suggests a sell signal and raises concerns about a potential breakdown.

Ethereum Futures: Bulls Buying the Dip

Despite the steep correction, the lower price rejection indicates a potential bullish reversal. This has sparked bullish sentiment in the derivatives market, leading to an increase in long positions.

Ethereum Long/Short Ratio

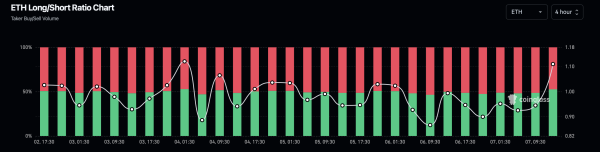
In the last four hours, the percentage of long positions in Ethereum contracts has risen to 52.6%, pushing the long-to-short ratio to 1.10.

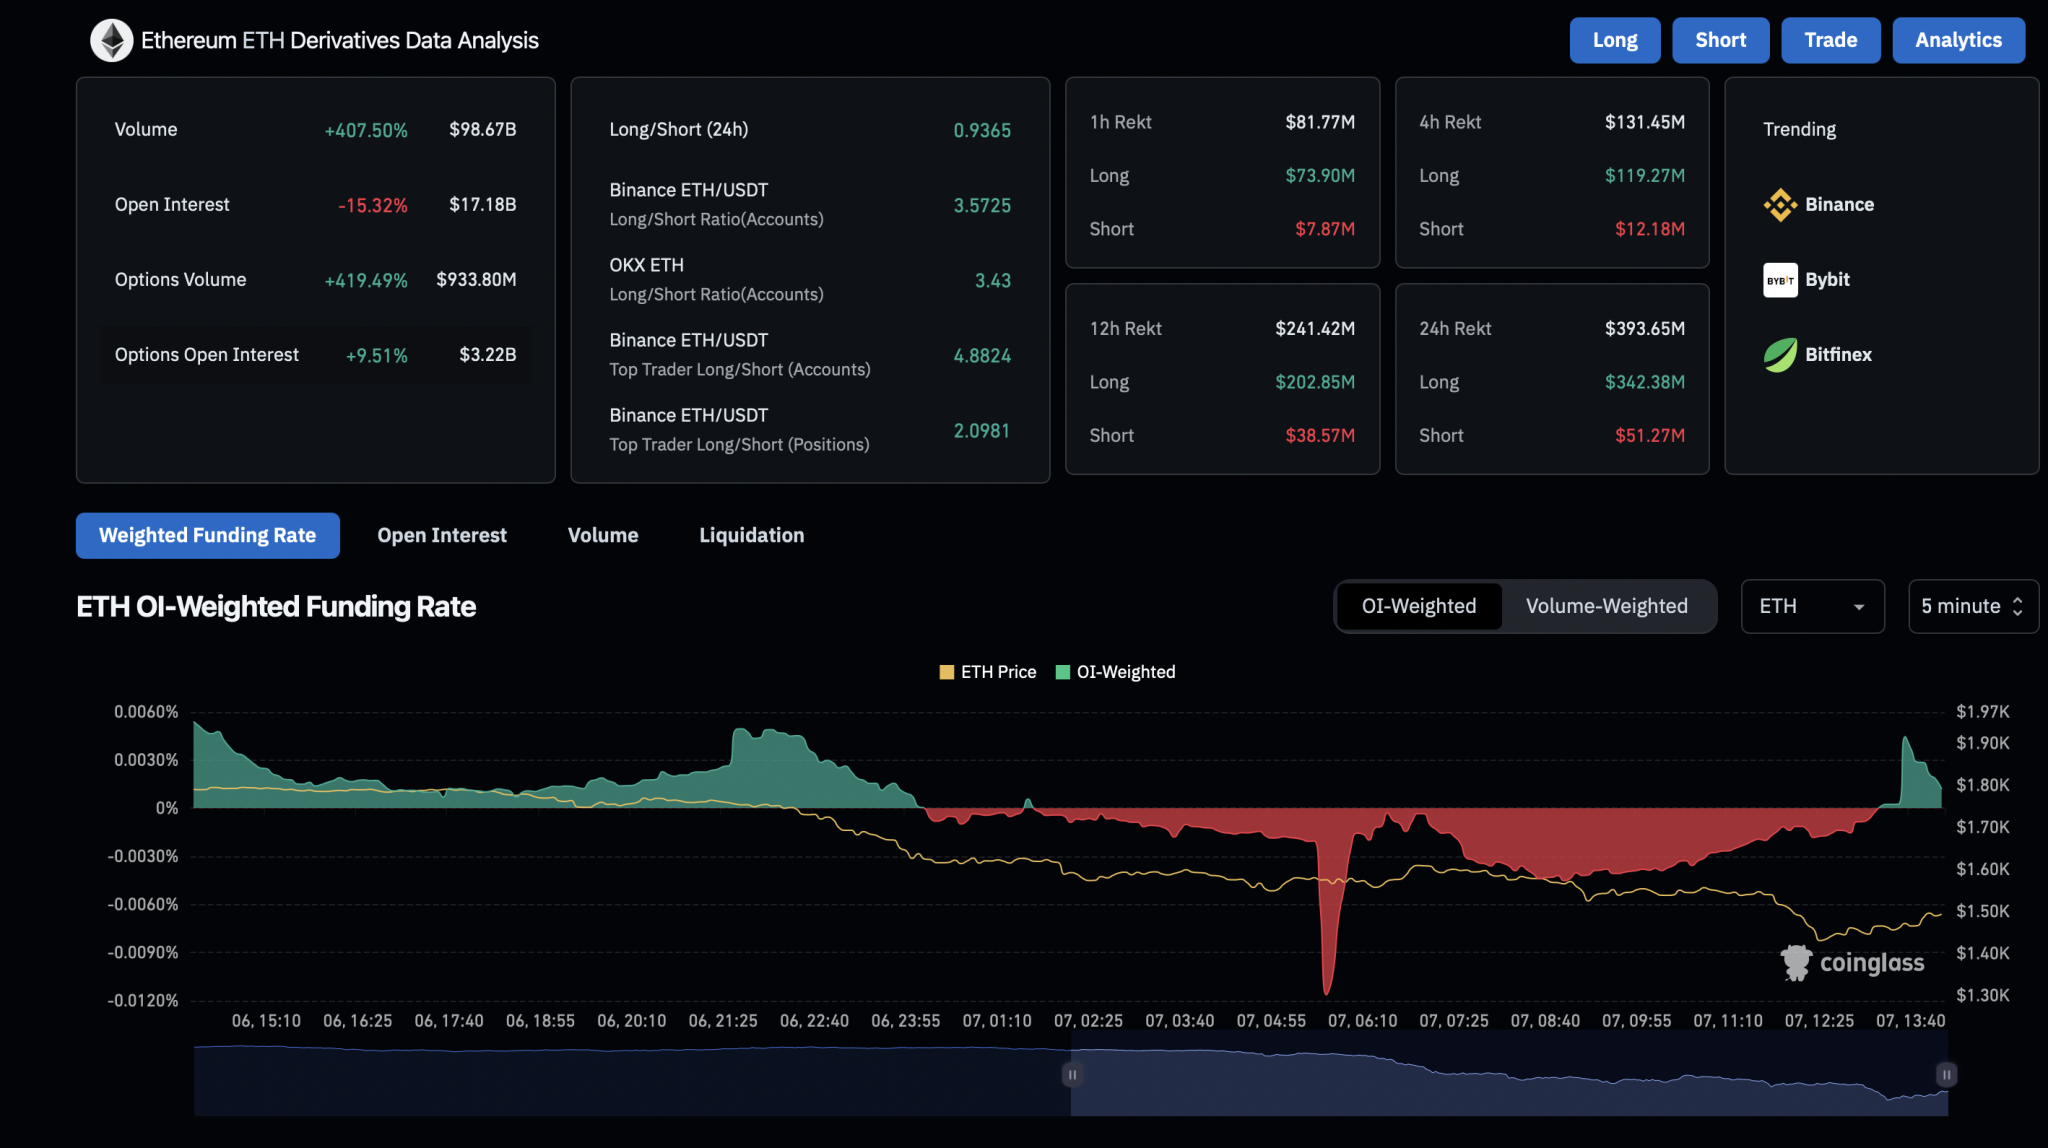
CoinGlass data shows the Ethereum open interest at $1.7 billion. This marks a 15% drop over the past 24 hours, signaling that many traders have been shaken out during the recent correction.

However, the increase in long positions has pushed the funding rate positive, currently at 0.0012%.

Ethereum Derivatives

In light of the bulls’ resurgence in the Ethereum derivatives market, a crypto whale has opened a massive long position on Ethereum. According to a recent tweet by Dami-DeFi, a whale is holding a $47 million long position with 20x leverage on Hyperliquid.

The whale’s entry point was $1,416, and the current market price hovering around $1,500 puts it in a profitable position.

Conclusion

Despite the bearish trend, Ethereum’s short-term recovery shows signs of a potential turnaround with a lower price rejection. The pivot point indicator suggests immediate resistance at the center pivot line, currently at $1,690.

However, should a breakdown occur below the local support trendline, the pivot points indicate that the S3 pivot level, close to the $1,000 psychological mark, will be a critical support level to watch.

Top Software Engineer Says “I Will Never Panic Sell XRP,” Here’s Why

Vincent Van Code, a respected software engineer, explains why he remains confident in XRP despite the ongoing market turmoil.

His insights touch on global economic tensions, crypto resilience, and the long-term vision for the financial world. Notably, this comes amid the latest round of sweeping bearish pressure in the crypto market.

XRP has dropped by over 17% today alone, dipping to $1.76. Similarly, Bitcoin has fallen over 8%, now sitting at $76K. Amid the ongoing panic, Van Code does not see a real reason to join the sellers

No Fundamentals to Support XRP Dump

According to Van Code, aside from the prevailing fear, there are no fundamental reasons to justify a significant drop in XRP’s value. He believes that the market’s recent fluctuations are due to widespread fear, not shifts in the underlying utility or potential of XRP itself.

Furthermore, Van Code credits XRP’s earlier impressive price rise from $0.54 to $3.40 to the optimism for pro-crypto policies with the arrival of a new U.S. administration. He believes this rise was largely a result of the political climate becoming more favorable toward crypto.

According to Van Code, nothing has changed even now, except for the ongoing volatility in traditional markets. Reports suggested last week that the U.S. stock market lost over $6.5 trillion within two days due to the global trade war. The bearish sentiment from these events has spilled over to the crypto market.

Meanwhile, industry commentators like Van Code see this as a temporary shift that does not warrant panic-selling XRP.

He believes the crypto sector has never been stronger, pointing to growing institutional interest and increasing adoption of digital assets. 

Global Economic Reset

The engineer also ties the current market instability to a much larger geopolitical and economic transformation. He believes the U.S. government is waging a covert economic war, destabilizing multiple economies in the process. According to him, this shift is part of a “global financial reset.”

However, he cautions against expecting immediate, dramatic changes, asserting that the reset involves a “tearing down” of existing structures before any rebuilding can occur.

The Road to Recovery for XRP

While some may view the market’s downturn as a cause for panic, Van Code sees it as a strategic move by powerful financial entities. 

He claimed that smart players have already shorted the entire market before the drop. Accordingly, he expects that soon they will cash out and go long again, leading to a “miraculous” market recovery.

The pundit compares the situation to swimming in turbulent waters alongside massive whales. It could be chaotic, but it has the potential for survival and growth once the market stabilizes. 

He teased the arrival of XRP’s potential run, urging investors to hold steady and focus on the long-term picture rather than short-term fluctuations.

Here’s How Much Bitcoin Needs to Drop from Here to Put Strategy’s Bitcoin Portfolio in the Red

0

Strategy’s Bitcoin portfolio risks turning red for the first time in two years as recent market declines push the asset closer to the firm’s average price.

Bitcoin has corrected 20% from its opening price at the start of the year and 31% from its all-time high of $109,312, which it attained on January 20. This massive capitulation has raised skepticism among market participants, especially as the global economy faces uncertainty.

Meanwhile, the crash has triggered massive losses for Bitcoin holders, with others who bought cheaper at risk of facing a similar plight. Among large holders at risk of being in the red is Michael Saylor’s self-acclaimed Bitcoin development firm, Strategy.

Bitcoin’s Capsizes Pushing Towards Strategy’s Breakeven

At some point this year, Strategy (formerly MicroStrategy) was at an unrealized profit of over $13 billion. The firm’s massive bet on Bitcoin, the largest cryptocurrency by market cap, was paying off, receiving accolades from the global community.

Meanwhile, the pioneering cryptocurrency’s price has gone south recently, and Strategy is at risk of nursing unrealized losses on its holding. Interestingly, the Saylor co-founded business intelligence firm’s average Bitcoin cost was $29,803 in April 2023, when its portfolio turned green for the first time since June 2022.

However, the average cost of Strategy’s portfolio has increased to $67,485 due to its incessant purchases and Bitcoin’s blossoming price performance in 2024 and early 2025. Moreover, its stash skyrocketed from nearly 140,000 BTC then to a staggering 528,185 BTC now.

At the time of writing, Bitcoin trades at $75,203, correcting nearly 4% today. With this development, the premier asset needs to further retrace by 10.26% to hit Strategy’s dollar-cost average (DCA) price. A higher capitulation would see the pro-Bitcoin firm nurse unrealized losses on its portfolio for the first time since April 2023.

Reactions Trail Latest Development

Meanwhile, Peter Schiff, a long-standing Bitcoin critic, has reacted to the possible break-even. In a Sunday tweet, he taunted Strategy following Bitcoin’s crash, asking Saylor to go borrowing again for more purchases if he wanted to prevent a capsize below its average price.

Edo Farina, a staunch XRP enthusiast, also highlighted Bitcoin’s trend towards Strategy’s break-even. He noted that the proximity is the thin line between users moving from calling Saylor a visionary executive chairman to receiving backlash over his Bitcoin acquisition strategy.

Nonetheless, Strategy still has an unrealized profit of $3.9 billion, as its stash is currently worth $39.57 billion.

Here’s How Much Was Liquidated From the Bitcoin Market in the Latest Downturn

0

Bitcoin price has recorded a sharp downturn, triggering heightened activity across the derivatives market and millions of dollars in liquidations.

Starting the month above $87,000, Bitcoin dropped to approximately $75,000 by April 7, translating to a 13.5% decline over a two-week span.

This decline follows a significant sell-off wave, coupled with mounting uncertainty linked to macroeconomic developments, including U.S. policy actions and rising interest rates. As of April 7, Bitcoin was trading at $74,818.39, marking a 10.01% drop in 24 hours and 8.60% over the previous seven days.

Plummeting Derivative Activity

Notably, derivatives trading activity responded to the volatility with a sharp increase. Total volume in the derivatives space surged by 162.70%, reaching $165.46 billion. 

Meanwhile, options trading volume rose by 255.77% to $4.92 billion, suggesting a growing interest in hedging and speculative strategies. These changes indicate that traders are positioning for more price movement in the near term.

As trading volumes soared, open interest in Bitcoin futures declined by 5.35%, down to $50.67 billion. Notably, this indicates that market participants are closing existing contracts rather than initiating new positions. Meanwhile, options open interest increased slightly by 4.80% to $23.80 billion.

Long Traders Absorb the Brunt of Liquidations

Amid the latest futures data, marketwide liquidations have intensified. In the last 24 hours, $467.60 million worth of positions were liquidated. Of this amount, $400.98 million were long positions, while $66.62 million were shorts. 

This disparity highlights the significant losses incurred by bullish traders during the steep price decline. Bitcoin position liquidation totals over shorter windows also reflect sustained pressure. Within four hours, $155.18 million was liquidated, and in the 12-hour timeframe, the total reached $282.41 million.

According to Ki Young Ju, CEO of CryptoQuant, current on-chain activity reflects bearish market trends and the end of the Bitcoin bull cycle. Using Realized Cap data, which estimates actual capital entering the market, Young Ju noted that capital inflows remain steady. 

However, the falling Market Cap suggests this capital is not moving prices upward. Realized Cap shows actual purchase behavior through wallet activity, while Market Cap reflects how market prices react to trading volume. When Realized Cap grows without corresponding Market Cap increases, it signals increased sell pressure.

Notably, Ju pointed out that this divergence aligns with historic bear market behavior, where even large capital inflows fail to move prices.

Expert Says Short XRP Now, Thank Me Later

0

Analysts spot bearish signals for XRP as it breaks through critical support levels, urging traders to short XRP now and thank them later.

XRP is undergoing a significant downturn, declining from approximately $2.15 to $1.78. In particular, the digital asset has recorded a 16.62% drop within the last 24 hours. This steep correction was accompanied by a sharp increase in trading volume, suggesting intensified selling pressure in the market. 

Despite the recent losses, XRP remains up more than 199% year-over-year, reflecting the long-term impact of its Q4 2024 rally. However, the current environment indicates a shift in momentum, with technical and sentiment indicators pointing to increased bearish pressure in the short term.

“Short XRP Now”

In a tweet, market analyst Cole Garner drew attention to XRP’s LONG to SHORT ratio on Bitfinex. The chart, displayed on a 5-minute timeframe, revealed a dramatic shift in trader positioning.

The ratio initially surged from 9.5 to nearly 16, indicating a strong rise in long positions and suggesting growing bullish sentiment among traders expecting further upside.

However, at its peak, the ratio abruptly dropped to around 14, hinting at mass long liquidations or a sudden influx of short positions.

Garner’s chart further showed a continued decline to 7.2329 points — a steep 46.86% drop. In response, he called on market participants to short XRP and “thank him later”.

Bulls Must Reclaim the $2.20 Level

Meanwhile, analyst Jesse Colombo noted XRP’s decisive break below a long-standing support zone between $2.00 and $2.20. According to Colombo, the breakdown completes a Head and Shoulders pattern that had developed from mid-December through March.

The neckline break in early April confirmed the pattern’s bearish structure. Technical projections now place XRP’s next support target around $0.60, signaling a potential retracement of its entire Q4 2024 advance. Colombo stated that bulls must reclaim the $2.20 level to invalidate the breakdown.

$XRP is officially breaking below its support zone.

Context to Ongoing XRP Dip

In a broader context, analyst Vincent Van Code pointed to macro-level disruptions as contributing factors behind the XRP correction. Van Code noted that the overall market downturn stems not from asset-specific fundamentals but from larger economic shifts.

As a result, he urged XRP investors not to join the ongoing panic to liquidate their holdings, as he sees this development as manipulation by the dip pockets. 

Have Korean Traders Turned Bearish on XRP? Massive Sell Activity Seen on XRP/KRW Pair on Upbit, but There’s a Catch

0

Analysis shows massive selling pressure on the XRP/KRW trading pair on Korean exchange Upbit in the last three days, but demand walls are beginning to build strongly.

XRP dropped below $2 on Sunday to prices last seen in November amid a broader market capitulation. These massive downsides have come as a ripple effect from strong macroeconomic headwinds, specifically from President Donald Trump’s recent tariff brandishing.

Massive Sell-Offs Seen on Upbit

Meanwhile, another possible contribution to this price capitulation is the large sell orders that Korea’s largest exchange Upbit has filled in the last three days. An April 6 analysis from order flow and volume expert Dom highlighted that the Koreans may have flipped bearish with the enormous sell orders persistently filled on the XRP/KRW trading pair since Thursday.

For perspective, the commentary shows that 56.4% of all the trade orders submitted on Upbit in the last three days have all been sell orders, culminating in about 910,000 trades. Furthermore, this selling pressure has resulted in over 50 million XRP net sales on the pair since Thursday last, clearly indicating a bearish trader bias.

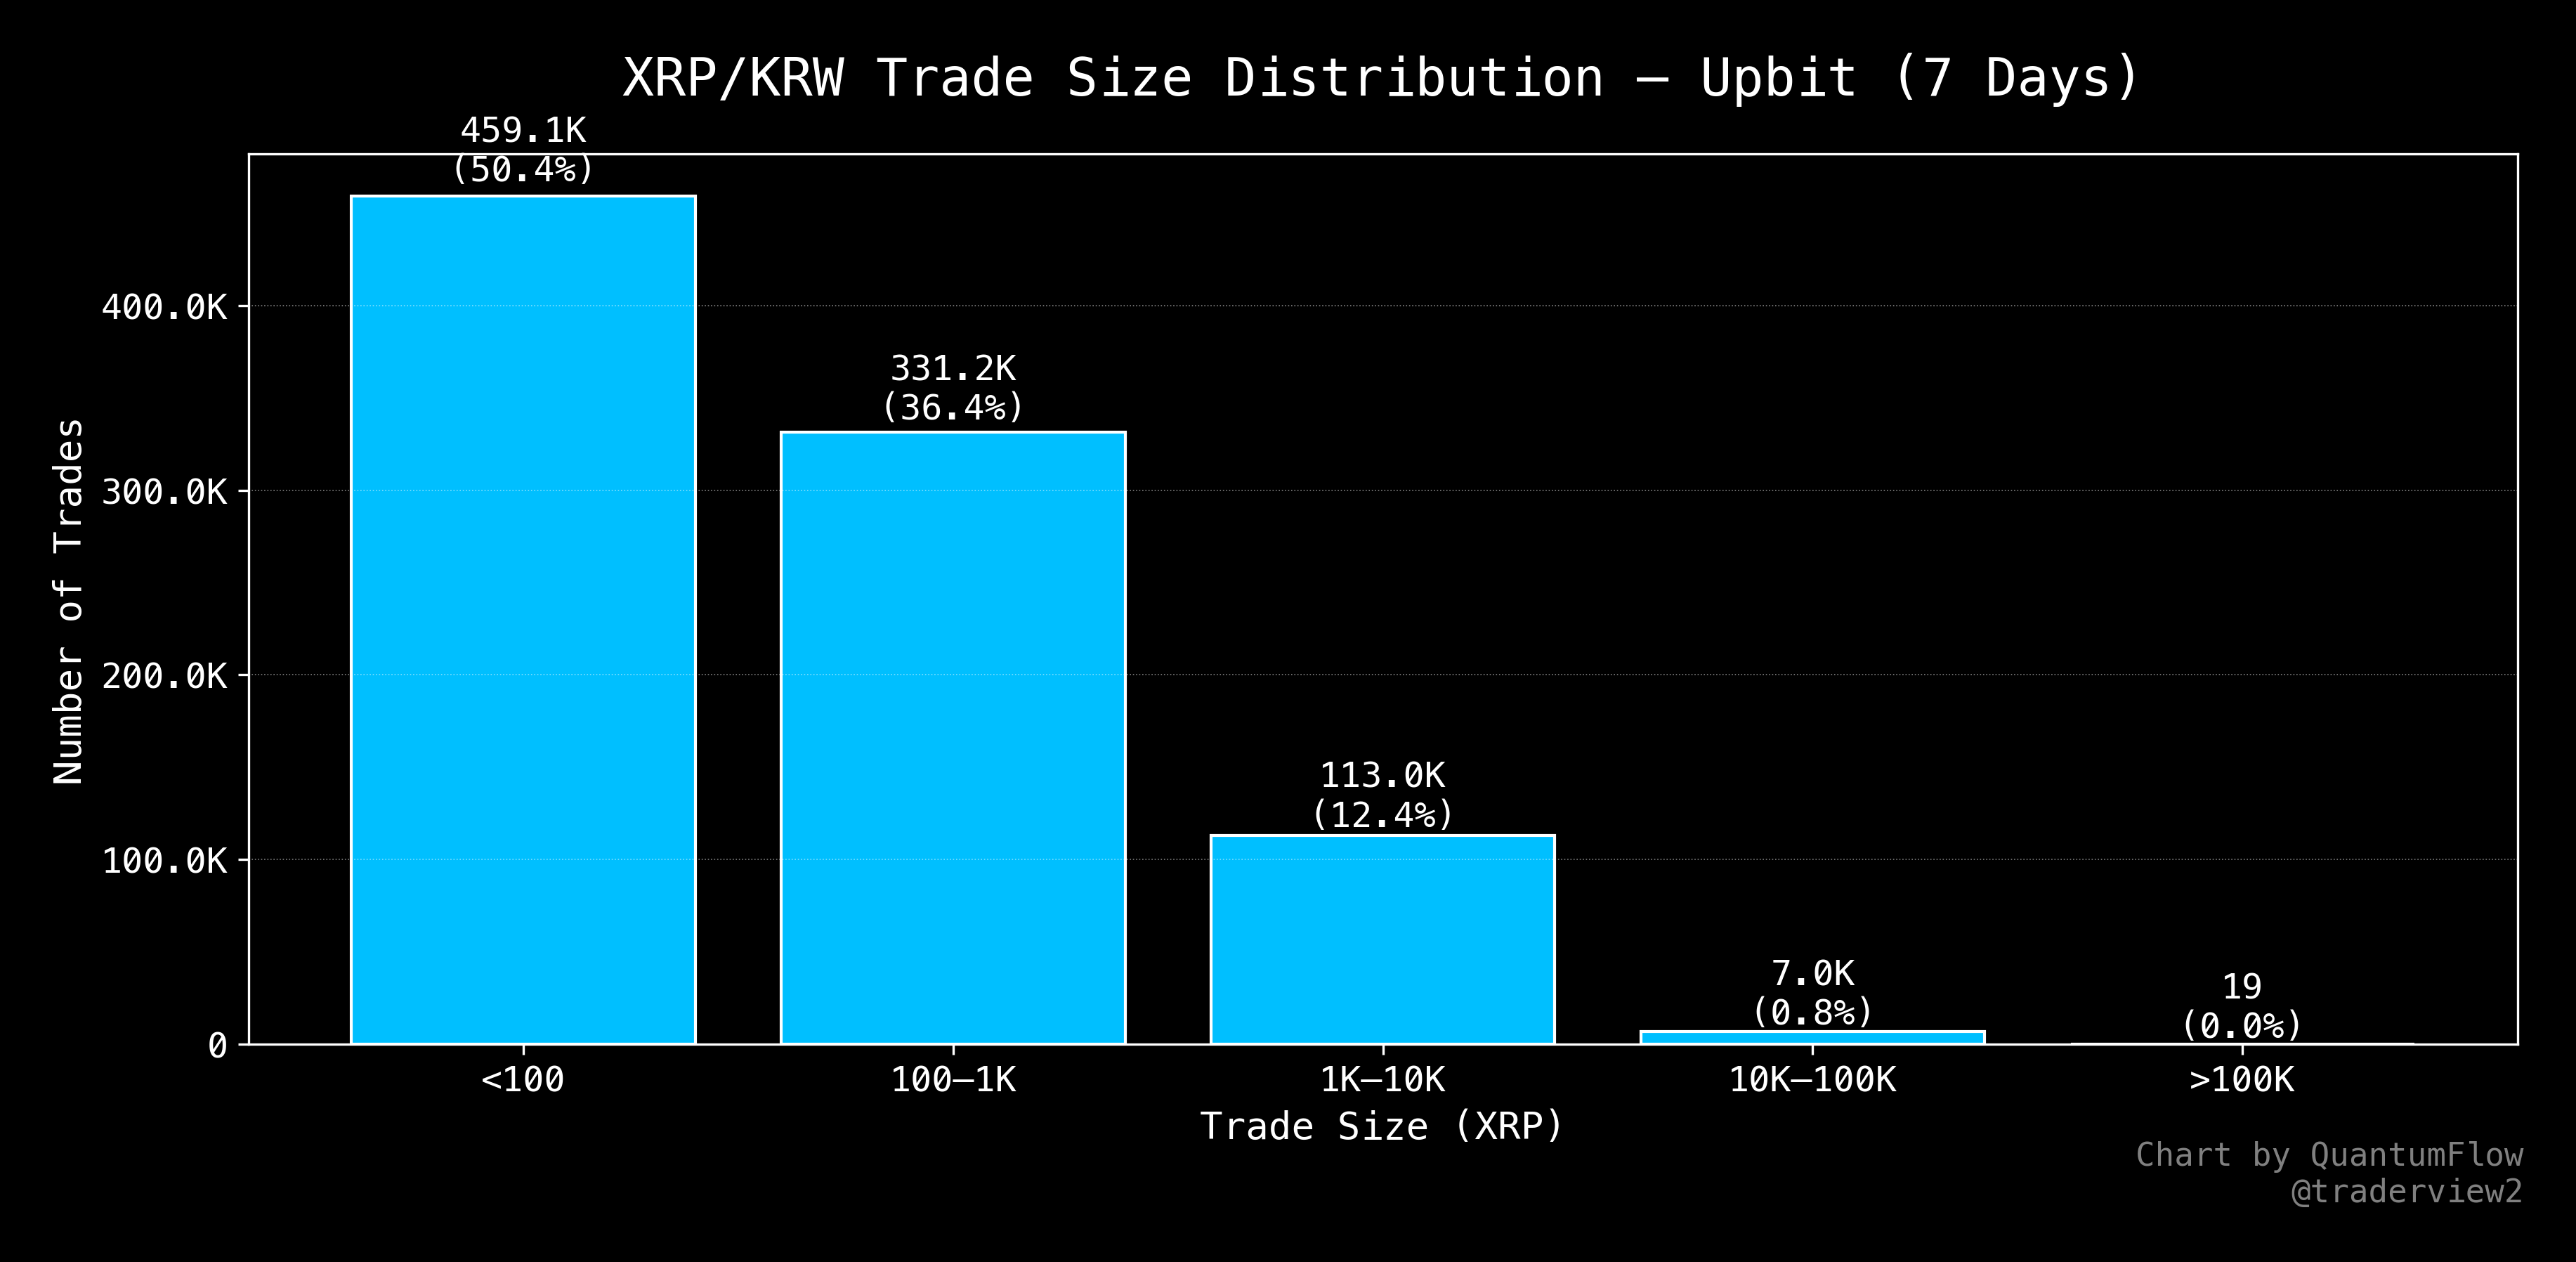
Further exposition indicates that Korean traders sold another 25 million XRP yesterday as sell orders continue to mount. Remarkably, most of these activities have come from traders liquidating between 1,000 and 10,000 XRP. This category of holders has been glaringly close to their sell button and is responsible for about 331,200 trade orders (36.4%) dumping XRP in the past week.

Meanwhile, 50.4% of all trade others have come from retail traders FUDing over the present market uncertainties. They have placed 459,100 trade orders in the past seven days, playing an integral part in the massive selling activity from the Korean trading platform.

Nonetheless, high-caliber XRP whales have remained largely unperturbed. A mere 19 trades came with over 100,000 XRP sales, and 7,000 between 10,000 and 100,000 XRP. This indicates that large holders are still bullishly keen on their bags.

XRP/KRW Trade Distribution

Buy Orders Building Amid Dump Below $2

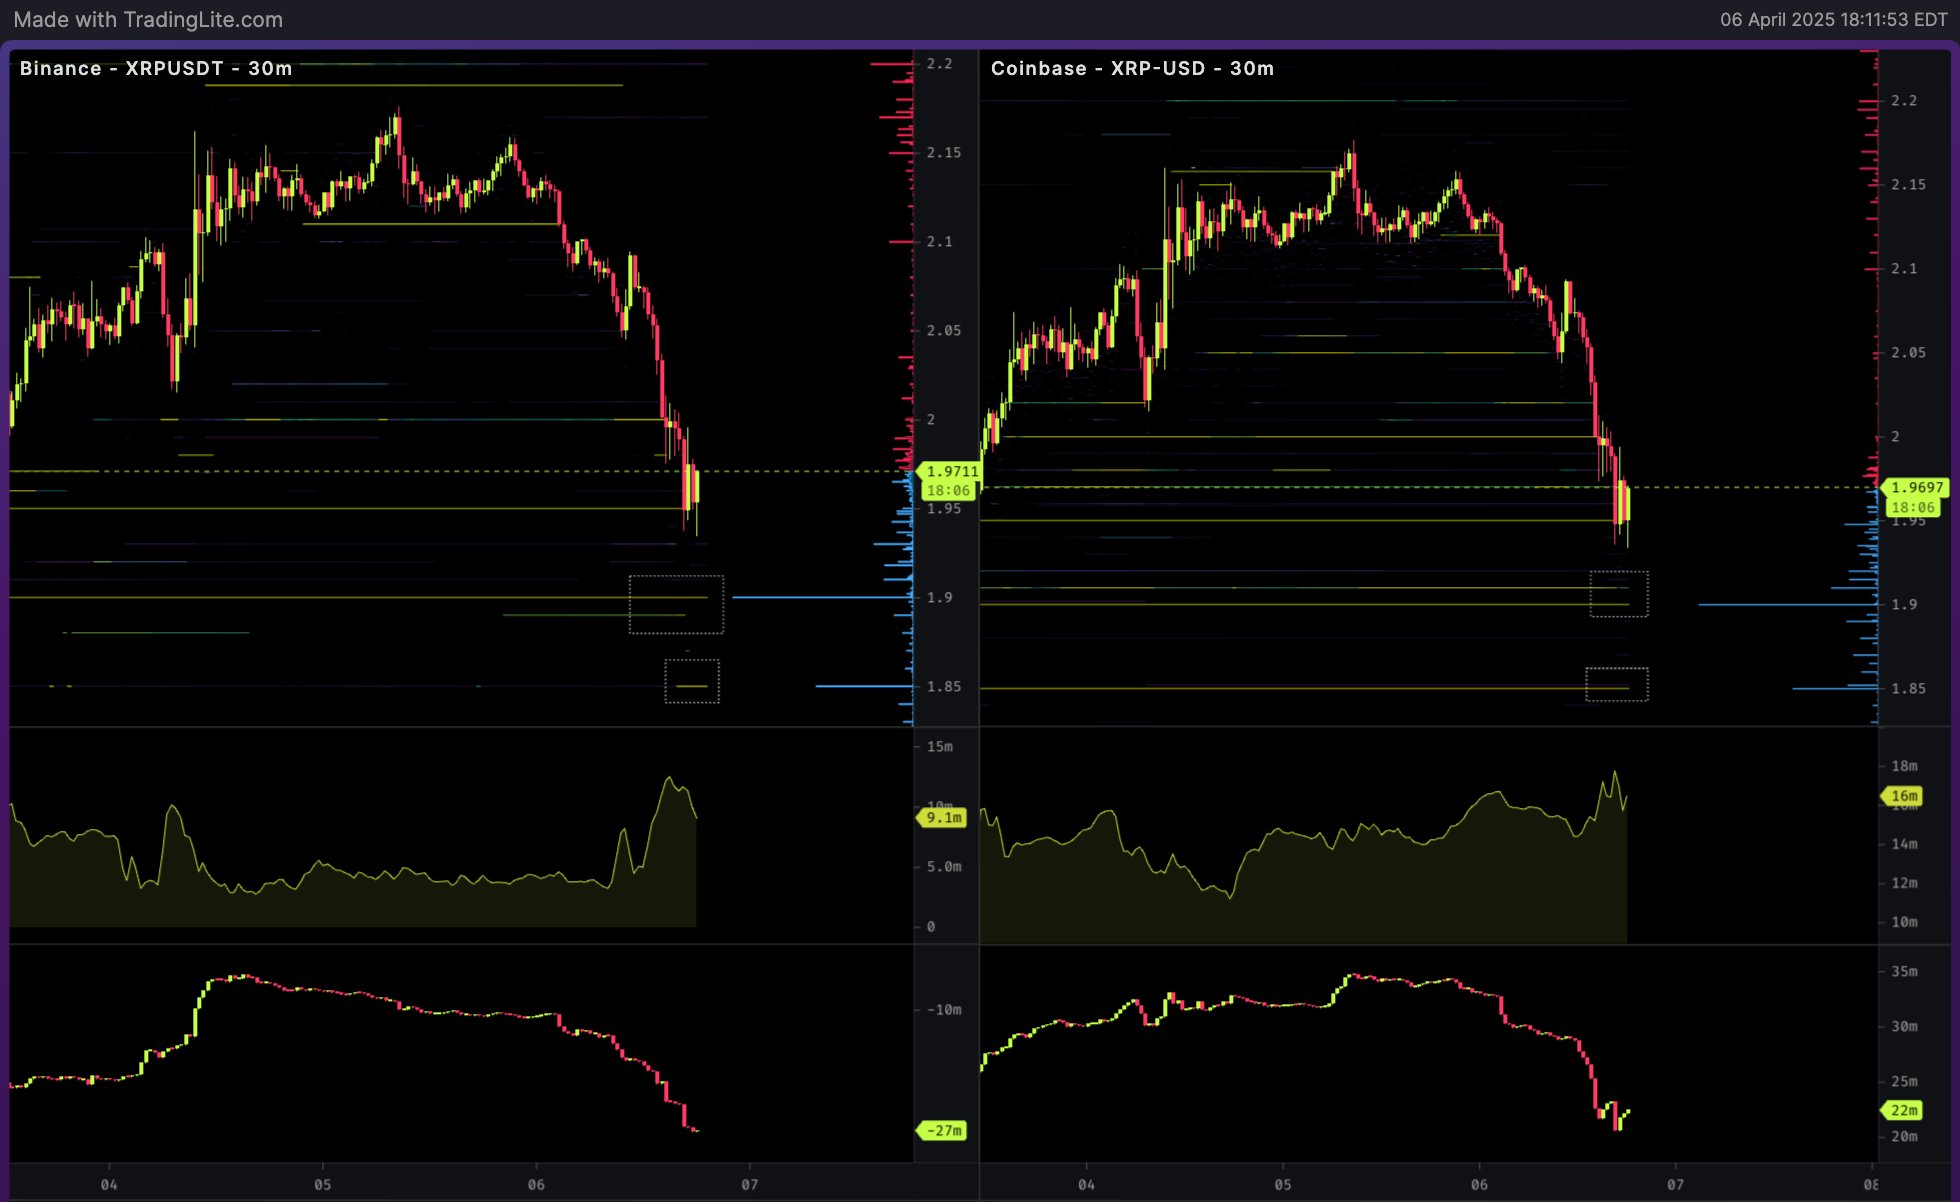
While earlier analyses have termed a drop below $2 as a bearish event and predicted targets like $1.27 and $1.07, massive buy blocks forming sub-$2 could buffer such capitulation. Dom noted in a parallel analysis that enthusiasts are keen on buying XRP, especially at $1.90 and $1.85.

He highlighted an enormous buy wall between those areas on two prominent crypto exchanges, Binance and Coinbase. Notably, buyers lined up strong bid orders at every five cents of XRP’s price, from near $2 down to $1.50. This suggests that it is not all “air” below $2, as these massive bids could steer a rebound.

Bid Order Concentration on Binance and Coinbase

In the meantime, XRP trades at $1.6966, down 11% since the start of today.

Bitcoin Breaks Under $75K as Global Market Fear Intensifies: Will $70K Hold?

Bitcoin slides under $75K amid rising global market fears, with whales shorting and key support levels in danger. Is a move to $70K next?

As a ripple effect of a crash in global markets, fear in the crypto market is reaching an extreme state. The total crypto market cap has dropped to $2.34 trillion, witnessing an 11% decline over the last seven days.

Amid the increasing fear, Bitcoin is down to $74,636, trading at a market price last seen on November 9. As the market declines, is a breakdown towards $70,000 possible?

Bitcoin Falls Under $75K, EMAs Near Death Cross

In the daily chart, Bitcoin’s price trend shows another failure to overcome the local resistance trendline. This has resulted in a 6.19% drop in Bitcoin’s price on Sunday, marking the lowest closing price of $78,342 since early November.

Bitcoin Price Chart
Bitcoin Price Chart

Extending the bearish correction, Bitcoin has registered an intraday drop of 2.9%, trading near the $74,000 mark. This sudden turnaround follows Donald Trump’s decision to impose significant reciprocal tariffs on multiple countries globally.

The 50% Fibonacci level at $75,538 coincides with the demand zone, extending from $75,600 to $75,462. This marks a crucial support zone for Bitcoin. As Bitcoin’s falling price signals a critical support level breakdown, downside potential continues to grow.

Notably, technical indicators are flashing sell signals amid the increasing bearish pressure. The MACD and signal lines show a negative crossover and a resurgence of bearish histograms.

Additionally, the 50- and 200-day EMA lines show a downturn, suggesting a possible death cross on the daily chart.

Bearish Sentiment Drives Up Short Positions by Whales

Amid the possibility of a steeper correction, DarkFost, a crypto on-chain analyst, highlights the increasing bearish sentiment among crypto whales. According to the analyst, whales are more inclined to set short Bitcoin positions than retail investors.

The Whale vs. Retail Ratio is close to 0.15, a relatively low value that indicates growing bearish sentiment among crypto whales.

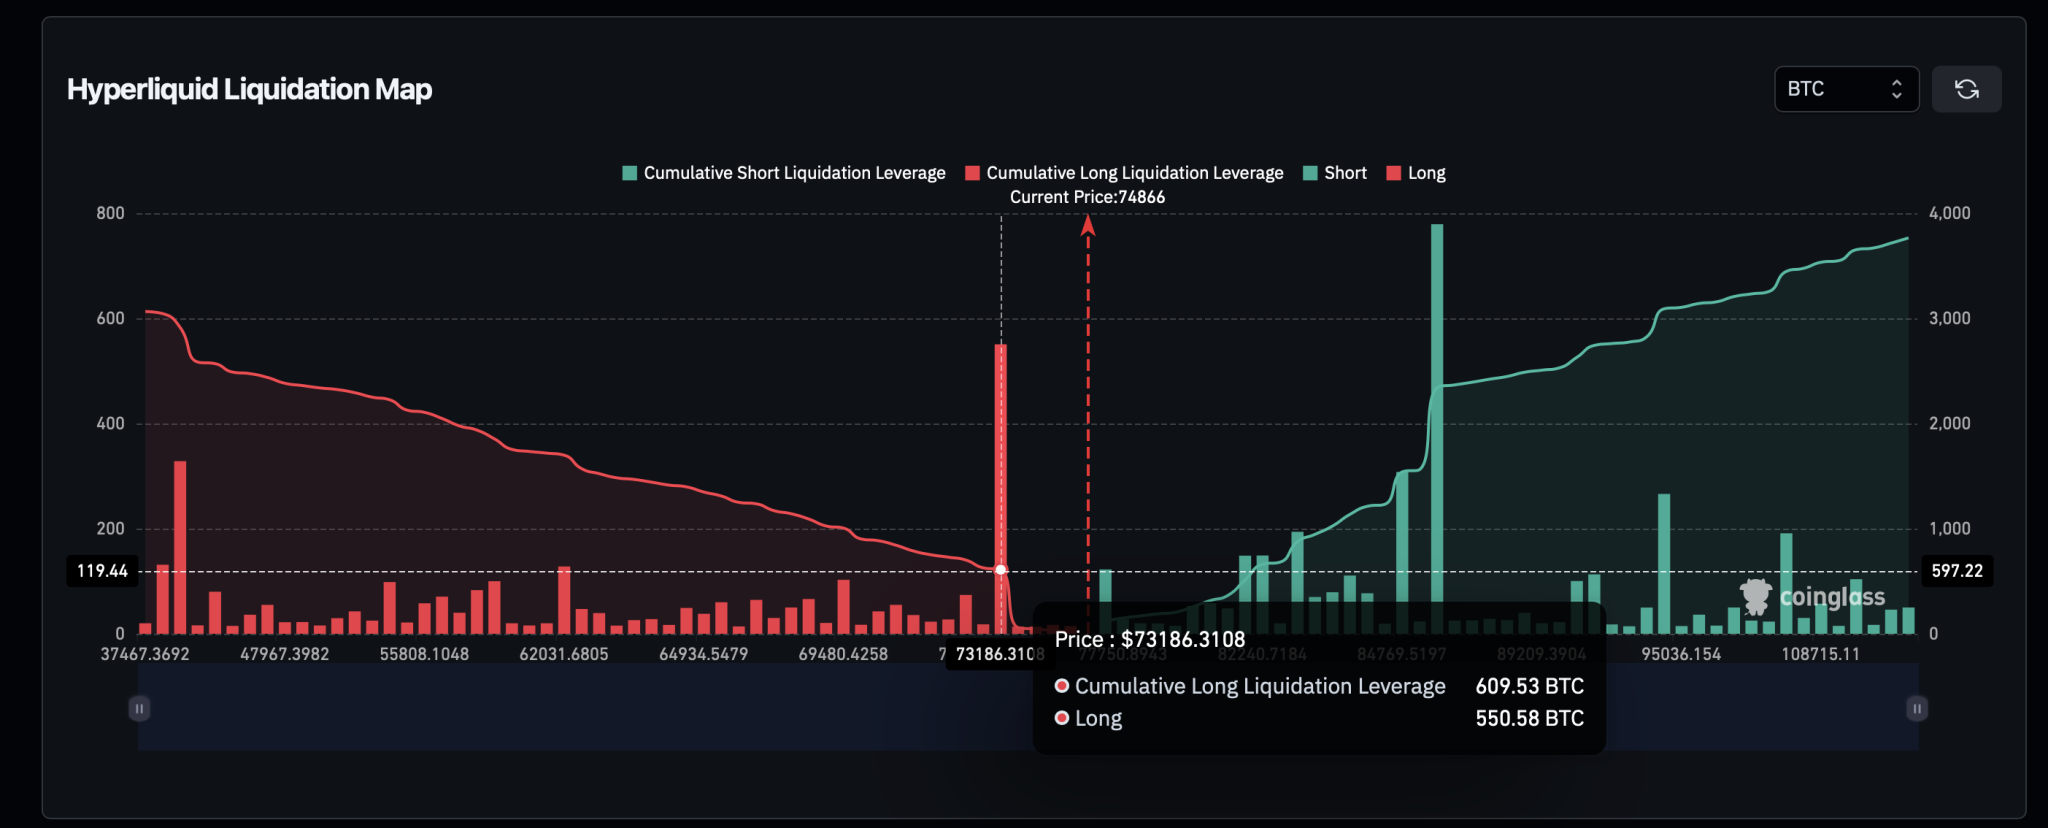
Furthermore, as the market turns bearish, the Liquidation Map warns of a major long liquidation move. Based on the HyperLiquid liquidation map, a drop to $73,187 would result in the liquidation of 609.53 BTC. Out of the total cumulative long liquidation leverage, long positions account for 550.58 BTC.

Liquidation Map

Meanwhile, Bitcoin’s open interest stands at $52.30 billion, witnessing a minor drop of 2.32%. However, the volume has increased by nearly 138%, reaching $149.95 billion.

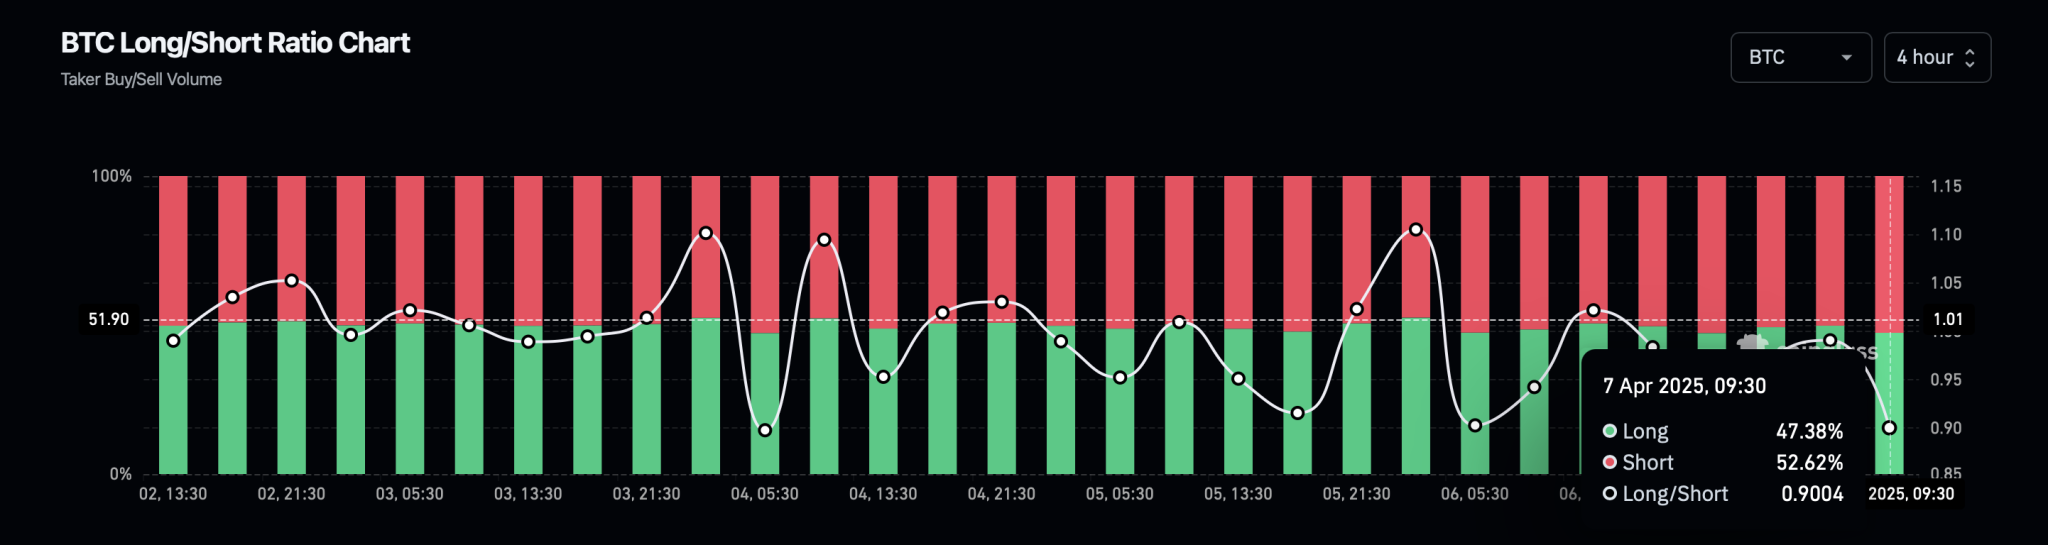
Furthermore, the Bitcoin Long/Short Ratio chart shows an increasing number of short positions over the past four hours. Short positions account for 52.62%, dropping the Long to Short Ratio to 0.9004.

Bitcoin Long/Short Ratio Chart

Will Bitcoin Drop $70K?

As Bitcoin breaks below the $75,000 mark, a decline below the 50% Fibonacci level is likely. This would place the immediate price target at $69,699, corresponding to the 38.20% Fibonacci level.

On the other hand, a price rejection and a short-term relief rally could help Bitcoin avoid closing below the 50% Fibonacci level. This would increase the possibility of a new upswing to challenge the overhead resistance trendline if global markets witness a bounce back.

However, the week will likely witness increased volatility due to several major events, including the release of Industrial Sector Index data, JOLTs Job Openings data, Service Sector Index data, Non-Farm Payrolls, and the Employment Rate.

Bitcoin Slumps 7% Against Taiwan Dollar as Taiwan’s Largest Company Sees Biggest Drop in History

0

Bitcoin slumps against the Taiwan Dollar as Taiwan’s largest public company sees biggest crash in history amid President Trump’s tariff announcement.

Bitcoin faced sharp selling pressure on April 7, tumbling 7.8% against the Taiwan dollar and marking a one-month low. Notably, the slump comes amid a broader global market meltdown triggered by President Donald Trump’s sweeping tariff announcement, which triggered fears of a global trade war. 

Bitcoin Crashes Against Taiwan Dollar Alongside TSMC

The impact spread through Taiwan, where the nation’s stock market suffered its most severe single-day drop on record, according to a report from the Central News Agency Taiwan. Leading the carnage was Taiwan Semiconductor Manufacturing Company (TSMC), the country’s most valuable publicly traded firm, which experienced its steepest plunge in history.

TSMC, which accounts for more than a third of the market capitalization of the Taiwan stock exchange, opened 94 TWD lower and instantly hit the limit-down price of 848 TWD. This represented a nearly 10% drop from the previous close, wiping out over 2.4 trillion TWD in market value in a matter of minutes. 

Since its January peak of 1,160 TWD, TSMC’s stock has now fallen by 26.9%, with over 8 trillion TWD in value erased. The steep decline pushed the company, and the broader tech-heavy market, firmly into bear territory.

Meanwhile, Bitcoin, which has continued to correlate with traditional financial markets during bearish climates, mirrored the global risk-off sentiment after showing initial resilience last week. 

Over a 48-hour span beginning April 5, BTC experienced successive declines against the Taiwan dollar, culminating in this morning’s 1.89% dip to 2.55 million TWD. Against the U.S. dollar, the asset has dropped 7.3% in the same period, now trading at a one-month low of $76,914. The cumulative losses in April have shaved roughly $110 billion off Bitcoin’s market cap.

Surprisingly, even traditional safe-haven assets like gold have failed to act as effective hedges amid the current turmoil. The precious metal is down 2.65% in April, as investors retreat from risk exposure across the board.

Taiwan Stock Market Crash

Meanwhile, within Taiwan, the global crash did not only impact TSMC. Specifically, the Taiwan stock market opened after the Qingming Festival to a storm of panic selling, diving more than 2,000 points in early trading and falling below the psychologically important 20,000-point threshold. 

The weighted index nosedived nearly 9.7%, dropping to 19,212 points and setting new records for both intraday point decline and percentage fall. Over a thousand stocks hit their lower trading limits shortly after the market opened, including major blue-chip names and top technology firms.

Other major electronics firms mirrored TSMC’s plunge. Foxconn and MediaTek also hit their daily limit-down prices at market open. Further, AI-focused companies like Quanta and Wistron suffered similar declines.

Besides Taiwan, the fallout extended across Asia and the Middle East. Japan’s Nikkei Index tumbled more than 2,500 points at the open, while Hong Kong’s market dropped over 2,000 points. Chinese indexes saw dramatic losses, with the Shanghai Composite Index falling 6% and the Shenzhen market nearly 8% lower. 

Saudi Arabia experienced its largest single-day drop in five years, plunging almost 7%. In South Korea, losses exceeded 5%, triggering a halt in programmatic trading. Notably, U.S. Stocks also extended their losses, with the NASDAQ collapsing 6% on Friday.

Expert Says, ‘Tired of Buying the XRP Dip?’—Shares What to Expect Next After Trump-Led Market Bloodbath

0

A market pundit has shared what to expect next from XRP following the broader market bloodbath triggered by Donald Trump’s tariff decision.

The global financial markets have collapsed into chaos following President Donald Trump’s sweeping announcement of retaliatory tariffs on nearly every country across the globe. 

The fallout has triggered a massive sell-off across both traditional stock and crypto markets. This has wiped out trillions in value, dragging major crypto assets, including Bitcoin and XRP, into a steep decline.

XRP Drops Amid Market Chaos

According to Oscar Ramos, a prominent crypto analyst and market commentator, the U.S. stock market alone lost an astonishing $1.65 trillion at the opening bell. 

In his latest video commentary, Ramos tackled the situation head-on, focusing on XRP’s situation amid the turmoil and what investors should brace for in the days ahead.

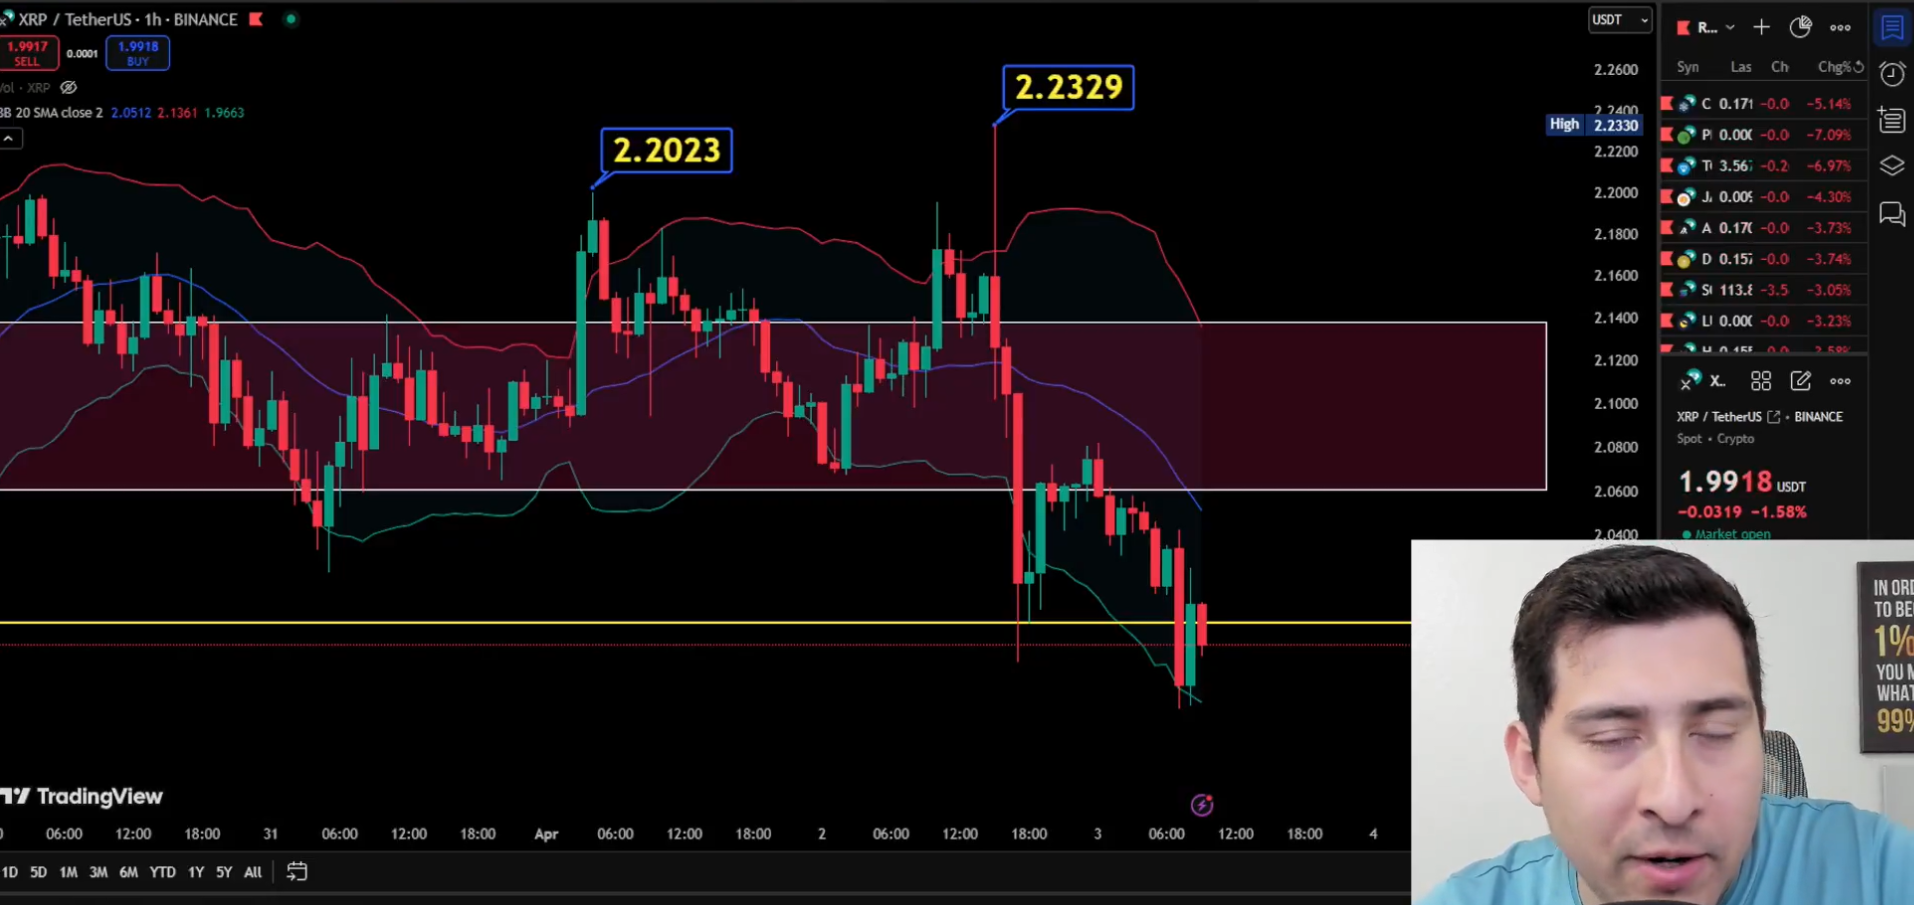
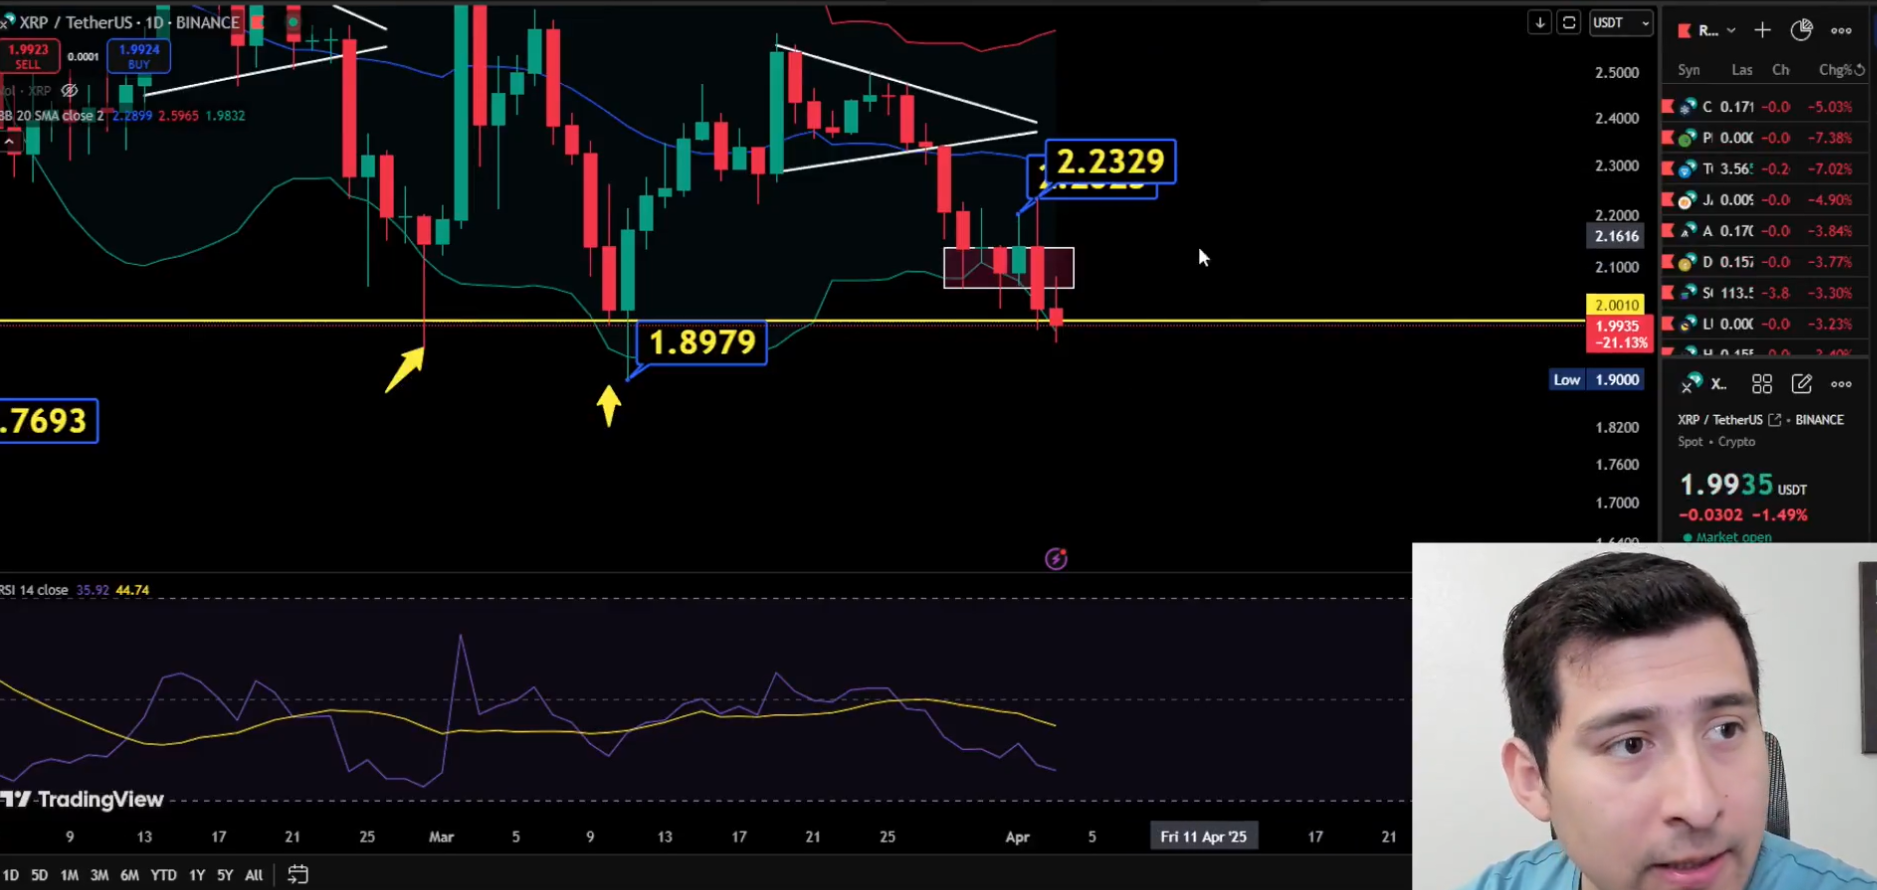
At the time Ramos addressed his audience, XRP had dropped to $1.99, a massive decline from its recent $2.23 high. The drop coincided with Trump’s tariff speech delivered from the Rose Garden. Ramos pointed out the precise timing of the fall, suggesting it was a direct market response to geopolitical pressure.

XRP 1h Chart Oscar Ramos
XRP 1h Chart | Oscar Ramos

However, despite the apparent bloodbath, Ramos encouraged viewers to stay calm and look for opportunity. “Are you tired of winning? It’s too good, man,” he said, opening the discussion with some humor.

Massive Liquidations 

Throughout the video, Ramos noted the volatility impacting XRP, Bitcoin and other altcoins. He noted that Bitcoin had recently hit $88,000, only to retreat quickly to $81,000, triggering massive liquidations. 

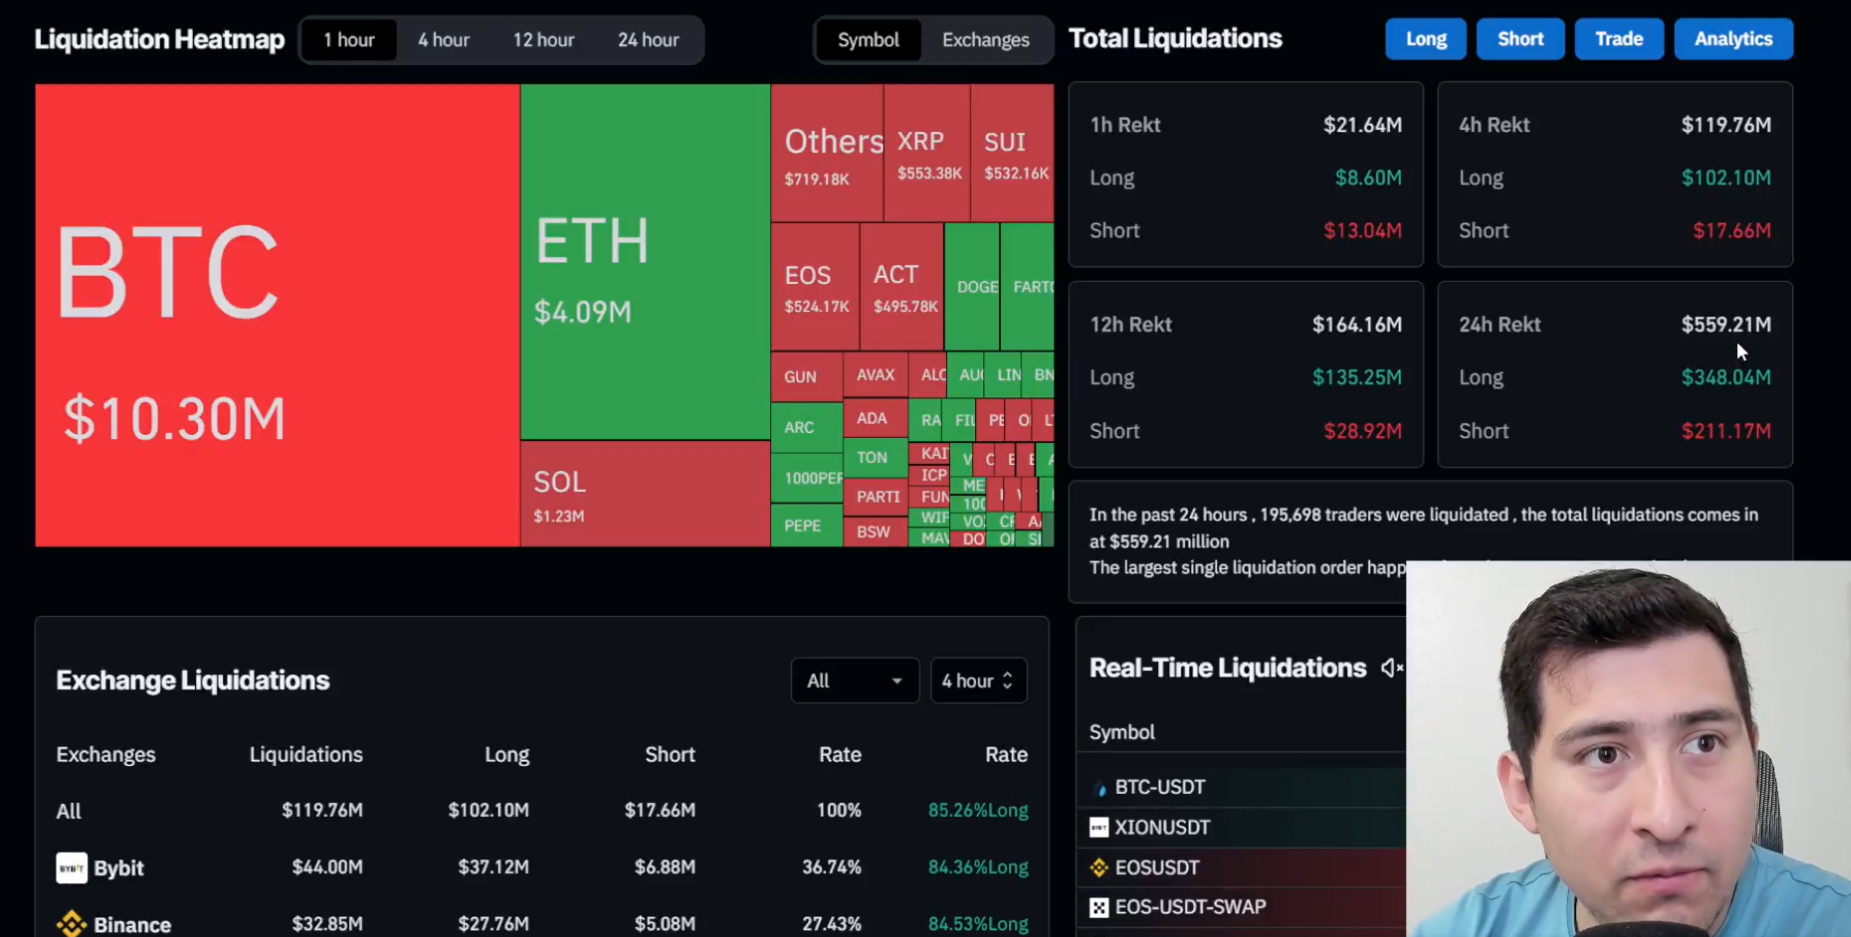
In the past 24 hours alone, the market saw $348 million in long positions and $211 million in short positions liquidated, totaling over $550 million. Meanwhile, XRP-specific liquidations included $15 million in longs and $6 million in shorts.

Crypto Liquidations
Crypto Liquidations

What to Expect Next from XRP

Ramos also called attention to support levels that suggest XRP might be approaching a major bottom. He noted that similar price patterns occurred around $1.90, $1.80, and even $1.70 earlier in the year, particularly during tariff developments involving Canada, Mexico, and China. 

Now, with the current drop now involving over 100 countries, the scale of the market reaction could be more severe. Nonetheless, the market analyst highlighted that XRP’s trajectory appears to be entering an important phase. 

Specifically, Ramos pointed out the formation of a bearish technical pattern known as the “Three Black Crows” on the daily chart, indicating the possibility of continued downward pressure. 

He used the Relative Strength Index (RSI) to confirm that XRP has still not definitively entered an oversold region on the daily timeframe. According to him, the last time this happened was in July 2024. For XRP to revisit the oversold zone, further decline to around $1.50 to $1.60 could occur.

XRP Daily RSI Oscar Ramos
XRP Daily RSI | Oscar Ramos

However, Ramos doesn’t view the current price action as all doom and gloom. He emphasized that XRP staying near the $2 mark rather than plunging deeper is already a minor victory. “Just the fact that we are at this level and not $1.8 per se, that’s a major win,” he stated.

Looking ahead, Ramos predicts choppy waters for the crypto market, a sentiment from Crypto.com CEO Kris Marszalek. He believes the ongoing uncertainty will test investor patience but also open doors for accumulation. 

A Mild Recovery 

The market commentator revealed that his current trading strategy involves accumulating Bitcoin, aiming to own a full BTC, while holding off on new XRP positions until clearer signals emerge. 

Further, Ramos discussed the recent launch of Ripple USD (RLUSD) on Kraken, calling it a positive development amid the chaos. However, he remained clear that macroeconomic shocks are dominating current market movements rather than isolated crypto developments.