Home Blog Page 823

Dogecoin in Critical Decision Zone with Major Target at $0.455: Analyst

0

An analyst has observed the price of Dogecoin in a critical decision zone, with upward targets reaching $0.455.

Bicoinmoney, an analyst on TradingView, recently shared an in-depth technical analysis, noting that Dogecoin, currently trading at $0.1631, is forming a descending triangle pattern. Typically, this pattern signals a bearish continuation if broken to the downside. 

Currently, Dogecoin is testing a key horizontal support zone around $0.164–$0.18, a historically significant accumulation area. However, the formation of lower highs suggests that sellers remain in control.

Dogecoin Decision Zone | TradingView

Dogecoin Technical Indicators

On the technical front, the Ichimoku Cloud analysis reveals that the price is below the cloud, with both the Tenkan and Kijun lines pointing downward, reinforcing a bearish trend. No signs of a bullish reversal have emerged from this indicator.

The Relative Strength Index (RSI) is also at 32.98, approaching the oversold zone. While this suggests a bounce may be possible, no substantial divergence has been observed between the RSI and its moving average.

Furthermore, the Wave Trend Oscillator is deep in the oversold zone around -50, showing slight upward movement, which could signal a short-term bounce. The Moving Average Convergence Divergence histogram, though shrinking on the negative side, indicates that the bearish trend is weakening.

However, the MACD has not yet crossed above the signal line, so traders should wait for further confirmation. Bicoinmoney also notes that the Cluster Algo indicators are not showing strong bullish signals, though the compressing lines suggest a potential breakout in the near future.

Key Support and Targets for Dogecoin Price

According to the analyst, the critical support level for Dogecoin is $0.164. If this level fails to hold, the price could fall to the previous lows of $0.11–$0.12. On the upside, immediate resistance is between $0.20 and $0.21, with further targets at $0.28 and $0.455. 

Dogecoin would need to surge by approximately 179% to reach a price of $0.455 from its current price of $0.1631.

DOGE at a Make-or-Break Level

Meanwhile, analyst Martinez stresses that Dogecoin is at a “make-or-break” level, emphasizing that the price must hold above this critical support for an uptrend to continue. Martinez suggests that if Dogecoin can maintain its position above $0.16, it could rally toward the $0.57 resistance level. 

However, if support at $0.16 fails, Dogecoin may significantly decline, potentially reaching lows of $0.06.

A separate analyst on TradingView points to a bullish divergence on Dogecoin’s chart. The price has been posing higher lows while the RSI shows a downward trend.

This discrepancy suggests a potential reversal or rally, though no specific price target has been provided. The analyst urges traders to focus on the technical indicators rather than being swayed by news.
Is XRP a Dead Coin, Prominent angel Investor Responds

Prominent angel investor Armando Pantoja recently commented on the popular claim within the crypto community from critics labeling XRP as a “dead coin.”

The market commentator disagrees with this categorization. According to him, the claim is devoid of logic, as XRP remains the fourth-biggest crypto asset in the market. He stressed that a “dead coin” obviously cannot have a $112.8 billion market cap and rank just behind Ethereum and Bitcoin.

XRP Stands Strong Over Ten Years and Counting

Drawing from his over a decade of experience in the crypto industry, Pantoja pointed out that the crypto assets making the top ranks today are entirely different from those of the past. In particular, some crypto assets that once ranked in the top 100 by market cap have now faded into oblivion.

Indeed, historical data from CoinMarketCap confirms that tokens like BitShares (BTS), Dash, NXT, Paycoin (XPY), and MAID were among the top ten precisely ten years ago, in March 2015.

However, these coins have now been completely relegated to the back seat. Meanwhile, during this time, XRP was even the second biggest crypto, behind Bitcoin only. Ten years later, XRP continues to defend its position among the most prominent crypto assets.

Top ten crypto ten years ago with XRP

Pantoja cited this data to emphasize that the argument labeling XRP as “dead” is wholly misplaced and lacks sincerity. In his words:

“People don’t realize that all these other coins—hundreds, even thousands of coins—that were supposed to be great projects are gone now. XRP has held on, and that shows it’s not a dead coin. This is what we call success bias.”

He argued that supporters of such negative views are driven by a sense of rivalry. Pantoja stressed that commentators often fail to recognize all the failures and focus only on the successful projects. As a result, they’d look at XRP and assert, “Well, these other coins are more successful, so XRP is a failure.”

For Every Few Coins That Outperform XRP, 10,000 Others Failed

In terms of price performance, Pantoja argued that out of the three or four coins that may have done better than XRP over the years, there are at least 10,000 coins that have failed completely.

He used this argument to dismiss the critical views concerning XRP’s failure to establish a new all-time high in seven years. At press time, XRP trades at $2.03, down 47.1% from its 2018 peak of $3.83.

Shiba Inu Set for a 143% Surge? Technical Signals Suggest Rally to $0.00003036

0

An analytical insight has highlighted several indicators that suggest Shiba Inu could rebound extensively from recent lows to December highs.

Shiba Inu, the second-largest meme coin by market cap, has shown bullish momentum as the crypto market finally puts the tariff madness behind it. The token rebounded from yesterday’s low of $0.00001182 to post a mild 1.47% gain, continuing with the momentum today.

Shiba Inu followed a similar path last week, rallying over 20% to a high of $0.00001567 before relinquishing all its gains. An analysis highlighted that this was a fake-out, and market participants are now observing the recent trends to confirm it is not another false momentum.

Nonetheless, a TradingView analysis from pseudonymous analyst “Bicoinmoney” has suggested that this trend may be sustainable. The Thursday commentary cited several bullish indicators that could spur a revisit of December’s price highs.

Technical Indications of an Imminent Rally

First, the pseudonymous market watcher noted that Shiba Inu is trending within a descending wedge in the 3-day timeframe, which has diffused any substantial rally since December’s high of $0.00003343. Meanwhile, the meme coin trades close to the channel’s tip and not far off from a crucial support between $0.00001150 and $0.00001200.

Then, “Bicoinmoney” highlighted several technical indicators aligning in SHIB’s favor. For context, he noted that Shiba Inu’s relative strength index stands at 34.17, close to the oversold territory at 30 and below. Also, the RSI and the token’s price form a bullish divergence, a precursor for a rebound.

Furthermore, the Moving Average Convergence Divergence (MACD) indicator is flashing a buy signal. An accompanying chart shows that the MACD line is close to crossing the signal line, which is another bullish confirmation.

Shiba Inu Breakout
Shiba Inu Breakout

WTO and Cluster Algo Indicators Confirm SHIB Accumulation

Meanwhile, the wave trend oscillator (WTO) shows buying pressure, confirming a potential bounce. The WT line is curving upwards, and a green histogram is forming, signaling a possible crossover and trend reversal.

The Cluster Algo also confirms this positive momentum, with its main line moving upwards from the lower band. A green dot under the indicator line further indicates an accumulation pattern among Shiba Inu traders.

However, the Ichimoku Cloud suggests that bearish momentum still exists. SHIB’s trend below the Kumo Cloud shows an overall negative price trend. However, the cloud is thinning out, and further accumulation would change the narrative.

Analyst Shares Target and Possible Retracement Levels

Meanwhile, the analyst shared that a breakout from the channel would spur a rally to $0.00003036, representing a 143% surge from the current market price. Notably, the level lies above January’s high of $0.00002497 but just below December’s peak of $0.00003343.

Furthermore, the commentary highlighted the possible retracement levels in this upward push. It emphasized that the first resistance lies at the 0.718 Fibonacci level at $0.00001503, just above the descending channel.

Notably, the market watcher noted that Shiba Inu could possibly bounce from the level but noted that significant tests lie ahead. He pinpointed the 0.618 and 0.5 Fibonacci levels at $0.00002153 and $0.00002609 as major resistances, insisting a break above them could ensure the meme coin attains its target.

In the meantime, Shiba Inu trades at $0.00001241.

Cardano Whales Sell off 120M ADA in Two Days Amid Price Drop

0

On-chain data confirms the withdrawal of 120 million Cardano from the 1 million to 10 million ADA range, possibly contributing to recent declines.

Cardano (ADA) has faced notable price fluctuations in the past week, reflected in the broader market. Starting at $0.70 on March 29th, ADA saw substantial volatility, coinciding with President Donald Trump’s reciprocal tariffs.

The price dropped to $0.61 by April 3 before rebounding to $0.66 the next day. At the time of this report, ADA changes hands at $0.6607, marking a 1.45% increase in the last 24 hours but a 5.92% drop over the past week.

Whale Activity Driving Cardano Price Decline?

The fluctuations in ADA’s price align with significant sell-offs by whales, according to data shared by market analyst Ali Martinez. Whales, or large holders, reportedly sold approximately 120 million ADA coins in the 48-hour period preceding his post. 

This likely contributed to the recent downtrend in Cardano’s price, as the number of ADA coins held by addresses with balances between 1 million and 10 million ADA has dropped from 5.84 billion to 5.71 billion.

Further analysis by IntoTheBlock also provides confirmation insights into these ownership trends. The platform divides Cardano’s ownership into three key categories based on time held: Hodlers (1+ years), Cruisers (1-12 months), and Traders (<1 month). 

Notably, hodlers saw a minor decrease of 0.22%, while Cruisers experienced a significant 6.77% increase. 

Cardano Addresses IntoTheBlock
Cardano Addresses | IntoTheBlock

However, Traders saw a sharp drop of 16.36%. This shift suggests that while long-term holders remain relatively steady, short-term traders are increasingly leaving the market. Additional data show whale concentration has decreased by 1.68%, now accounting for 8.48% of the total ADA supply, while retail investors hold a majority of 71.17%.

Institutional Inflows Indicate Continued Interest

Despite these price fluctuations, institutional investors continue to show strong interest in Cardano. According to CoinShares, ADA experienced $0.6 million in inflows into exchange-traded products (ETPs) for the week ending March 31, contributing to a total of $63.3 million in March. This brings the total institutional inflows for 2025 to $70 million. 

As of the most recent data, the total assets under management in Cardano-focused ETPs stood at $121.2 million. This steady institutional investment contrasts with the increased volatility in retail investment and suggests that institutional confidence in ADA remains intact.

Strong Future for Cardano Despite Withdrawals

Despite the ongoing price challenges, analysts are still bullish on Cardano’s future. Millionaire analyst Alex Becker, who had previously been skeptical of ADA, now predicts significant price surges for the asset. 

In a recent YouTube commentary, Becker shared a list of eight coins he believes will experience 15x growth by 2026, with Cardano being one of them. He highlighted ADA’s “fast as hell” network and its status as one of the most decentralized blockchains next to Ethereum as key factors that will drive its future success.

Becker also outlined an optimistic price target for Cardano, predicting it could rise to between $3 and $5.

Cardano Warns of $0.50 Dip as Whales Dump 120M ADA

Cardano tests short-term recovery but faces resistance and a whale sell-off. Can ADA avoid a drop below $0.5346?

Amid a sudden spike in crypto market volatility, Cardano struggles to stay above $0.60. With the breakdown of a consolidation range, the market anticipates a steep correction.

Currently, Cardano is trading at $0.6612, with an intraday recovery of 1.63%. Will the short-term recovery prevent a price plunge to $0.50?

Cardano Price Analysis

On the daily chart, Cardano’s price trend shows a recent breakdown of the consolidation range. The bearish breakdown occurred with a 5.48% drop on April 2, triggering a selling opportunity.

Cardano Price Chart
Cardano Price Chart

However, despite the global economic uncertainty, ADA’s price trend has seen a minor rebound, creating the possibility of a morning star pattern. Cardano formed two consecutive bullish candles, but following the range breakdown, this short-term recovery may only be a retest.

The retest struggles to overcome the 38.20% Fibonacci level, which coincides with the lower range of the consolidation pattern. Due to the prevailing downtrend, the increased bearish pressure warns of a death cross between the 50-day and 200-day exponential moving averages. This could trigger a trend reversal and a selling opportunity.

The relative strength index (RSI) has dropped below the halfway mark, supporting the likelihood of a deeper correction. This indicates weakening bullish momentum and increasing the chances of a post-retest decline.

Cardano Price Targets

As technical indicators suggest a potential crash in Cardano prices, the Fibonacci levels provide price targets. Based on the current price trend, the range breakdown is likely to test the 23.60% level at $0.5346, which suggests a downside potential of more than 18%.

Further declines could test the long-standing descending support trendline, potentially targeting the $0.50 psychological level.

On a bullish trend, recovery above the 38.20% level could lead to testing the 50% Fibonacci level at $0.7746. Notably, the 100-day EMA aligns with the 50% level, making it a crucial resistance point for Cardano.

Whales Dump ADA

Crypto analyst Ali Martinez highlights a significant drop in whale confidence for Cardano. In his recent tweet, Martinez reports that whales have sold off 120 million ADA in the past 48 hours. This has reduced whale holdings to 5.71 billion ADA, down from a peak of 5.87 billion.

Image

Here is Shiba Inu Price If SHIB Reclaims Top 10 Position in Global Crypto Ranking

0

Shiba Inu could experience a significant price surge if SHIB breaks into the top 10 cryptocurrencies by market capitalization. 

The broader crypto market has remained bearish over the past few weeks, making it difficult for top assets like Shiba Inu (SHIB) to experience significant upward movement. 

Bearish Price Action in 2025

For context, Shiba Inu’s price action has been bearish for most of the year. Since February 1, it has traded below the $0.00002 price mark. While many analysts predicted an immediate rebound, SHIB slumped further, crashing below $0.000011 on March 11. 

It has recovered slightly, currently changing hands at $0.00001238. Shiba Inu ranks as the 17th-biggest cryptocurrency on CoinMarketCap, boasting a market cap of $7.29 billion. Nonetheless, the Shiba Inu community is abuzz with speculation over SHIB’s potential price surge if it ascends to the top 10 cryptocurrencies by market cap. 

Shiba Inu Road to Top 10

Breaking into the top 10 ranking is not a new feat for SHIB. The canine-themed token first achieved this feat in 2021 when it recorded its historic surge to an all-time high of $0.00008845. 

Shiba Inu reclaimed the milestone last year when its price surged above $0.00004500. However, it has dropped tremendously from this level, falling to position 17 on the global ranking of crypto assets. 

For Shiba Inu to reclaim a spot in the top 10 cryptocurrencies by market cap, it must overtake tokens such as SUI, AVAX, XLM, LINK, LEO, TON, and TRON. At the moment, TRON ranks as the 10th-biggest crypto, with its valuation standing at $22.58 billion. 

Therefore, breaking into the top 10 requires SHIB’s market cap to grow to at least $22.59 billion, flipping TRON from this position, assuming the latter’s valuation remains at $22.58 billion. Hitting this valuation would demand SHIB’s market cap to increase 209.88% from the current value of $7.29 billion. 

SHIB Price If It Re-enters Top 10 

Achieving this milestone will translate into a substantial price jump for SHIB. If Shiba Inu breaks into the top 10 with its market cap soaring to $22.59 billion, SHIB’s price would be $0.00003833 per token. 

This represents a jump of over 2X from Shiba Inu’s current price of $0.00001238. The last time SHIB traded around $0.000038 was on March 6, 2024, a day after it soared to a multi-year peak of around $0.000045. 

Projections to $0.000038

Meanwhile, several projections of SHIB’s spike to $0.000038, including those from prominent analysts like Jonathan Carter and MMBTtrader, have failed to materialize. It has been over a year, and Shiba Inu has not revisited the $0.000038 price territory. 

Despite SHIB’s continued downtrend, recent predictions from Changelly show that analysts at the company expect Shiba Inu to hit the $0.000038 target by December 2026, over a year from now. 

Meanwhile, Telegaon envisions Shiba Inu surpassing $0.00003833 this year, with the platform setting a maximum target of $0.0000728. 

Ethereum Holds $1,800 Zone: Is a Rally to $2,839 in Sight?

Ethereum nears a trendline breakout rally as whales accumulate while derivative markets show rising optimism.

As Bitcoin returns with a bullish turnaround, Ethereum holds its crucial demand zone near $1,800 despite increased global market volatility. With the sudden resurgence of bullish sentiment, Ethereum is close to breaking above a local resistance trendline. Will this propel the ETH price above the $2,000 psychological mark?

Ethereum Nears Trendline Breakout, Targets $2,000

On the daily chart, Ethereum is trapped within a falling channel pattern. Holding its ground at the $1,800 supply zone, Ethereum is making multiple low-price rejection candles.

Ethereum price chart

The quick turnaround from a low of $1,750 has resulted in several long-tail candles. This reflects the bullish struggle to maintain the $1,800 mark.

Currently, Ethereum is trading at $1,826, with an intraday recovery of 0.55%. This marks an extension to the 1.21% recovery from the previous night.

With two consecutive positive candles, Ethereum hints at a potential morning star pattern for a bullish trend reversal. Additionally, Ethereum is close to breaking above the local resistance trendline, signaling further upside potential.

Supporting the bullish case, the daily RSI is slightly above the oversold region, showing an uptick. This indicates a minor surge in bullish momentum, suggesting a possible recovery ahead.

Ethereum Network Slowdown Warns of Bullish Failure

Despite the potential for a bullish breakout rally, Ethereum’s network has experienced a major slowdown in Q1 2025. According to EgyHash on CryptoQuant, active Ethereum addresses have significantly declined, dropping to 333K compared to a peak of nearly 600K in late January.

quicktake-image

Moreover, Ethereum’s burnt fees over the first quarter have dropped to their lowest point ever. Data from CryptoQuant highlights the inflationary pressure post-merge, exacerbated by the declining burn rate after the Dencun upgrade.

As total fees burnt decline, the risk of hyperinflation rises for Ethereum, which could result in a significant price decline.

Whales Buy ETH Dip

Despite the Ethereum network’s underperformance, whales are buying the dip. According to a recent tweet from IntoTheBlock, Ethereum whales, including the largest ETH wallets, have added over 130,000 ETH to their holdings in the past 24 hours.

Additionally, large holders in NetFlow have maintained an overall positive flow over the past seven days, with the exception of an outflow on March 30. As a result, crypto whales remain confident in a potential Ethereum bounce-back despite the network’s underperformance.

Bullish Sentiment Surge in Ethereum Futures

As Ethereum holds its ground at $1,800 with the possibility of a bullish comeback, Ethereum futures are seeing increased trader interest. According to Coinglass, Ethereum’s open interest has increased by 3.56%, reaching $20.63 billion.

Ethereum Derivatives

Furthermore, the funding rate has recently flipped negative at -0.0050%. This indicates that long-term position holders are getting paid to maintain their bullish positions.

Over the past 4 hours, a sudden shift in the funding rate coincided with a surge in long positions. In just 12 hours, the long/short ratio increased from 46.99% to 55.71%, highlighting the growing bullish influence in Ethereum futures and increasing the likelihood of a leverage-driven rally.

ETH Long/Short Ratio Chart

Conclusion

Based on the pivot point indicator, the trendline breakout rally will face immediate resistance at the center pivot line, priced at $2,042.

Optimistically, a breakout from the larger falling channel pattern could drive Ethereum prices to $2,839. On the flip side, the crucial support levels are at $1,737 and $1,549.

Bitcoin Reclaims $83K Amid $2T US Market Wipeout: Is a Rally to $92K Next?

As market fear rises, Bitcoin holds firm above $80K. A triangle pattern and rising futures interest may push the BTC price to $92K.

Following a near $2 trillion wipeout in the U.S. market caused by Donald Trump’s tariff war, Bitcoin has reclaimed $83,000 after a brief plunge. With a short-term bounce back from $81,500 to $83,146, Bitcoin is gradually regaining bullish momentum.

Despite increased market volatility, a symmetrical triangle pattern may determine Bitcoin’s next move. As gold reaches a new all-time high amid uncertain market conditions, will Bitcoin follow suit and break out to a new all-time high?

Bitcoin Bullish Reversal Within Triangle

On the 4-hour price chart, increased price fluctuations have formed a symmetrical triangle pattern. Within this pattern, Bitcoin fluctuates between a price range of $81,595 and $88,357.

Bitcoin Price Chart
Bitcoin Price Chart

Currently, Bitcoin has formed a morning star pattern near the support trendline. This suggests a potential bullish reversal within the triangle, which could test the overhead trendline.

Also, the RSI is gradually recovering and moving above the halfway mark, supporting a bullish comeback. Additionally, the declining trend in the bearish histograms of the MACD indicator hints at a potential bullish crossover.

This could push the MACD and signal lines into the positive zone, signaling a possible bullish reversal within the triangle pattern. Based on the triangle pattern, an uptrend could push Bitcoin above $86,000 to test the overhead trendline.

Bitcoin ETFs Record Outflows Worth Almost $100M Amid Market Fear

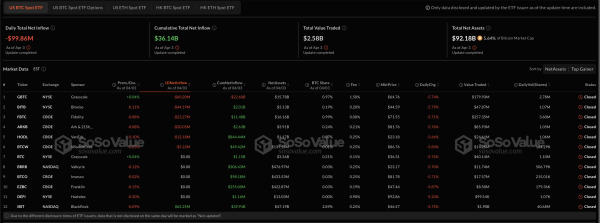
Amid growing fear in the U.S. market, Bitcoin ETFs recorded a net outflow of $99.86 million on April 3. BlackRock was the only institution with an inflow on April 3, amounting to $65.25 million.

Grayscale experienced the highest outflow at $60.20 million, followed by Bitwise at $44.19 million. Fidelity, ARK, and 21Shares recorded outflows of $23.27 million and $20.05 million, respectively. Lastly, VanEck and WisdomTree saw outflows of $12.18 million and $5.22 million.

In total, six Bitcoin ETFs experienced outflows, while five others recorded zero flows.

Bitcoin ETFs
Bitcoin ETFs

Bitcoin Futures Signal Potential Short-Squeeze Rally

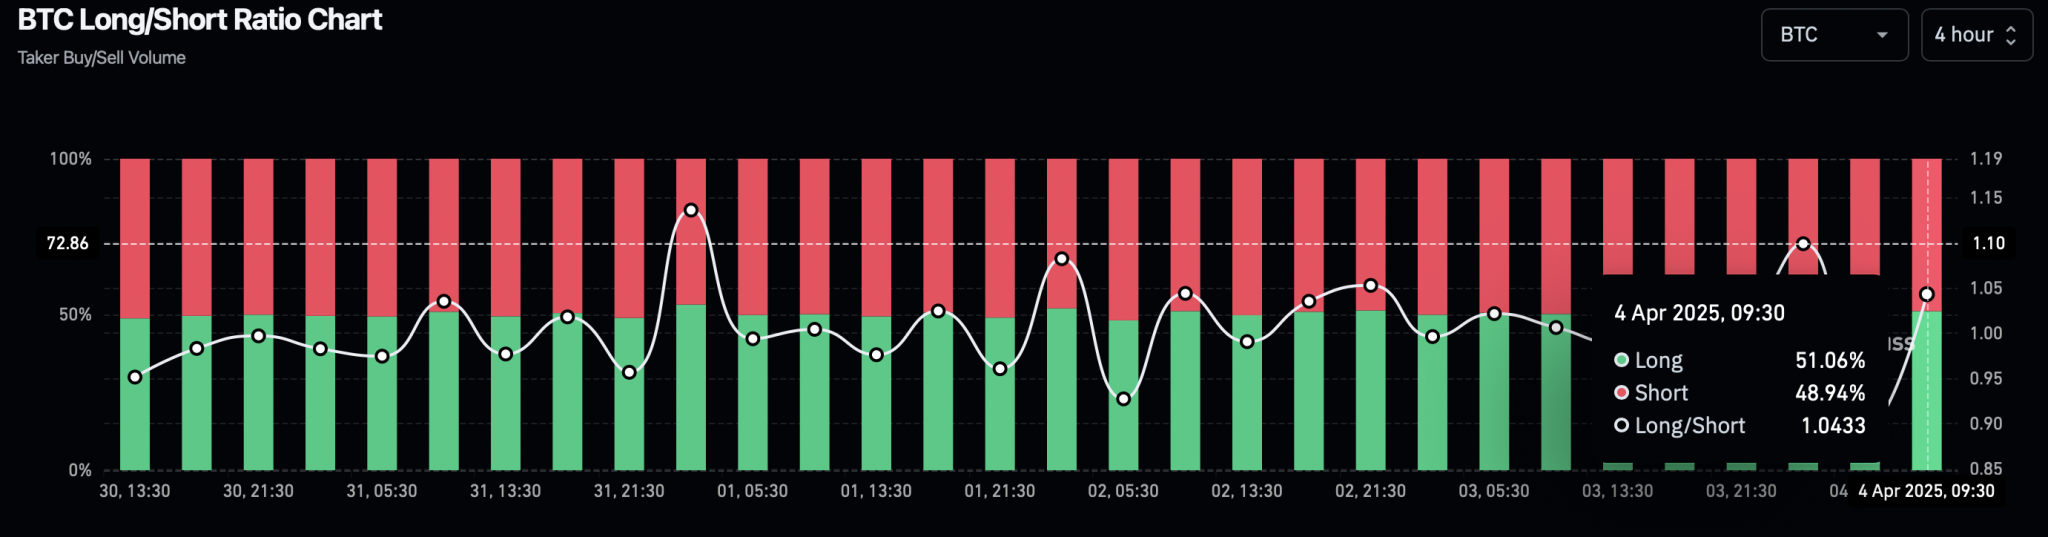
Over the past 4 hours, long positions in Bitcoin futures have surged significantly as BTC reverses direction. According to the BTC long-to-short ratio chart, long positions increased from 47.18% to 51.06%.

This shift has boosted the long-to-short ratio from 0.8932 to 1.0433. Additionally, the Bitcoin futures market saw a minor influx of traders, driving open interest up by 0.75% to $52.43 billion.

BTC Long/Short Ratio Chart

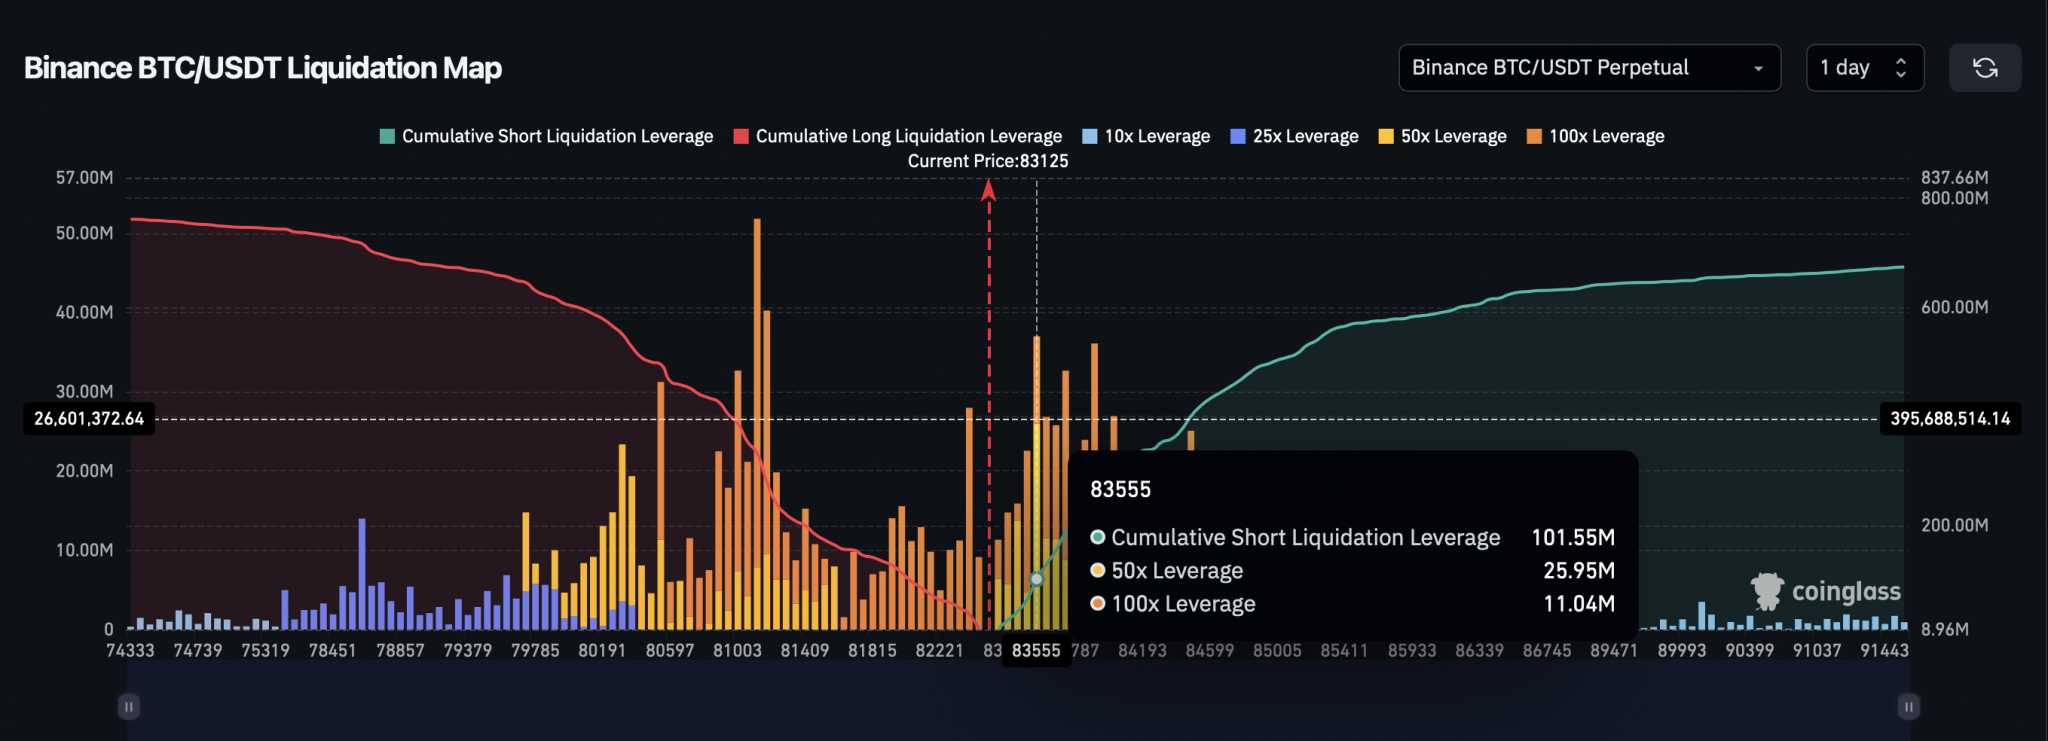
With bullish sentiment building in the derivatives market, the funding rate is 0.0055%. According to the Binance BTC-USDT liquidation heatmap, a positive recovery surpassing $83,555 could trigger a massive liquidation of $101.55 million.

Bitcoin Liquidation Heatmap

This could result in forced liquidations of 50x leveraged positions worth $25.95 million and 100x leveraged positions worth $11.04 million. Notably, this has the potential to initiate a short-squeeze rally with over-leveraged short positions.

Based on the liquidation heatmap, the next target price of $83,903 could see a cumulative short liquidation leverage of $262.39 million.

Is a Rally Possible to $92K?

Despite rising anticipation of a bullish recovery, the market has seen a return of old Bitcoins. According to crypto analyst Ali Martinez, long-term holders moved over 1,058 BTC yesterday.

This suggests profit-taking by long-term holders (those with holdings of 7 to 10 years), contributing to the recent increase in supply. As a result, in the event of a sharper correction, BTC prices may break below the symmetrical triangle pattern.

Based on price action analysis, Bitcoin’s immediate support level below $80,000 is around $78,350. Optimistically, a short-squeeze-driven Bitcoin price recovery could trigger a breakout rally, potentially reaching the $91,604 swing high.

Michael Saylor Says Bitcoin Volatility Reflects Its Utility

0

Michael Saylor, chairman of Strategy, has once again emphasized the significance of the volatility of Bitcoin, asserting that it is a direct result of its utility. 

According to Saylor, Bitcoin’s volatility is due to its liquidity and 24/7 availability. These characteristics make it more susceptible to sharp sell-offs during market panic.

However, Saylor reinforced that while Bitcoin may behave as a risk asset in the short term, its long-term value remains unaffected by these fluctuations.

Bitcoin’s Correlation with Traditional Markets

Saylor’s comments came in response to questions raised by Dave Portnoy, a prominent meme coin collector. Portnoy had questioned why Bitcoin appears to trade in tandem with the US stock market despite its aim to be independent of the US Dollar. 

He pointed out that Bitcoin’s price often mirrors movements in traditional markets, with the crypto rising when markets are up and falling when markets decline. Saylor responded:

“Doesn’t mean it’s correlated long-term—just means it’s always available.”

The Tariff Exemption Advantage

Saylor’s remarks on Bitcoin’s volatility came only a day after he reiterated the crypto’s advantage over tangible commodities like gold. He highlighted that Bitcoin is not subject to tariffs, a feature that sets it apart from other financial assets. This statement follows Donald Trump’s recent tariff impositions on imported goods. 

Trump’s tariffs, which he justified as reciprocal charges from other nations, have significantly impacted the financial market and physical commodities. However, Saylor pointed out that this tariff exemption strengthens Bitcoin’s position as a unique financial asset.

Diverging Views on Economic Impact

Meanwhile, Arthur Hayes, the former CEO of BitMEX, provided a contrasting view on the economic landscape. Hayes expressed that he welcomes the economic imbalances caused by tariffs and predicted that the solution to these imbalances would involve printing more money. 

Hayes believes this would ultimately benefit assets like Bitcoin. Furthermore, he pointed out that the weakening of the US Dollar and the trend of foreigners selling US tech stocks and repatriating funds would contribute positively to Bitcoin’s value in the medium term.

Here’s Why SEC Lawsuit Against Ripple May Not Be Completely Over Yet: Legal Expert

0

Renowned legal expert Bill Morgan suggests that the lawsuit between the SEC and Ripple is not entirely over despite the parties dropping their appeals. 

Recent developments in the SEC v. Ripple lawsuit have continued to stir discussion within the XRP community, with enthusiasts questioning whether the case has finally ended. 

Recall that Ripple announced it was dropping its cross-appeal against the SEC for a reduced fine of $50 million and the dismissal of the permanent injunction imposed on its future XRP sales. This move was in response to the SEC’s decision to unconditionally drop its appeal against Ripple. 

Ripple Case Finally Over?

Following these developments, XRP enthusiasts indicate that the case has finally ended. In particular, an X user known as Ttmoto noted that the evidence suggests that the lawsuit is over. The user emphasized that the SEC will keep $50 million out of the $125 million fine and refund Ripple the remaining $75 million. 

Further, the user dismissed speculation about a court filing date this month. They noted that no reliable source has confirmed an April filing date for the Ripple lawsuit. 

For context, this filing date relates to the Second Circuit’s initial scheduling order, which required Ripple to file its cross-appeal motion and also respond to the SEC appeal. Per the order, Ripple must submit this motion on or before April 16, 2025.

However, with the parties dropping their appeals, Ripple will no longer comply with the order.  Therefore, Ttmoto declared that the lawsuit was over, adding that the parties were documenting the settlement terms, which would be entered into the court record. 

Top Lawyer Reacts 

Responding, Attorney Morgan echoed, “It depends.” This suggests that while the overall case appears settled, some issues still suggest the matter is not completely over. 

So far, Ripple is the only party that has confirmed the dismissal of the appeal. The regulator has not officially confirmed whether it will no longer pursue the Ripple appeal. 

According to Ripple and other sources, the appeal dismissal decision requires the commission’s vote before it becomes official. This vote is usually held during the SEC’s closed-door meetings and accompanied by an official announcement. 

Since Ripple announced the appeal dismissal, the SEC has held this meeting twice–on March 27 and April 3, 2025. However, it did not issue a statement regarding the dismissal of the Ripple appeal. 

Meanwhile, Attorney Fred Rispoli, founder of Hodl Law, suggested that the Ripple lawsuit will be completely resolved on or before May 24, 2025. On March 25, the lawyer predicted that the SEC would formally vote on the appeal dismissal decision within 30 days. 

He added that Judge Analisa Torres will approve the decision within 30 days. Based on his analysis, Attorney Rispoli expects the lawsuit to be completely resolved by May 24, 2025. It remains to be seen whether the prediction will materialize. 

Meanwhile, the crypto community is awaiting the SEC vote and subsequent statement confirming its decision to discontinue the Ripple appeal.