Home Blog Page 834

3 Factors That Could Send XRP Above $10 As Rally Isn’t Over: Web3 Growth Manager

0

Popular Web3 Growth Manager Cas Abbé asserts that the end of the Ripple lawsuit sets the stage for a further XRP rally to the double-digit range.

Abbé made the declaration in an X thread over the weekend as he highlighted the impact of the lawsuit’s resolution on XRP’s price. 

The expert indicated that the lawsuit’s resolution has already been priced in, as the price of XRP spiked over 500%—from around $0.5 to $3.3–during Q4 2024. 

3 Factors That Could Send XRP Above $10 

While many think XRP’s rally has ended following the lawsuit’s resolution, Abbé asserted that the coin could see more gains. He highlighted three bullish catalysts that could send XRP’s price above $10 following the lawsuit’s conclusion. 

XRP ETF Approval 

Following the lawsuit’s resolution, Abbé suggests that regulatory clarity is now in place for XRP in the U.S. This has prompted over 10 institutions, including Franklin Templeton, to file for spot-based XRP ETFs. He predicted that other top asset managers like BlackRock and Fidelity could also seek the SEC’s permission to launch XRP ETFs in the U.S. 

The expert noted that PolyMarket predicts an 83% probability of XRP ETF approval in 2025. Abbé noted that institutions might invest in these funds if this prediction materializes due to XRP’s narrative as a payment asset with U.S. government backing and regulatory clarity. 

He expects the ETF approval to impact XRP’s performance by paving the way for a significant rally. 

RLUSD Adoption 

In addition, the expert points out that the lawsuit’s conclusion could drive the adoption of Ripple USD (RLUSD), which would positively impact XRP’s price. 

According to Abbé, the U.S. government is already bullish on stablecoins, especially those pegged to the U.S. dollar. Abbé suggested that the government aims to leverage USD-pegged stablecoins to maintain its dollar hegemony. 

In his view, Ripple intends to achieve a similar goal through its RLUSD stablecoin, which is backed by U.S. dollar deposits, government bonds, and cash equivalents. 

Explaining how RLUSD might benefit XRP, Abbé characterized the stablecoin as digital cash for the dollar and XRP as the ‘global courier’ connecting everyone, including banks. Abbé indicated that as banks attempt to integrate with digital dollars through RLUSD, XRP will serve as a bridge currency, eliminating the need for multiple currency conversions. 

He emphasized that the narrative is similar to how USDT adoption supposedly drove Bitcoin’s market cap to over $2 trillion and USDC adoption pumped ETH valuation to over $600 billion. Consequently, he forecasted that the massive adoption of RLUSD will also be bullish for XRP’s growth. 

Ripple IPO 

Lastly, the expert noted that 2025 might finally be the year for the highly anticipated Ripple IPO due to the U.S. pro-crypto administration and XRP regulatory clarity. 

Abbé suggested that a Ripple IPO is a big deal as it could allow the company to venture into multiple markets, such as real-world assets, decentralized finance, and others. He expects this expansion to attract more revenue for Ripple, with XRP poised to benefit significantly, increasing its value over time. 

Interestingly, Abbé expects these factors to drive XRP’s price above $10, marking a surge of 376.19% from the current value of $2.1. 

Here’s Bitcoin Price if It Hits $500T as Michael Saylor Predicted

0

Bitcoin price could hit a multi-million-dollar value if Strategy Chairman Michael Saylor’s $500 trillion market cap prediction comes to fruition.

Market analysts have made several price assertions about the pioneering cryptocurrency, but none have matched the bold calls from Michael Saylor, Strategy’s executive chairman. A few months after predicting a surge to $13 million in 20 years, the Bitcoin evangelist recently upped his outlook.

The Crypto Basic reported that Saylor placed a high-end bet that Bitcoin’s market cap will hit $500 trillion. Despite seeming glaringly daunting, he has remained unwavering in his Bitcoin bullishness and long-term ambitious projections.

This piece analyzes why Saylor shares this view and its price implications for Bitcoin.

Is $500T Possible for Bitcoin?

Interestingly, Saylor claims the Bitcoin revolution is unstoppable, branding it the 21st-century asset. He based his $500 trillion market cap predictions on a capital shift from several financial vehicles to the leading cryptocurrency.

The Strategy executive noted that liquidity will flow from foreign fiscal and 20th-century assets to Bitcoin. He predicted that the asset would demonitize every long-term store of value, including gold and real estate.

Furthermore, Saylor suggested that Bitcoin is the next evolution of money and would stir a shift from physical to digital assets, attracting staggering inflows from legacy financial instruments. As a result, he urged the United States to stay ahead of the curve and acquire 25 to 30% of the asset’s total cap.

Meanwhile, if Saylor’s assertions prove true, Bitcoin’s limited supply property could spark a supply shock, catalyzing a parabolic price expansion for the premier asset. Notably, recent escalating interest in Bitcoin among nations and large financial institutions suggests it could attain the level of demand the Strategy co-founder projects.

Bitcoin Price If Its Market Cap Hits $500T

For the uninitiated, Bitcoin has a current circulating supply of 19.84 million and a fully diluted supply of 21 million. Hence, a hypothetical market cap of $500 trillion is about 30,860% off its current valuation of $1.615 trillion.

Using its total supply of 21 million BTC and the equation that an asset’s price is a function of its market cap divided by its supply, Bitcoin price would hit $23.8 million at a $500 trillion valuation.

However, a calculation using the current price and circulating supply of $81,401 and 19.84 million would see Bitcoin hit an impressive $25.2 million per coin at a 30,860% surge. These projections remain largely speculative at press time and should not constitute investment advice.

If Shiba Inu Overtakes Cardano, Here’s How High SHIB Price Would Reach

0

The price of Shiba Inu could surge significantly if SHIB equals or surpasses the market capitalization of Cardano.  

Shiba Inu has continued to trade in bearish territory recently, with SHIB currently hovering around the $0.000012 price mark. At press time, Shiba Inu was changing hands at $0.00001218 per token, representing a month-to-date decline of 12.6%. Shiba Inu is also down 7.49% in the past seven days and 63.41% from its December peak of $0.00003329. 

Investors Remain Confident Despite Suffering Huge Losses

According to IntoTheBlock data, 85.22% of all Shiba Inu holders are in losses at the current price, while only 10.59% are in profit. However, 4.19% of all blockchain addresses holding SHIB are at breakeven, implying that they are neither in profit nor loss. 

Shiba Inu profitability

Although most Shiba Inu investors are in losses, some holders are still confident about a potential price surge this season. 

Notably, some investors wonder how high the price of Shiba Inu will rise if it ‘takes over’ the position of established cryptocurrencies like Cardano in the global crypto ranking. 

This bold imagination assumes that SHIB will equal or surpass Cardano’s market cap to become the ninth biggest cryptocurrency—provided ADA doesn’t experience comparable growth. 

Shiba Inu Price If It Takes Over Cardano 

Currently, ADA is trading at $0.6566 per coin, and its market cap is $23.15 billion, making it the ninth-biggest cryptocurrency in the world. 

On the other hand, Shiba Inu is worth $0.00001218 per token. It is currently ranked as the 17th biggest cryptocurrency globally, with a market cap of $7.16 billion. To surpass Cardano’s market cap, Shiba Inu must spike 224% from its current valuation of $7.16 billion. 

This increase would take SHIB’s valuation to $23.16 billion, potentially positioning SHIB to rank ahead of ADA as the ninth biggest asset, assuming the latter does not witness comparable growth. 

At a market cap of $23.16 billion, SHIB will be worth $0.00003930 per token, given its circulating supply of 589.25 trillion tokens. This estimated price is still 55.56% below Shiba Inu’s all-time high of $0.00008845. 

Recall that the last time SHIB traded around $0.000039 was on March 6, 2024. A day earlier, the coin had surged to a multi-year peak of $0.000045. Ever since, Shiba Inu has struggled to reclaim the $0.000039 target. 

SHIB Potential Surge to $0.000039

Several experts had previously predicted that SHIB was close to hitting the target, including pseudonymous analyst Ak47. 

As reported last year, the analyst projected that SHIB was poised for a surge to $0.00003946 after the token breached a multi-week falling wedge. This prediction did not materialize due to multiple market developments. 

Meanwhile, crypto prediction platform Changelly forecasts that SHIB will revisit the $0.000039 price mark by next year, specifically in December 2026. Interestingly, the prediction platform Telegaon believes SHIB will hit its target this year. 

Ultimately, whether SHIB will revisit the $0.000039 target this year or next remains to be seen. 

Expert Says Don’t Spend Time Worrying About Prices, Predicts Timeline for Bitcoin to $1M Using Power Law

0

A prominent market analyst has urged enthusiasts to look past the current Bitcoin price sluggishness, suggesting higher price milestones in a decade.

Bitcoin’s choppy price action has continued to raise skepticism among market participants as sideways macroeconomic factors spur downsides. With the April 2 “Liberation Day” in America just three days away, investors are fleeing to caution, surprisingly hurting Bitcoin and the crypto market.

Despite the uncertainties, prominent market analyst “apsk32” has nudged enthusiasts to look past the short-term volatility. He insists that Bitcoin has maintained an overall upsurge in the long term and expects higher prices if the trend continues.

Bullish Curve Suggests $1M per Bitcoin

In a tweet, apsk32 highlighted that Bitcoin has followed a curve for over 15 years, accurately predicting the asset’s price expectations. He noted that the Bitcoin Power Law model—which projects Bitcoin’s possible prices against time in a resistance and support curve—has provided price outlooks for the pioneering cryptocurrency. The analyst noted that if its forecasts remain true, all investors need to do is hold the asset.

Notably, the market watcher added a time contour to the Bitcoin price model, which tracks how many years the asset’s price is ahead of its predicted price level. Particularly, moving the curve’s support to the left could give insight into how Bitcoin outperforms the Power Law model.

For context, the chart shows that at yesterday’s price of $82,507, Bitcoin traded over two years ahead of support at $49,119. Interestingly, the Bitcoin Power Curve Time Contour also predicts the best and worst possible scenarios for Bitcoin’s price reaching a target. 

With the layers of support, apsk32 predicted when Bitcoin would surge to $1 million if it front-runs or follows the Power Law model. The graph shows that if Bitcoin trades five years ahead of the support, it could hit $1 million by January 2031.

However, the absolute latest for the premier asset to rally over 1,121% from its current price to $1 million is by January 2036. Notably, this is years off from a new model that proposed that Bitcoin could hit the price mark in 2027.

Bitcoin to $1M per Power Curve Time Contours

Analyst Highlights Path to $200,000 By the Year’s End

Meanwhile, apsk32 suggested that Bitcoin has more upside this year. In a parallel commentary, he predicted a surge to over $200,000 before the end of 2025.

The analyst maintained that Bitcoin’s bull season is not over yet, as past events suggest more upside. He shared that the leading cryptocurrency has had a history of rapid price developments between May and November of the last cyclical years, predicting a repeat.

Bitcoin to $200000 by Year End

As a result, he expects an over 143% surge from the current market price of $82,111 to at least $200,000 before the end of the year. Notably, this assertion aligns with analysis from Bernstein, Bitwise, and prominent financial author Robert Kiyosaki.

Bitcoin Nears $80K Support: Will Bears Push It to $73,767?

Bitcoin drops below $82K, signaling a potential extended correction to $80K amid rising fear and uncertainty.

With crypto market liquidations reaching up to $217 million in the past 24 hours, Bitcoin is experiencing a sharp pullback. Over the past four days, Bitcoin has fallen by 6%, hitting a 24-hour low of $81,287.

Currently, Bitcoin is trading at $81,993, showing signs of a lower price rejection. Will this lead to a bullish rebound and prevent a retest of the $80,000 support level?

Bitcoin Analysis Warns of a Retest Near $80K

In the daily chart, Bitcoin’s price action shows a sharp bearish reversal from an overhead resistance trendline. This breaks the 67.8% Fibonacci level at $86,145 and the 200-day EMA near $85,500.

Bitcoin Price Chart
Bitcoin Price Chart

With a series of consecutive bearish candles, Bitcoin is approaching the 50% Fibonacci level at $79,957. However, despite the bearish pressure, the lower price action in the past three candles suggests a potential reversal.

Nevertheless, the downtrend has triggered a bearish crossover in the MACD and signal lines, indicating a possible steep correction ahead. Meanwhile, the declining trend in the 50-day and 200-day EMAs points toward a golden crossover.

Bitcoin ETFs’ Streak of Consecutive Days of Inflows Ends

Despite the bearish market, Bitcoin ETFs saw an inflow of $196 million last week, marking the second consecutive week of positive inflows after a $744.35 million inflow the previous week.

However, the monthly net inflow is negative, at -$696.84 million. Furthermore, on March 28, a $93.16 million outflow ended a streak of 10 consecutive days of inflows. Most of this outflow came from Fidelity, which recorded a withdrawal of $93.16 million, while other Bitcoin ETFs maintained zero flows.

Image

Analyst Highlights Increased Bitcoin Movement

Meanwhile, Bitcoin miners’ confidence is gradually declining. According to crypto analyst Ali Martinez, Bitcoin miners sold more than 2,400 BTC in the past week, worth $220 million. Data from CryptoQuant shows that Bitcoin miner reserves have dropped from 1.81 million BTC to 1.808 million BTC.

Furthermore, Bitcoin’s on-chain activity has surged amid the growing market uncertainty. Bitcoin holders have moved 1,280 BTC in the past few hours, worth $106 million.

Additionally, over 30,000 BTC have been withdrawn from exchanges in the past week. The decreasing Bitcoin supply on exchanges provides a silver lining amid the growing uncertainty.

Conclusion

The declining Bitcoin supply on exchanges and the falling miner reserves offer conflicting signals about the market. This creates increased uncertainty, potentially leading to sharp price movements in either direction.

However, the prevailing bearish pressure suggests the risk of a further downside move due to rising fear. Based on the Fibonacci levels, immediate support for Bitcoin is near $80,000 at the 50% Fibonacci level.

A breakdown below this support will likely lead to a retest of the $73,767 level at the 38.2% Fibonacci level. On the other hand, if Bitcoin manages a bullish rebound, it could aim to retest the 200-day EMA at $85,452.

Top Software Engineer Says XRP Price is a No-Brainer, Risk/Reward Ratio Unheard Of

Software engineer Vincent Van Code recently sparked attention by calling the current price of XRP a “no-brainer” opportunity for investors.

According to Van Code, the current price point of XRP presents an exceptional risk-to-reward ratio. He expressed confidence that the asset is undervalued, implying that this might be one of the last chances to buy XRP at such low prices.

“Unlikely prices this low will be seen again,” Van Code remarked, suggesting that the market might not see these levels for much longer.

Notably, XRP has been down 4.5% over the last 24 hours, trading at $2.08. It is now dangerously close to losing the $2 psychological level again this month. At this price, XRP is down by 33% over the last two months.

Meanwhile, Van Code’s commentary reflects the popular belief that XRP could be on the verge of another significant price surge. Among the factors enthusiasts hope would propel prices are XRP ETFs, Ripple’s RLUSD adoption, and a Ripple IPO.

XRP Potential to “Break Free” from Major Market Influences

Van Code also touched on the idea that XRP is poised to “break free” from the grip of major players in the crypto market. Specifically, he cited Bitcoin, Binance, and Tether, whom he referred to as the “mafia” holding back XRP.

He speculates that once XRP breaks away from these forces, its price could skyrocket, making it a potentially game-changing investment for those who act early. However, he acknowledged that the market could see a significant downturn before XRP takes off.

Despite his optimistic tone, Van Code clarified that his statements were not financial advice. “I am not saying to buy XRP, just look into it,” he stated. He urged followers to do their research before making investment decisions.

Community Reacts: Take Loans to Buy More XRP?

Meanwhile, his tweet generated excitement among XRP supporters and sparked further debate among critics. One commenter remarked that if Van Code truly believes XRP’s price is a “no-brainer,” he should take out a loan and invest all of it into XRP.

In response, Van Code pointed out that he already has his investments in place. “You must be confusing me with someone in their early 20s still living at home,” he said humorously.

He went on to clarify that borrowing money to buy crypto, or even stocks, is “ridiculous.” Van Code explained that while he uses CFDs to swing trade Ethereum and Bitcoin for fun, he holds XRP for entirely different reasons.

“It’s blind advice to suggest anyone take out loans to invest in crypto,” he remarked.

Whales Dump 1.12B XRP in Two Days: What Does It Mean for XRP Price?

0

Whale wallets offloaded 1.12 billion XRP in 48 hours, increasing the market supply. Will XRP retrace back to $1.7?

XRP has experienced significant price fluctuations, rising above $2.90 in early March before quickly retreating to below $2. Since the conclusion of Ripple’s legal battle with the SEC, the crypto has remained in a downward trend, consistently forming lower highs and lower lows. 

Essentially, the overall market sentiment is more bearish, with key indicators reflecting ongoing selling pressure. Recent data reveals that large XRP holders have significantly reduced their positions, coinciding with the decline in cryptocurrency.

Blockchain data presented by analyst Ali Martinez highlighted that wallets holding between 100 million and 1 billion XRP initially maintained stable balances before a sharp drop. 

Around March 28, whale holdings declined significantly. Over 48 hours preceding Martinez’s post, 1.12 billion XRP had been offloaded.

This led to increased market supply and further downward pressure on price. Historically, such large-scale liquidations have triggered panic selling among retail investors, amplifying the market’s instability.

Diverging Expert Predictions on XRP’s Future

Amid the whale dumping, market analysts have provided contrasting views on XRP’s future trajectory. Veteran trader Peter Brandt pointed to a head-and-shoulders pattern, suggesting that a drop below $1.90 could lead to a correction toward $1.07. 

Meanwhile, he noted that a move above $3 could negate this bearish setup, but risks remain elevated until then.

Conversely, another analyst, known as XForceGlobal, maintained a bullish outlook, emphasizing that XRP’s timeline remains independent of short-term market movements. The analyst projected a potential price range of $7 to $10 for 2025-2026, dismissing immediate bearish concerns.

Contrastingly, crypto trader Javon Marks highlighted a potential breakout, citing XRP’s historical performance following similar technical patterns. He pointed to a previous 570% price surge after a falling wedge breakout, suggesting that another significant rally could be on the horizon.

The relative strength index (RSI) also indicated positive momentum, supporting a potential upward movement.

XRP Price Trends Across Different Timeframes

Over the past 24 hours, XRP declined by 3.4%, continuing its downward trajectory. The weekly performance shows a steep drop of 14.5%, signaling strong selling pressure. 

A 10.4% decline over 14 days suggests persistent weakness, while the 30-day movement reflects a 4.9% decrease, reinforcing a bearish outlook. The cryptocurrency has struggled to sustain gains, remaining within a prolonged downtrend.

Ethereum Eyes $1,500 as $229M in Whale Liquidations Loom

The price of Ethereum under $1,800 warns of a potential correction to $1,500, while optimistic traders hope for a double bottom reversal.

As Bitcoin crashes to $81,000, Ethereum has breached the crucial $1,800 support. Having created a 24-hour low at $1,754, Ethereum is currently trading at $1,809. 

However, despite the increased bearish influence, the possibility of a double-bottom reversal arises at a crucial support. Will Ethereum manage to regain bullish momentum? 

Ethereum Analysis Hints At Double Bottom Reversal

In the daily chart, the Ethereum price trend showcases a streak of six consecutive bearish candles. These account for a pullback of nearly 12%. Furthermore, the declining trend retests the $1,762 S1 pivot support level with lower price rejection. 

COINBASE:ETHUSD Chart Image by Trojan69420

Ethereum’s price action near this crucial support level indicates bullish dominance, hinting at the formation of a Doji candle. This suggests a potential double-bottom reversal, as Ethereum bounced back from the S1 pivot support level in early March.

The daily RSI reveals a bullish divergence, supporting the possibility of a double-bottom reversal. The neckline of the double-bottom pattern is near the $2,100 resistance level.

However, for the double-bottom reversal to be completed, Ethereum must break above the local resistance trendline, which has been limiting bullish growth within the broader falling channel pattern.

Ethereum Whales Face Liquidation Risk Worth $229M

Amid the declining Ethereum prices, crypto whales are at risk of significant liquidations. According to a recent tweet by LookOnChain, two whales on Maker DAO are holding Ethereum close to liquidation levels.

These whales hold 125,603 ETH, worth $229 million. The liquidation prices are set at $1,787 and $1,701. As the downtrend accelerates, large-scale liquidations could fuel an even steeper correction in Ethereum’s price.

Optimistic Analysts Hope for a Bounce Back

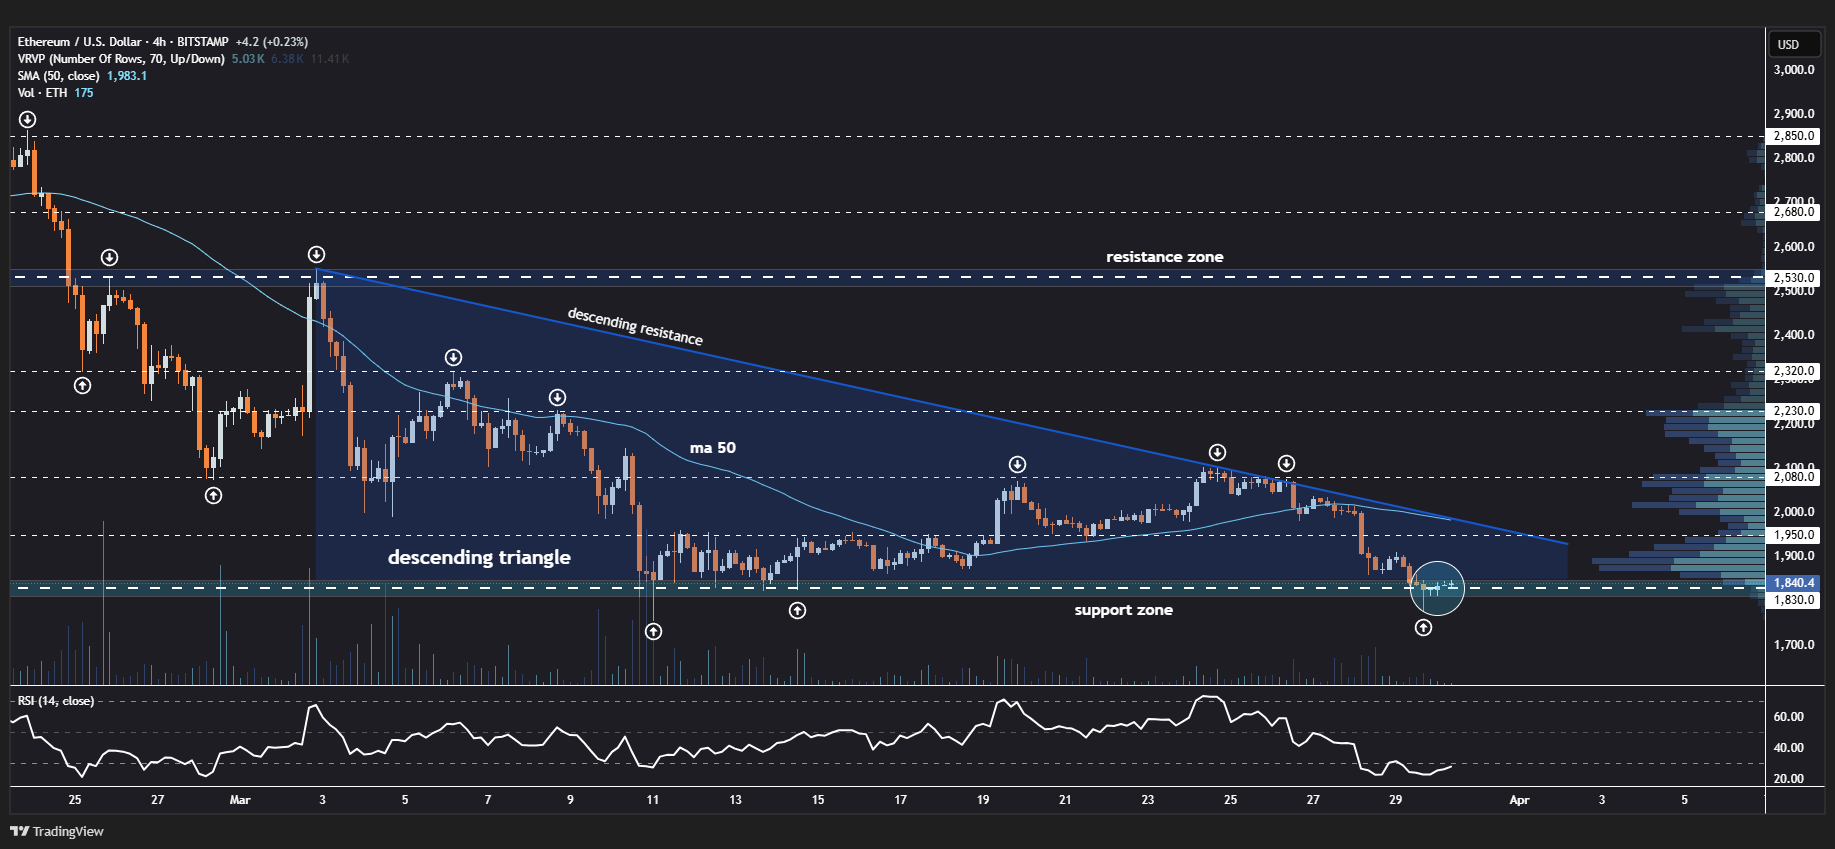
Despite the short-term selling pressure, crypto analyst Jonathan Carter points to the possibility of a bullish rebound. According to Carter, Ethereum is holding the lower boundary of a descending triangle pattern.

With a potential price rejection near the $1,800 mark, a bounce could challenge the $1,950 and $2,080 horizontal resistance levels. Carter extends his price targets to $2,230 and $2,320.

Image

Conclusion

The short-term price rejection from the 24-hour low suggests a potential bounce back. However, the looming risk of whale liquidations, worth $229 million, makes the situation precarious.

A close below the S1 pivot support at $1,762 would likely extend the correction phase, with a retest of the lower boundary of the falling channel pattern near $1,500.

On the other hand, a successful double-bottom reversal breaking the local resistance trendline could challenge the falling channel boundary near $2,300.

FDIC Clears Over 5,000 Banks to Engage in Bitcoin and Crypto Activities Without Prior Approval

0

The FDIC has cleared banks under its jurisdiction to participate in Bitcoin and crypto-related activities without prior approval.

Another US regulator has eased earlier restrictions impeding banks from meddling with the digital asset industry. On Friday, the Federal Deposit Insurance Corporation (FDIC) issued a statement notifying banks under its purview to freely engage in crypto-related activities.

US Regulator Revokes Earlier Crypto Clause

The Financial Institution Letter FIL-7-2025, released on March 28, encourages banks to expand their borders into permissible digital asset and blockchain-related activities without sourcing prior FDIC approval.

This clears FDIC-supervised banks to service digital asset firms in the US as long as they implement necessary measures to manage risks associated with the industry, further broadening adoption.

The Friday statement rescinded an April 7, 2022, notification that aimed to impede interaction between financial institutions and the crypto industry. This previous letter mandated banks to notify the FDIC before engaging in any activity affiliated with cryptocurrencies.

For context, according to its official website, the FDIC supervises over 5,000 banks. This large figure reflects how important the announcement is for mainstream Bitcoin and crypto adoption in the United States.

Moreover, the ease follows a similar position from another US federal banking regulator. For context, the Office of the Comptroller of the Currency (OCC) cleared banks under its purview in early March to engage in crypto custody and distributed ledger validation, among others.

A Shift from a Flawed Digital Asset Approach 

The FDIC acting chair, Travis Hill, stated that the new measure marked a regulatory shift from the obscure measures impeding a forward-thinking approach towards emerging technologies in the past three years.

Furthermore, he noted that the federal regulator will engage with the White House crypto working group to lay out a milder approach toward Bitcoin and crypto for banks.

Meanwhile, the announcement also caught the attention of David Sacks, the White House crypto and AI czar. In a tweet, he applauded the FDIC and Hill for taking a more pragmatic approach toward crypto, insisting it would flare the growing flame of mainstream adoption.

If XRP/ETH Hits 0.003, XRP Could Reach $18 at $6K ETH—$30 XRP at $10K ETH: Top Analyst

0

Market expert Mr. Xoom shares how an XRP run to lofty two-digit targets is plausible using Fibonacci targets from the XRP/Ethereum pair.

He discussed this at a time when XRP and Ethereum were observing the effect of a broader market pullback that had pushed the global crypto market cap to a low of $2.66 trillion at press time. 

XRP Continues to Outperform Ethereum 

Interestingly, XRP appears to be showing greater resilience than the rest of the altcoin market. For context, Ethereum has collapsed 48.4% since February. In contrast, XRP has dropped 25% within the same timeframe.

As a result, the XRP/ETH pair, which tracks XRP’s performance against Ethereum, has continued to increase as Ethereum declines faster than XRP. Notably, since November 2024, the XRPETH pair has increased by 255%.

In his recent analysis, Mr. Xoom noted that he expects XRP to continue outperforming Ethereum as the market progresses. However, going forward, this outperformance would not be due to XRP falling slower than ETH, as has been the case since February, but as a result of XRP rising faster than ETH.

According to Mr. Xoom, while the XRP/ETH pair could continue to rise in the future, he believes Ethereum price would also increase alongside. Notably, the analyst expects the broader crypto market to recover, pushing Ethereum to rebound from recent levels. However, he still believes XRP will spike more than ETH in this market recovery.

For context, due to XRP’s outperformance over the past five months, the XRP/ETH pair has increased from 0.00002024 in November 2024 to the current value of 0.001197. Nonetheless, this level is still much lower than the pair’s peak of 0.003667 in December 2018, suggesting XRP might still have more room to grow against ETH.

XRPETH 1W Chart Mr Xoom
XRPETH 1W Chart | Mr Xoom

Data from Mr. Xoom’s chart shows that the crucial 0.003 psychological mark on the weekly XRPETH chart aligns with the 2.618 Fibonacci extension level. The analyst believes the pair is capable of rising from the current 0.001197 value to hit 0.003, representing a 150% increase.

XRP Prices at XRP/ETH Value of 0.003

Interestingly, Mr. Xoom projects Ethereum to possibly claim new all-time highs from $6,000 to $10,000 when the broader market recovers from the ongoing turbulence, marking an impressive rebound from the current price of $1,866. This aligns with Ali Martinez’s target.

Notably, if the XRP/ETH pair hits 0.003 when Ethereum trades at $6,000, this will translate to an XRP price of $18. Mr. Xoom had erroneously presented a price of $16. Further, if Ethereum changes hands at $10,000 when the XRPETH pair is at 0.003, the XRP price would stand at $30.

It bears mentioning that several analysts had predicted XRP to reach $30, with pundit DustyBC asserting last June that a “God candle” could do the trick. However, multiple cynics have dismissed the target, especially as it would lead to a market cap of $1.74 trillion for XRP.

Amid the pessimism, Mr. Xoom stressed in his recent analysis that the XRP/ETH projection is to show that the $30 target “isn’t completely crazy.” This echoes the sentiment of crypto trader Ralston Maximus, who suggested last October that the $30 to $35 is not a ridiculous target.