Home Blog Page 879

Bitcoin Price Chart Confirmed Bearish According to Peter Brandt

0

Bitcoin price chart is now firmly bearish, according to veteran commodities trader Peter Brandt.

The analysis follows Bitcoin‘s weekend drop to $80,000 as geopolitical uncertainty continues to outweigh White House support. Specifically, the asset has been caught up in broader uncertainty over President Donald Trump’s tariff policy, Russia-Ukraine war stance, and government spending cuts, which have also seen traditional risk markets plummet.

Bearish Bitcoin

On Sunday, March 9, Brandt asserted that Bitcoin’s price chart was bearish as it had completed a double-top pattern forming on the daily candle chart since mid-December 2024 and a pennant forming since late February 2025. The former is a classic price reversal or bearish continuation pattern, while the latter is a continuation pattern.

Bitcoin completes double top and pennant on daily candle chart
Bitcoin completes double top and pennant on daily candle chart. Source: Peter Brandt

To flip positive, the veteran trader contended that Bitcoin has to break above the top of the pennant around the $95,000 price point.

Interestingly, at least one other prominent analyst is betting on this positive reversal.

Anticipating a “tariff noise slowdown,” Standard Chartered Head of Digital Assets Research Geoffrey Kendrick opined in a Friday, March 7 note that Bitcoin could break above the $80,000 to $95,000 range soon.

“Buy weekend dip caused by lack of news from Trump tonight, look for a breakout of the top of this range soon (especially if the tariff noise can slow down for a while),” he wrote.

But failure to accomplish this breakout soon could expose Bitcoin to significant downside risk. In the early stages of the double top formation on the asset’s daily chart, Brandt had warned of a likely price drop to $75,000.

At the time of writing, Bitcoin has pared some of its weekend losses to trade at $82,500.

Buying the Dip? Analyst Identifies Crucial Dogecoin Demand Zones as DOGE Falls

0

Amid the Dogecoin push to lower prices, an analyst has identified demand zones that could be possible rebound areas and a buying opportunity.

Notably, Bitcoin rebounded slightly after dipping to $80,000 last week, moving the broader crypto market with it. Today’s 2% surge has seen Dogecoin replicate a similar momentum, bouncing from $0.1656 yesterday.

Nonetheless, the leading meme coin has struggled recently. With its fourth consecutive negative candle yesterday, Dogecoin corrected 30% the previous week.

Meanwhile, a TradingView analysis has identified strong support for where Dogecoin could possibly rebound. The demand walls also serve as buying areas for enthusiasts looking to dollar-cost average (DCA) their DOGE positions or start accumulating the asset.

Analyst Highlights Buying Zones

With every dip comes a buying opportunity, especially for high-caliber assets tipped to see higher prices in the long term. Pseudonymous analyst “TheGift94” has highlighted demand zones where Dogecoin could find solace amid the intense downward pressure.

In a TradingView analysis, he identified three zones, which he tagged as “buying demand zones.” His outermost support stands at $0.20, an area that Dogecoin has already breached. The meme coin’s 13% correction yesterday to close at $0.1678 ensured it desecrated the zone.

Meanwhile, the analyst highlighted the second and final demand zones at $0.16 and $0.13, respectively. Notably, Dogecoin would have to correct 25% to reach the final support area, which served as a base for the asset’s northward trajectory in November.

Buying Zones per TheGift94

Lower Before the Next Bullish Round?

Moreover, MMBTtrader shares a slightly more bearish outlook. The analyst suggested in his TradingView analysis that Dogecoin could breach all three aforementioned supports to $0.08131, a price level last seen in August.

He noted that the over 53% dump could set in after Dogecoin lost major daily support at $0.185. However, he predicted that the prominent meme coin would pump from the global support at $0.08131 to reclaim $0.40.

Dogecoin Analysis per MMB Trader

Meanwhile, market watchers have maintained a bullish price outlook for Dogecoin despite the downsides. Analysis suggests that DOGE still has a window to surge to $6.24 and $8.5 before the end of this bull cycle.

In the meantime, Dogecoin trades at $0.1728 with a market cap of $25 billion.

Here Is Why XRP Will Replace ‘Dying’ SWIFT

0

Popular XRP community handle suggests that the SWIFT payment system is dying slowly, emphasizing that XRP and XRPL are poised to replace it in global finance. 

There have been several debates about the potential of XRP replacing SWIFT as the backbone of global finance. 

Notably, several XRP community members believe that XRP has the capability to oust SWIFT, given its utility, such as near-instant and low-cost transaction prowess. 

Nine Reasons Why XRP Will Replace SWIFT 

As this debate gains momentum, popular XRP-focused X handle, “All Things XRP,” proclaimed that SWIFT is dying, with XRP poised to replace it. The community figure highlighted nine factors to support this argument. 

Outdated System 

First, the X handle suggested that the SWIFT payment system is outdated, expensive, and slow. Conversely, it characterized XRP and XRPL as cost-effective and fast, adding that the technology was built for the future.

Given XRP’s attributes, the channel asserted that it is only a matter of time before the cryptocurrency gains widespread adoption. 

Messaging Prowess 

Second, it compared the SWIFT messaging system to a dinosaur. According to the handle, traditional financial institutions, including banks, are forced to settle transactions manually because the SWIFT messaging system relies on a web of intermediaries. 

However, it emphasized that XRP is decentralized. It serves as a bridge between two fiat currencies and enables near-instant settlement without support from intermediaries. 

Speed 

The handle suggests that unlike SWIFT, which can take up to five days for cross-border settlements, XRP settles transactions in 3 – 5 seconds. 

Notably, it noted that there is no delay in sending money with XRP, emphasizing that the cryptocurrency moves value “at the speed of the internet.” 

Transaction Cost 

Fourth, the X handle highlighted the difference in transaction costs between SWIFT and XRP. While it claims SWIFT charges up to $50 for transactions, XRP’s cost is $0.0002. 

This attribute gives XRP an edge over SWIFT, with “All Things XRP” predicting that businesses will soon switch to the cryptocurrency for payments. 

Liquidity Benefits 

Notably, it touted XRP’s liquidity as its “secret weapon,” suggesting that the crypto asset frees up capital locked in dormant accounts under the SWIFT system. As a result, the handle noted that this feature makes XRP-related transactions near-instant and efficient. 

Adoption 

Sixth, the post acknowledged SWIFT’s dominance in the financial sector, boasting an established network of over 11,000 financial institutions. 

However, it suggested that the XRP ecosystem is rapidly growing, with Ripple’s RippleNet making significant moves to catch up. According to the post, RippleNet has more than 300 banking partners, indicating that financial institutions are rapidly adopting the technology. 

Regulatory Perspective 

Seventh, “All Things XRP” noted that SWIFT operates under a multi-layer bureaucracy. On the other hand, the handle indicated that XRP is poised for widespread adoption once the SEC lawsuit against Ripple is resolved. 

Security Concerns 

Eighth, the post claimed that SWIFT’s centralized model makes it vulnerable to attacks, referencing the $81 million Bangladesh Bank hack in 2016. 

On the contrary, it asserted that XRP’s underlying technology is decentralized, secure, and battle-tested. 

Upgrades 

Furthermore, the channel dismisses SWIFT’s major upgrades, such as ISO 20022 and GPI, as a band-aid on a crumbling system. Conversely, it noted that XRP is not a tweak but marks a paradigm shift in how global payments should be processed. 

In conclusion, the post declared XRP the winner over SWIFT. It stressed that XRP’s speed, scalability, and cost-efficiency are unstoppable forces that position it as the future standard for global financial transactions. 

Cardano Bull Says ADA Super Trend to $10 Unbroken

0

While Cardano dipped by 7.8% in 24 hours, an analyst highlighted bullish patterns, suggesting a possible breakout to $10.

Cardano’s price has sharply declined today, dropping 7.8% in value. The cryptocurrency fell from approximately $0.81 to a low near $0.70 before recovering slightly to around $0.75. This movement reflects the intense bearish pressure and high volatility across the market. 

Over the past week, ADA has lost 30.3% of its value, highlighting sustained selling pressure. Despite this, long-term performance still shows growth, with one-month and one-year gains at 7.3% and 1.1%, respectively.

Signs of a Cardano Price Trend Reversal

As the decline continued, analyst Dan Gambardello shared an analysis on X, suggesting a possible long-term uptrend for ADA. The chart presented a curved dotted line indicating a parabolic trend, which could result in a breakout if the price follows this pattern.

Also, a moving average appeared in the accompanying chart, hinting at a possible trend reversal. Typically, when prices move above this indicator, they signal bullish momentum.

The Relative Strength Index (RSI) was also recorded between 50 and 60, reflecting increasing buying strength. A curved dotted line on the RSI chart showed an upward trend, which could push the asset toward overbought levels if the momentum holds.

The analyst suggested that Cardano’s super trend remains intact, projecting a long-term target of $10.

ADA Resistance Levels and Key Patterns

Last Friday, analyst Ali Martinez observed a breakout pattern in ADA’s price action. The analysis pointed to a right-angled descending broadening wedge, a formation that often signals an impending breakout.

Martinez highlighted that ADA faced key resistance at $1.14. A successful breakout beyond this point could trigger a strong rally toward $2.

Another technical assessment from CryptoElites identified a cup and handle pattern, indicating continued bullish movement.

The analysis noted that ADA had broken from a descending trendline, signaling the end of a continued downtrend. A successful retest of the breakout level confirmed sustained bullish sentiment. Price targets included $2.50, $3, and $6, with an extended outlook of $12 in a broader bullish market.

Short-Term Targets Suggest a Breakout Opportunity

Likewise, analyst Rose Premium Signals provided insights into ADA’s market position. Their report noted that Cardano was consolidating within a descending channel on the daily chart, with the price approaching a key resistance area. This pattern suggested a potential breakout in the near term.

The analysis identified short-term targets of $1.30 and $1.50, dependent on a confirmed breakout. It emphasized that strong bullish momentum could follow if ADA successfully moves past resistance. Traders were advised to watch for confirmation signals to gauge further market direction.

XRP Market Cap Is a Myth, Says Analyst Making the Case for XRP to Reach $33

0

A notable market analyst has explained how XRP is capable of reaching ambitious two-digit prices, debunking what he calls the market cap myth.

Notably, XRP has been the subject of audacious price predictions, especially following its recent rally from November 2024 to January 2025. The asset surged past key psychological levels, reclaiming $1, $2, and $3. 

Although it recently dropped below $3 this month, March 2025, amid a broader market capitulation, bullish forecasts remain strong, with some analysts predicting prices as high as $27 and $33.  

While skeptics argue that these targets are unrealistic due to market cap constraints, market analyst Zach Rector took to X to challenge this sentiment. 

He recently addressed what he calls the “XRP market cap myth” by using real-world data to explain how XRP’s market cap can grow massively with relatively small inflows of capital.  

The XRP Market Cap Multiplier  

In his analysis, Rector explained that market cap growth for XRP—or any digital asset—are not as straightforward. According to him, XRP exhibits a unique market cap multiplier effect, where a small amount of capital inflow can lead to a massively large increase in valuation.  

For instance, he analyzed a four-hour period where XRP experienced $80 million in net inflows. During this window, XRP’s market cap expanded by $17 billion, reflecting a 212x multiplier. 

The reverse effect also occurred when the SEC filed an appeal brief on Jan. 15, 2025. Following the filing, XRP’s price dropped from $3.20 to below $3, causing a $15 billion reduction in market cap. However, this drop resulted from only $55 million in outflows, indicating another multiplier of 279x.  

Rector noted that, in previous weeks, he observed even higher multipliers, sometimes exceeding 589x and, in some cases, reaching into the thousands. This suggests that XRP is highly responsive to capital inflows, making it easier to move the asset’s market cap up or down.  

How ETFs Could Drive XRP to $33  

Taking this multiplier effect into consideration, Rector noted how ETF inflows could help push XRP price to ambitious targets. He stressed that JP Morgan recently estimated $4 billion to $8 billion in inflows for XRP ETFs within their first year of trading, according to a recent report from The Crypto Basic.

It bears mentioning that the push for XRP ETFs has gained steam. Cboe recently filed applications with the SEC on behalf of asset managers such as Bitwise, 21Shares, and WisdomTree. Additionally, Grayscale has applied to convert its XRP Trust into an ETF.  

Notably, based on JP Morgan’s conservative assumption of an $8 billion inflow once these ETFs go live, applying the 212x market cap multiplier would result in a $1.7 trillion market cap increase. Adding this to XRP’s existing market cap of around $200 billion would bring it to about $1.9 trillion.  

Now, with a circulating supply of 58 billion XRP, this level of market cap expansion would push XRP’s price to $33. Contrary to the belief that trillions of dollars are necessary to push XRP’s market cap to the trillion-dollar range, Rector argued that the multiplier effect makes it achievable with much less capital.  

Expert Says One Month Will Change Your Life Forever, Predicts XRP Rise to $27

0

A market expert suggests XRP symmetrical triangle breakout could push prices to double-digit figures, assuring investors that one month could change their lives forever.

This commentary came from EGRAG Crypto, a notable market analyst, amid XRP’s current battles at $2. For context, since hitting a local top of $3.02 on March 2 following Donald Trump’s initial disclosure around the U.S. crypto reserve, XRP has continued to slump, down 18% from this high.

The altcoin’s downward momentum reflects the turbulence within the broader crypto market amid macroeconomic uncertainties. Despite this, EGRAG, who has always been an XRP permabull, remains bullish on the asset. 

XRP Could Target Triangle Midpoint at $9.7

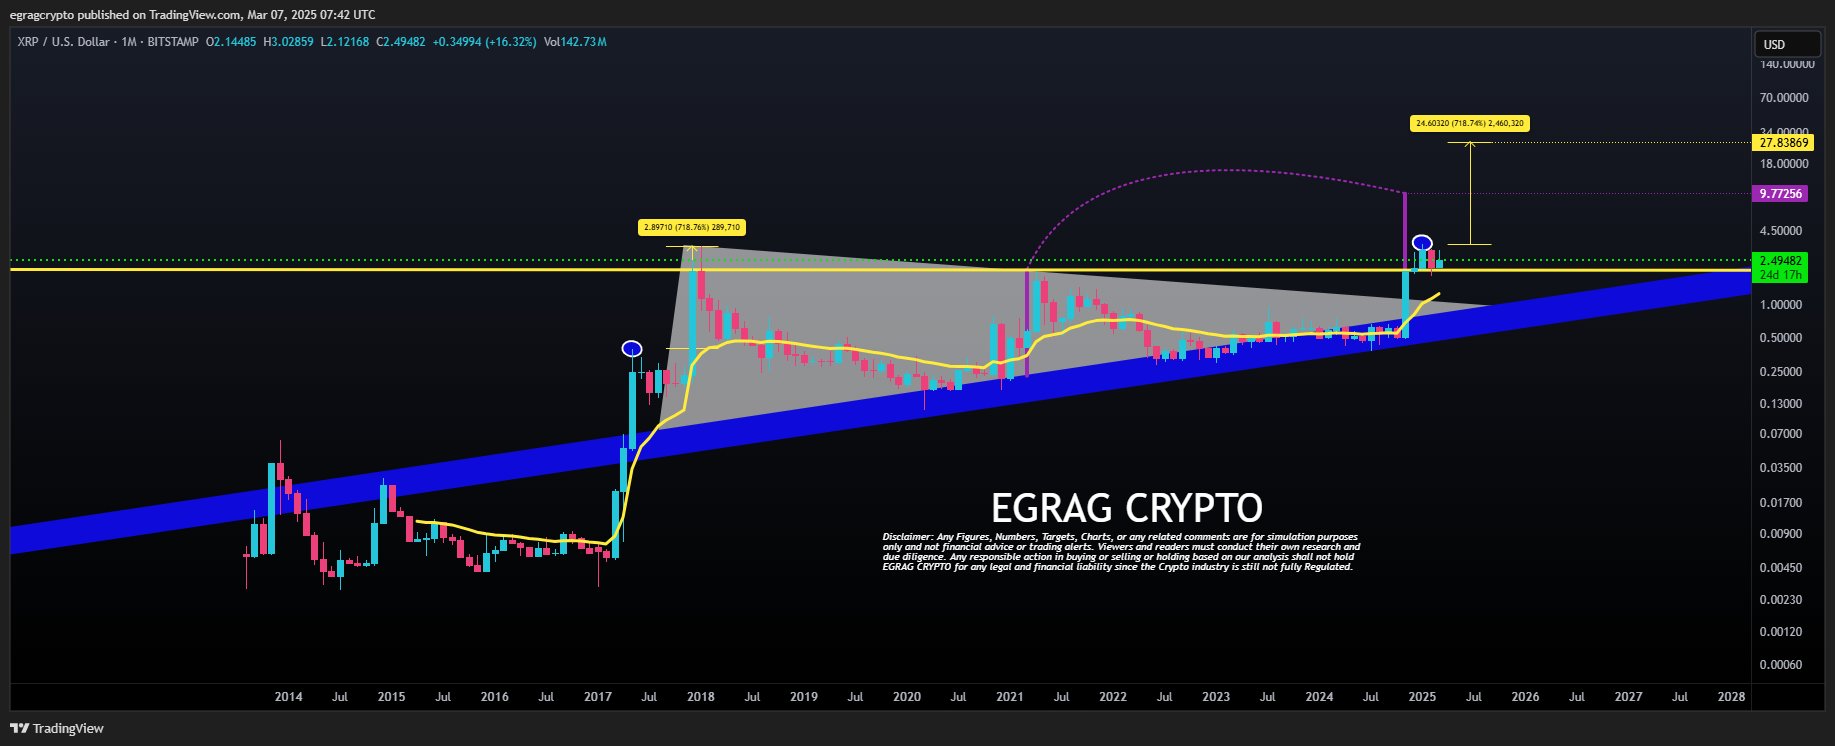
In his latest analysis, he found that XRP is merely exhibiting a post-breakout pullback, a price action that typically occurs after an asset stages a decisive breakout. Particularly, XRP broke out of its seven-year symmetrical triangle structure in November 2024, when it registered a massive 283% gain that month.

After the breakout, XRP maintained its upward trajectory, increasing by a mild 6.43% in December 2024 and by a more substantial 45.98% in January 2025. However, February 2025 brought the much-expected correction. Being a healthy price movement, EGRAG expects XRP to fly once the correction ends. 

As a result, he set up two price targets depending on how XRP’s price trajectory plays out. The first target lies at the $9.7 level. According to him, the asset will claim this level if its price movement respects the midpoint of the triangle breakout. Notably, several analysts like Alex Clay had previously projected a run to $10.

XRP 1M Chart EGRAG Crypto
XRP 1M Chart | EGRAG Crypto

Interestingly, EGRAG advised that market participants who have a price target of $10 should employ a laddering out strategy. He suggested that they start selling portions of their holdings at $8, $9 and then when the ultimate $10 target hits.

Potential Run to $27 if 2017 Fractal Plays Out

Meanwhile, the market analyst still believes XRP has the potential to aim higher. He stressed that in the 2017/2018 bull run, XRP recorded an impressive 718% rally from the $0.35 to $0.39 range, this level was its local top at the time. EGRAG believes this could repeat.

The analyst pointed out that XRP’s local top for this cycle is $3.4, attained in January 2025. Applying the same 718% upsurge potential to this $3.4 top, EGRAG discovered that XRP could rally to $27. Interestingly, last December, he also predicted an XRP rise to $27, citing its price action above the Break of Structure (BOS). 

In the latest analysis, EGRAG insisted that XRP’s momentum flip from bearish to bullish could occur in a month. “One month will change your life forever,” the analyst suggested.

He then noted the importance of observing market cycles. According to him, bullish reports like institutional interest would come and go, but the market will always observe its cyclical movements. At press time, XRP currently changes hands at $2.17, down 6.3% over the past 24 hours.

Here’s How High 1 Dogecoin Would Be Worth If DOGE Equals XRP or BNB Market Cap

0

Dogecoin could experience a remarkable surge if its market capitalization potentially equals that of established cryptocurrencies like XRP and BNB.  

The recent downturn in the broader crypto market had a devastating impact on Dogecoin, plunging its price below $0.2. As of 07:42 (UTC) on February 8, Dogecoin was trading at $0.1969, marking a 24-hour decline of 1.54%. 

The firstborn meme coin is also down 3.47% in the past week and has plunged 25.64% over the past 30 days. Despite this decline, DOGE has experienced a slight increase this month, registering an MTD growth of 5.38%. 

DOGEUSDT 2025 03 08 08 42 29

Amid DOGE’s recent mixed-price action, its community has remained focused on its positive strides, fueling ambitious speculations. For instance, some users wonder how much DOGE would be worth if Dogecoin successfully equaled the market cap of established cryptos like XRP or BNB. 

Overview of DOGE, XRP, and BNB Valuations 

It is noteworthy that XRP and BNB currently rank among the top five cryptos by market cap. While XRP is the fourth-biggest cryptocurrency globally, BNB is in fifth place. 

Currently, XRP has a market cap of $137.13 billion, with a token trading at $2.36 in the hours leading up to press time. On the other hand, BNB, which trades at $596.81 per coin, has a valuation of $85.4 billion. 

However, Dogecoin’s market cap is significantly lower than XRP’s and BNB’s, respectively. At a price of $0.1969, Dogecoin sits on a $29.2 billion market cap.  

DOGE Price If It Matches BNB or XRP Market Caps 

This suggests that Dogecoin must surge 192.46% from its current market cap to equal BNB’s $85.4 billion valuation. It would also require a significant growth of 369.62% to match XRP’s $137.13 billion market cap. 

If Dogecoin achieves this feat and matches BNB or XRP’s market cap, it would massively impact the token’s price. Since equaling the BNB market cap demands a surge of 192.46%, this would potentially take DOGE’s price to $0.5758. 

Similarly, DOGE’s price will soar to $0.9246 if it surges 369.62% to equal XRP’s $137.13 billion market cap. Both estimates assume that Dogecoin maintains its circulating supply of 148.34 billion. 

Potential Surge to $0.57 or $0.92 Targets 

For context, Dogecoin’s potential surge to $0.5758 is 21.93% below the asset’s previous all-time high of $0.7376, registered on May 8, 2021. Conversely, the $0.9246 target is slightly higher than DOGE’s previous ATH, representing a 25.35% increase. 

Interestingly, Changelly experts believe Dogecoin can reach the first target quickly. According to the experts, DOGE will hit the $0.57 mark this month, with the analysts setting a maximum target of $0.829 for March. 

However, they expect Dogecoin to wait for another five years before it can eventually hit the $0.9246 target by March 2030. By this time, they project that DOGE will reach a maximum target of $0.948. 

Meanwhile, Dogecoin may hit the $0.9246 target sooner, driven by strong institutional adoption via the upcoming DOGE ETFs. Nonetheless, investors should be cautious and not rely on this analysis as investment advice. 

How High XRP May Rise Before the 2028 Bitcoin Halving

XRP could reach double-digit prices by the next Bitcoin halving in the best-case scenario or remain lower in a bearish scenario.

XRP remains one of the top crypto assets that many in the industry pay close attention to its price performance. As of now, XRP is trading at $2.35, down 7% over the past 24 hours. However, many project a future where XRP could reach double-digit values.

The crypto market follows a four-year cycle, with prices dipping and rising, often guided by Bitcoin’s halving events. Historically, XRP’s price has mirrored the seasonality of Bitcoin halvings.

Bitcoin’s most recent halving occurred in 2024, and XRP’s price has surged since then. Now, with 1,133 days until the 2028 Bitcoin halving, XRP holders are interested in gauging how the token will perform in the meantime.

Bitcoin 2028 halving countdown by CoinGecko

This analysis will rely on XRP’s historical performance between Bitcoin halvings and expert suggestions.

XRP Rise from 2016 to the 2020 Bitcoin Halving and from 2020 to 2024

Bitcoin’s 2016 halving took place on July 9, with BTC trading as low as $633. By the next halving, its price had surged to nearly $10,000—a 15X increase.

During the 2016 halving, XRP was at just $0.006624. By May 11, 2020, when Bitcoin experienced its next halving, XRP had risen to $0.2002. This marked an increase of nearly 2,922% from its 2016 lows.

However, by the 2024 halving on April 20, XRP was trading at $0.5299. From the previous halving’s lows to the 2024 halving highs, XRP only surged by 194%. In contrast, Bitcoin’s price increased by 681% from its previous halving lows to the 2024 halving highs. 

Many attribute XRP’s relatively underwhelming performance between 2020 and 2024 to the SEC lawsuit. While XRP triumphed in the lawsuit in 2023, it wasn’t until November 2024 that its price began to show an uptrend.

How Will XRP Perform Between Now and the 2028 Halving?

Since the 2024 halving, XRP’s price is up 370%, trading at $2.35. The question now is how XRP will perform until the April 2028 Bitcoin halving.

If XRP mirrors its performance from 2016 to 2020, where it surged 2,922%, its price from the 2024 halving lows would reach $15.10.

However, if it follows the 2020 to 2024 trend, where it surged 194%, its price from the April 2024 halving low of $0.4995 would rise to $1.47 by the 2028 halving. This projection suggests a bearish performance for XRP over the next three years.

Meanwhile, from the current level of $2.35, this would bring XRP’s price to around $6.91 by 2028.

AI Projection for XRP by 2028

According to ChatGPT, if XRP follows a bearish cycle, it may reach $6-$11 by 2028. However, if it replicates the 2016-2020 surge, it could hit $22.

With continued bullish adoption and utility growth, XRP might rise to between $30 and $40+ in the next few years. In extreme bullish scenarios, driven by global adoption and institutional use, XRP could surpass $44.

XRP price projections by ChatGPT

Here’s How Much 1 XRP Will be Worth if XRP Reaches Bitcoin Market Cap

0

The price of 1 XRP could be significantly appreciated if the altcoin grows to reach the market cap of Bitcoin, the pioneering crypto asset.

Currently, XRP has been subject to the bearish pressure impacting the broader crypto market, having collapsed by a substantial 16.4% since Feb. 24, a downturn that has had a massive bearish impact on its price. For context, this marks the asset’s highest weekly drop since late September 2024.

XRP Market Cap Struggles 

As XRP trades around the $2.30 region, its market cap has collapsed from the $195 billion peak in mid-January to a current figure of $134 billion, reflecting a loss of $61 billion worth of valuation over the past few weeks.

Notably, this bearish turn of events has dealt a blow to XRP’s ambition to overtake Ethereum (ETH) as the second-largest crypto asset. While previous analyses had assessed how much XRP would be worth if it overtook ETH, The Crypto Basic recently evaluated the price of the altcoin if it reached the market cap of Bitcoin, the world’s largest crypto asset.

For context, Bitcoin currently boasts a market cap of $1.743 trillion. With a circulating supply of 19.83 million tokens, this translates to a unit price of $85,797 per BTC. Meanwhile, as highlighted, XRP’s all-time high market cap stands at $195 billion, attained in January 2025. At this valuation, the worth of 1 XRP was $3.20.

Despite the correction that has since ensued, with XRP currently changing hands at $2.30, several analysts believe the altcoin is on the verge of an impressive comeback story. Amid the optimism, speculation of XRP rivaling Bitcoin has emerged. 

The worth of 1 XRP if It Reaches the Bitcoin Market Cap

In January, analyst Bobby A suggested that discussions around XRP surpassing Bitcoin in market cap ranking would dominate the scene once the asset overtakes Ethereum. Notably, this would align with his ultimate take-profit target of 0.001 BTC for XRP.

However, should XRP indeed hit Bitcoin’s market cap of $1.743 trillion, the worth of 1 XRP would skyrocket to unimaginable levels. For context, XRP currently has a circulating supply of 57.94 billion tokens. At this supply, the unit price of 1 XRP would surge to $30 on a $1.743 trillion market cap.

Notably, this would mark a remarkable 1,027% increase from XRP’s current price of $2.30. Some analysts have already predicted a possible XRP rise to the $30 mark. For instance, last November, CryptoBull projected a run to $5 and from there to $30. Trader Ralston Maximus also believes the $30 target is not ridiculous.

Here is Estimated XRP Five Figure Price if Ripple Handles $30 Trillion Daily

0

Grok, the AI chatbot from xAI, estimates XRP price if Ripple handles a massive $30 trillion volume in daily transactions.

Majeed, a notable figure within the Saudi Arabian XRP community, triggered this assessment with a recent inquiry. He asked about the potential value of XRP if Ripple released 1 billion XRP monthly from its escrow while facilitating $30 trillion in daily transactions. 

For context, Ripple typically releases 1 billion XRP from escrow every month, but re-locks 800 million tokens. Interestingly, in its response, Grok determined that XRP would need to reach a value of $30,000 per coin to support an ambitious framework involving $30 trillion in daily transactions. 

Grok’s Assessment Approach

Notably, to provide a comprehensive analysis, the AI chatbot discussed the relationship between transaction volume, money supply, and circulation velocity. 

Grok converted the daily transaction volume into a monthly figure for consistency with the escrow release schedule. With $30 trillion processed daily and assuming 30 days per month, the AI calculated a monthly transaction volume of $30 trillion multiplied by 30, equaling $900 trillion.

Then, to evaluate XRP price, Grok used the quantity theory of money, expressed as transaction volume equaling money supply multiplied by velocity. Here, the transaction volume stands at $900 trillion per month. 

Further, the money supply represents the number of XRP available multiplied by its price per unit, while velocity represents the frequency of each XRP’s use within the period. Rearranging this, Grok derived the price per XRP as the transaction volume divided by the product of the XRP supply and velocity.

Notably, the AI chatbot interpreted the 1 billion XRP released monthly as the operative supply for its calculation. However, it acknowledged that there was ambiguity regarding whether this figure constitutes the total supply or an increment to an existing pool. 

For context, XRP’s total supply is 100 billion, with 57.94 billion in circulation at press time. Nonetheless, sticking to Majeed’s emphasis on the monthly release, Grok proceeded with 1 billion XRP as the supply base.

XRP Price Ranges from $300 to $30,000

Now, given XRP’s rapid settlement capabilities, Grok assumed each XRP could be used once daily, totaling 30 uses per month. As a result, the calculation became $900 trillion divided by 1 billion XRP multiplied by 30, yielding $900 trillion divided by 30 billion, or $30,000 per XRP. 

To test this, Grok discussed alternative velocities. If each XRP were used twice daily, the monthly velocity would rise to 60, adjusting the price to $900 trillion divided by 60 billion, equaling $15,000 per XRP. 

A more aggressive assumption of five uses per day, or 150 per month, further reduced the price to $900 trillion divided by 150 billion, resulting in $6,000 per XRP.

Grok also considered the impact of a larger supply. Using a circulating supply of 50 billion XRP with a velocity of 30, the price dropped to $900 trillion divided by 1,500 billion (50 billion times 30), equaling $600 per XRP. Doubling the velocity to 60 with this supply adjusted the price to $300 per XRP. 

This suggests XRP price could range from $300 to $30,000 depending on velocity and money supply. However, it is important to note that this remains speculative. Notably, a $30 trillion daily transaction volume is within the realms of impossibility at current market conditions.