Home Blog Page 900

TRUMP Meme Coin Under Fire as Democratic Lawmakers Push to Ban Presidential Crypto Coins

0

Democratic legislators are targeting the controversial TRUMP meme coin, launched by President Donald Trump, with a bill to prevent politicians from launching crypto coins.

This move came amid substantial financial losses investors have encountered from exposures to the TRUMP meme coin. Last month, the TRUMP meme coin and a similar coin by Melania Trump quickly gained attention. They reached historic milestones with multi-billion-dollar valuations just hours after launching.

At one point, TRUMP ranked as the second-largest meme coin, trailing only Dogecoin. However, as the hype subsided, the price continued to plummet, with TRUMP falling by 82% from its all-time high.

This downturn resulted in significant financial losses for many investors. As The Crypto Basic reported, the overwhelming majority of TRUMP buyers lost money.

The decline has caught the attention of lawmakers, including California Democrat Rep. Sam Liccardo. Liccardo is now leading a new effort to curb such financial ventures among U.S. officials.

The MEME Act

Specifically, Rep. Liccardo is introducing the MEME Act, officially the Modern Emoluments and Malfeasance Enforcement (MEME) Act.

This bill would forbid the president and vice president from endorsing, issuing, or sponsoring any financial asset, including meme coins. It will also prohibit members of Congress, senior executive branch officials, and their families from similar activities.

Liccardo argues that the Trump family’s involvement in launching these cryptocurrencies amounted to financial exploitation. He stressed that they capitalized on their political influence for personal gain.

The legislation aims to prevent federal officials from profiting off digital assets, such as stocks or cryptocurrencies, as it could create conflicts of interest or invite corruption.

Moreover, Liccardo has expressed concerns about the potential for insider trading and foreign influence over U.S. politics, especially given the global financial reach of such coins.

Challenges Ahead for the MEME Act

Despite Liccardo’s strong stance, the MEME Act faces significant obstacles in the current political landscape.

With Republicans holding majorities in both the House and Senate, the bill is unlikely to gain traction in the near term. However, Liccardo remains committed to pushing the bill forward, hoping to gain wider support under a future Democratic majority.

Liccardo’s proposal also includes retroactive provisions, meaning it would apply to coins like TRUMP that were issued before the bill’s potential enactment. 

Violators of the proposed law could face criminal and civil penalties to deter federal officials from profiting off any financial assets linked to their political roles.

Bitcoin Oversold for the First Time Since August 2024: Rebound Incoming?

0

Ali Martinez suggests that Bitcoin is now in oversold conditions for the first time since August 2024.

Over the past few days, the crypto market has been thrown into a panic as Bitcoin plunged to three-month lows near the $80,000 price point amid macroeconomic and geopolitical tensions. However, it may not be all doom and gloom for the market.

Bitcoin Oversold

Amid the recent market sell-off, prominent crypto analyst Ali Martinez has suggested that Bitcoin is now in oversold conditions for the first time since August 2024.

Martinez asserted this in an X post on Thursday, February 27, citing the relative strength index, which has dropped below 30. As the analyst highlighted, Bitcoin followed up with a 33% price surge the last time this happened.

Bitcoin RSI in oversold territory
Bitcoin RSI in oversold territory. Source: Ali Martinez

If history repeats, this could suggest a potential near-term rally to near the $115,000 price point from current levels of about $86,200.

Still, Bitcoin’s rout may not necessarily be over. In a note to investors on Wednesday, February 26, Geoffrey Kendrick, Head of Digital Asset Research at Standard Chartered, warned that “the big capitulation” had yet to happen.

Citing that exchange-traded fund holders were holding significant losses, the analyst argued that he expected more selling pressure from outflows from these funds.

Meanwhile, CryptoQuant CEO Ki Young Ju has implied that Bitcoin may still have some room to fall as 30% drops from all-time highs are typical in bull markets. So far, the asset has dropped only about 25%. Young Ju highlighted that a 30% drop could take the asset to $77,000.

Nonetheless, Bitcoin is ranging near the lows around the $85,000 level at the time of writing.

BlackRock Sees Outflows of $441M in Bitcoin and $71M+ Worth of Ethereum Amid Market Sell-Off

0

BlackRock witnessed outflows from its Bitcoin and Ethereum ETFs today, moving a substantial portion of its assets to crypto exchange Coinbase Prime.

The panic in the cryptocurrency market has intensified, with the Crypto Fear and Greed index dropping to 10, a level last seen in 2022. Notably, the Solana meme coin fallout and Donald Trump’s recent tariff vows have spurred this skepticism.

Notably, the sell-off has spilled over to diamond-handed asset manager BlackRock, which has resumed liquidating its Bitcoin and Ethereum stash. 

BlackRock Dumps Fresh Bitcoin and Ethereum

Data from Arkham shows that the issuer of the fastest-growing fund in ETF history continued its selling spree today. BlackRock shifted 5,100 BTC ($441 million) and 30,280 ETH ($71.85 million) to the Coinbase Prime deposit address.

The prominent asset manager transferred the Bitcoin in batches of 300 BTC over 17 transactions, starting around 11:15 (UTC) on Thursday. Before then, the address tied to BlackRock had moved 30,280 ETH over four transactions to the same recipient.

BlackRock Bitcoin Sales

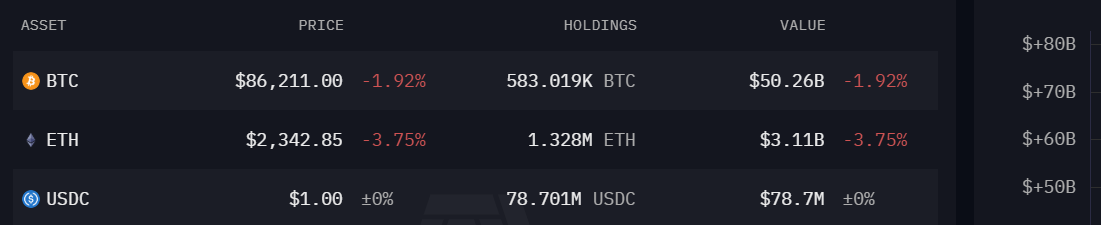
Nevertheless, BlackRock still holds significant amounts of both assets. At the time of writing, the leading asset manager by assets under management (AUM) holds 583,019 BTC ($50.26 billion) and 1.328 million ETH ($3.11 billion).

BlackRocks Bitcoin and Ethereum Holdings

Other Asset Managers Also Seeing Outflows

Meanwhile, the sales reflect the outflows recorded in the US Bitcoin and Ethereum spot ETFs. Other asset managers also sold substantial amounts of the assets in the past 24 hours. For context, the Bitcoin products sold $754 million worth of the asset yesterday, with BlackRock leading the dumps.

The BlackRock iShares Bitcoin Trust (IBIT) sold $418 million in BTC yesterday as investors massively withdrew funds from the issuer. Other notable sales came from the Fidelity Wise Origin Bitcoin Fund (FBTC) and the Ark 21 Shares Bitcoin ETF (ARKB), which recorded an outflow of $145.7 million and $60.46 million, respectively.

Moreover, BlackRock’s Ethereum fund (iShares Ethereum Trust) also led outflows in the US Ethereum spot ETFs yesterday, dumping nearly $70 million worth of the asset. Fidelity, Grayscale, and Bitwise saw outflows culminating in a combined $24.5 million.

At the time of writing, Bitcoin trades at $85,712 and Ethereum at $2,329.

Largest Bitcoin Holders Buy the Dip with $1.28 Billion as the Fear & Greed Index Hits Rock Bottom

0

While Bitcoin price continues to plummet, whales are seizing the opportunity to accumulate 15,000 BTC as the Fear & Greed Index drops to an extreme low of 10.

Today, Bitcoin extended its sharp decline, reaching a multi-month low just above $82,000 before recovering slightly. The asset’s attempted rebound is now facing resistance at the $86,900 mark.

Meanwhile, data from IntoTheBlock shows that large Bitcoin holders have been increasing their positions. Wallets holding at least 0.1% of Bitcoin’s circulating supply have accumulated nearly 15,000 BTC at prices below $90,000.

This equates to approximately $1.28 billion in new acquisitions. Historically, such whale activity has coincided with periods of strong market confidence and potential price rebounds. The growing involvement of institutional investors suggests they may be positioning for a market turnaround.


Notably, this massive acquisition comes amid Bitcoin’s price dropping 12% over the past few days. The persistent downturn heightened market uncertainty, with many fearing the onset of a bear market.

In particular, the crypto market’s Fear & Greed Index currently stands at 10 out of 100, signaling Extreme Fear, the lowest level recorded since 2022. Historically, such levels have marked key price bottoms, with long-term investors viewing extreme fear as a potential buying opportunity.

Fear and Greed Index
Crypto Fear and Greed Index

Key Figures Weigh in on Market Movements

Notably, public commentary from influential figures also reflects the prevailing institutional sentiment around Bitcoin. In a post on X, Eric Trump, son of U.S. President Donald Trump, commented on the crypto market downturn, urging investors to “Buy the dips.” His statement quickly gained attention among Bitcoin supporters who see corrections as buying opportunities.

Michael Saylor, Executive Chairman of Strategy, described the Bitcoin price drop as a “flash sale” opportunity. Saylor also responded to Eric Trump’s remarks, emphasizing the importance of market volatility in long-term investment strategies. “Volatility is a gift to the faithful,” he said.

Analysts Assess Bitcoin’s Market Cycle

While sentiment among investors and institutions remains divided, analysts continue to evaluate Bitcoin’s broader market cycle. Ki Young Ju, CEO of CryptoQuant, addressed concerns over the ongoing market downturn. According to him, it is “way too early to panic.”

He noted that 30% corrections are common in Bitcoin bull market cycles, referencing the 2021 cycle when Bitcoin dropped by 53% before reaching a new all-time high.

Young Ju highlighted that Bitcoin’s maximum downside in this cycle could be around $77,000, aligning with a 30% retracement from its all-time high. Additionally, he suggested that Bitcoin would only confirm entry into a bear market if it falls below the estimated miner cost basis of $57,000, as calculated on February 19.

Shiba Inu Introduces New Contest That Could Burn 10B SHIB Daily

0

Shiba Inu’s ecosystem team has introduced a new Shiba Eternity game mode where players battle for SHIB rewards and contribute to the ongoing burn campaign. 

The team, through the marketing lead Lucie, introduced the Shiba Eternity mode, dubbed Duel Mode, a player-versus-player mode. The newly launched mode requires two players to battle each other within the collectible card game (CCG), with one user emerging victorious. 

This initiative aims to encourage player engagement through SHIB rewards and also contribute to the ongoing SHIB burn campaign. 

Duel Mode Details 

Players confident in their Shiba Eternity skills can participate in the contest by paying a registration fee of 50,000 SHIB each. The total pool for each duel is 100,000 SHIB, comprising the two players’ entry fees. 

After the contest, the winning player will receive 80,000 SHIB (80% of the total pool). Additionally, 10,000 SHIB, or 10% of the total pool, is burned, reducing the circulating supply of Shiba Inu tokens. The remaining 10,000 SHIB (10%) will be deducted as platform fees to support Shiba Eternity’s future development. 

According to Lucie, the player-versus-player mode is only available on the Web3 version of Shiba Eternity. This version is still in beta, with no official date for the final release. 

How Shiba Eternity Duel Can Burn 10B SHIB Daily 

Meanwhile, Lucie revealed an ambitious goal that could see 10 billion SHIB tokens burned daily through Shiba Eternity Duel Mode. She emphasized that the goal is to record millions of Shiba Eternity duels daily rather than thousands. 

If a minimum of 1 million Shiba Eternity duels occur daily, this could permanently burn 10 billion SHIB per day from Shiba Inu’s circulating supply. These 10 billion SHIBs are worth $147,000 at the current exchange rate of $0.00001471. 

The figure could soar to 70 billion SHIB ($1.03 million) in a week and 280 billion tokens ($4.12 million) monthly. This move would drastically reduce Shiba Inu’s circulating supply and potentially increase the value of the remaining tokens. 

In the meantime, Shiba Inu’s burn rate is up 1,335% following the incineration of 30,183,163 (30.18 million) SHIB over the past day. In total, 410.74 trillion SHIB have been permanently burned, leaving Shiba Inu with a supply of 589.25 trillion tokens. 

Dogecoin Open Interest Down 67% in Further Sign of Waning Interest Amid Market Uncertainty

0

Open Interest for Dogecoin futures has tanked over 67% in the past three months. 

This is according to Glassnode data shared by prominent crypto analyst Ali Martinez on Thursday, February 27. Specifically, open interest in the popular memecoin has dropped from December 8 highs of $4.07 billion to just $1.33 billion.

DOGE open interest
DOGE open interest. Source: Ali Martinez

Open interest refers to the total number of outstanding contracts in derivatives markets. It can often be used to gauge market sentiment, with low open interest usually signaling reduced optimism about an asset.

The crash in Dogecoin open interest is the most recent indicator of waning interest in the memecoin in recent days.

On Tuesday, February 25, Martinez disclosed that Dogecoin network activity had dropped 95%. Specifically, the number of active addresses on the network has fallen from highs of nearly 1.3 million in November 2024 to about 130,000.

The dried-up demand comes as recent uncertainty sparked by inflation and trade war concerns have sent investors risk-off, leading to a flight of capital from speculative assets like memecoins.

Amid these uncertain conditions, Dogecoin has plunged over 59% from December 2024 highs of $0.48442 to lows of $0.19564.

Nonetheless, analysts remain optimistic about the chances of a near DOGE rally to stratospheric heights. In the latest instance highlighting this, highly followed crypto analyst “CryptoELITES” has recently suggested that DOGE is set to rally to the $5 price point, citing a bullish cup and handle pattern.

However, the memecoin is exchanging hands for $0.20 at the time of writing.

There’s Still Hope for a New All-Time High If XRP Holds This Support

0

Analysis suggests that a possible XRP surge to a new all-time high remains intact if it continues to hold crucial trendline support.

XRP moved one place downward in the cryptocurrency rankings by market cap following its recent price slump. The XRPL native token’s 17% and 28% weekly and monthly drawdowns have ensured that stablecoin Tether flipped it to become the third-largest asset by market valuation.

Nonetheless, recent analysis indicates a possible rebound looms for XRP. The commentary highlighted the crucial support the asset must hold for a quick swing to new price discoveries.

Bullish Structure Remains Intact

Despite recent claims that a highly accurate indicator has flashed a sell signal on the XRP 2-week chart, analyst Crypto Michael suggests that its bullish structure remains intact. In a Feb. 26 commentary, the market watcher stated that there are possibilities that the XRPL native token could still attain new all-time highs in the near term.

His commentary highlighted a crucial demand wall that XRP has held despite the substantial price decline. An attached chart shows that the digital asset has stayed true to a support line in a developing symmetrical price structure.

XRP Price Analysis/Crypto Michael

While Crypto Michael asserted a further sideways trend in the remaining days of this month, he predicted that XRP would take a decisive price action in March. However, if the coin continues to hold the support line, its next trend could be a surge past its all-time high to unprecedented prices.

Nonetheless, the analyst identified the price mark XRP needs to break to activate this surge from the current market price. He noted that a break above the upper resistance of the symmetrical structure at $2.60 would spur a sustained drive to new highs.

Bulls Still on Top

Meanwhile, another commentary has highlighted XRP’s bullishness despite recent corrections. Prominent market analyst Javon Marks noted that bulls are still on top of their game and would “be coming to dominate” soon enough.

In an X post, he pointed to a massive lower price rejection last seen in XRP’s price chart since the 2017/2018 cycle. Marks showed the perfect candlestick and volume combo seen when XRP bounced from $1.7936 to close at $2.7024 on February 3.

XRP Candlestick/Volume Combo per Javon Marks

As a result, he insinuated that though bears appear to be driving prices lower, bulls are still in the pole position and will soon show dominance. Notably, this follows the analyst’s earlier prediction that XRP would surge over 40x to $99.

In the meantime, XRP trades at $2.22, rebounding slightly from yesterday’s lows.

Shiba Inu Price Breakout Holds with Analyst Targeting 450% Gains

0

Analyst Javon Marks sees Shiba Inu holding its breakout, targeting $0.000081, a 450% gain.

Shiba Inu (SHIB) has recently shown signs of recovery following a volatile period. Over the past 24 hours, the meme coin gained 1.4%, reflecting short-term bullish momentum. However, its seven-day performance remains negative, down 4.6%. 

Additionally, the 14-day and 30-day trends show losses of 10.1% and 22.8%, respectively. During this press, SHIB is trading near $0.00001444.

Indicators Suggest Potential Upside

While SHIB struggles to recover, an analyst on X, Javon Marks, identified a long-term breakout that took place in early 2023, marked by SHIB breaching a descending trendline.

A subsequent retest of the trendline confirmed the breakout as the price rebounded, signaling exhaustion among sellers and increasing buyer control. Later, a hidden bullish divergence on the chart, pointing to higher prices in late 2025.

The analyst noted that SHIB continues to maintain its breakout from late 2022 and early 2023. Despite recent volatility, the broader trend remains positive. Based on this breakout, the projected price target stands at $0.000081, representing an increase of over 450% from current levels.

Shiba Inu Institutional Accumulation

Elsewhere, Shiba Inu’s ownership distribution chart offers insights into market behavior. Over the past 30 days, large holders, commonly referred to as whales, increased their holdings by 0.35%. This accumulation suggests growing confidence among institutional and high-net-worth investors, who often accumulate before major price moves.

Shiba Inu Historical Concentration

Meanwhile, mid-sized holders increased their SHIB positions by 0.30% over the same period. This investor category typically consists of strategic buyers focused on medium-to-long-term gains. In contrast, retail participation declined by 0.67%, suggesting smaller investors exited the market. Historically, a reduction in retail activity can indicate a shift in ownership toward more stable hands.

Price Weakness Despite Strong Ecosystem

Separately, TradingView analyst Paul Endeo provided insights into SHIB’s recent price weakness despite a strong ecosystem. He identified a possible head and shoulders pattern and bearish network conditions as contributing factors. Declining institutional interest, weak network growth, and diminishing profitability among holders have weighed on SHIB’s price.

Endeo emphasized the importance of Shiba Inu’s current support level at $0.0000147. A successful hold at this level could trigger a 20% price rebound toward this month’s high of $0.00001718. However, failure to maintain support may result in a drop toward $0.00001261.

Dogecoin Survives the Crash: Will DOGE Rise to $0.25?

Dogecoin (DOGE) aims for a potential double-bottom breakout rally as bulls hold the fort at $0.20. 

As the crypto market has witnessed a massive fall over the past three days, Dogecoin has held strong at the $0.20 psychological mark. After the recent crash, short-term consolidation above this key support hints at a potential comeback for Dogecoin. 

Over the past 24 hours, meme coins like Shiba Inu and Pepe have recovered by 3.03% and 2.78%. Furthermore, double-digit gains are also seen in tokens like DogWifHat and ai16z. This reveals resurfacing support for meme coins at lower levels. Currently, Dogecoin is at a similar crossroads.

Dogecoin trades at a market price of $0.2092, holding a market cap of $30.91 billion. This accounts for more than 50% of the memecoin segment capitalization of $58.41 billion. Will a potential Dogecoin comeback revive bullish momentum in meme coins?

Dogecoin Liquidation Storm Hits $10M 

Amid the heightened market volatility, Dogecoin liquidations have surged to $10.01 million over the past 24 hours. Long liquidations account for $7.4 million, while short liquidations are limited to $2.61 million.

Dogecoin

The rising liquidations and declining price trends have driven the funding rate up to 0.0096%. This highlights a significant premium that bullish traders must pay to maintain their long positions.

Currently, Dogecoin’s long-to-short ratio remains at 0.9704, reflecting a slightly higher number of bearish positions. However, traders on major exchanges like Binance and OKEx remain optimistic, reporting long-to-short ratios of 3.755 and 5.14, respectively.

Meanwhile, Dogecoin’s open interest stands at $1.33 billion, marking a 2.37% increase in the past 24 hours. However, it is down by 67% in the last three months from the $4.07 billion peak.


DOGE Eyes Double-Bottom Reversal

The Dogecoin price trend struggles to maintain dominance above its $0.20 psychological support amid increased volatility. With multiple low-price rejections, Dogecoin has formed a double-bottom pattern with a neckline at $0.2139. 

Dogecoin Price Chart

Over the past 12 hours, Dogecoin created three consecutive bullish candles, marking a price surge of 5.27%. As Dogecoin is on the verge of reversing last night’s fall, the chances of a bullish pattern breakout are significantly rising.

In case of a breakout rally, the uptrend will likely challenge the 50-EMA line at $0.2294, close to the overhead trend line. On the flip side, crucial support remains at the $0.1953 base level. 

Closing below this support could push Dogecoin towards the $0.15 psychological support.

Bitcoin Takes a Nosedive: Is $75K the Next Stop?

Bitcoin (BTC) price hits its lowest level in 100 days and warns of a potential drop to $75k as institutional support declines with rising ETF outflows. 

With a 4.42% drop in the total crypto market cap last night, Bitcoin tested a new low of $82,133. This marks the lowest price of Bitcoin since November 11, 2024. 

After three consecutive days of selling, Bitcoin trades at a market price of $85,961, with an intraday recovery of 2.25%. As Bitcoin struggles at the 200-day EMA line, is a potential crash to $75,000 imminent?

Bitcoin Hits The Floor

In the daily price chart, the BTC price trend reveals a consolidation breakdown as it breaches the 78.6% Fibonacci level at $91,783. Over the past few days, the increased supply pressure has created three consecutive bearish candles. 

Bitcoin price chart
Bitcoin price chart

The downfall marks the consolidation range breakdown and crashes under the 200-day EMA line. With the recent low at $82,133, Bitcoin nearly touched the 61.8% Fibonacci level at $81,857. 

Breaching under the 200-day EMA line momentarily, Bitcoin takes a short breath of recovery with an intraday recovery of 2.60%.  With the consolidation range breakdown, the short-term recovery hints at a potential retest toward the broken 78.6% Fibonacci level.

Furthermore, the daily RSI line entered the oversold region during the downfall. With the intraday recovery, the RSI line resurfaces above the oversold boundary line, supporting the chances of a potential retest. 

However, the downfall has influenced the downtick in the 50-day EMA line. This warns of a potential negative crossover with the 100-day EMA line. 

A bearish crossover in the average line could signal another selling spree, as it triggers a sell signal for traders.

Bitcoin ETFs Bleed, Outflow Hits $754M

With the declining trend, institutional support continues to weaken for Bitcoin. On February 26, the daily total net outflow in the US Bitcoin spot ETFs rose to $754.53 million. 

Bitcoin Spot ETFs
Bitcoin Spot ETFs

This marks the second-biggest outflow in the history of US spot Bitcoin ETFs, following the $1.14 billion outflow on Tuesday. So far in February, the U.S. Bitcoin spot ETFs have recorded only four days of minor inflows, while the outflows have now marked seven consecutive days. 

Is Bitcoin Headed For $75k?

With the declining trend gaining momentum, the broader market anticipates a steeper correction in Bitcoin. Furthermore, the declining institutional support adds fuel to the bearish trend. 

Therefore, a breakdown below the 61.8% Fibonacci level would likely push Bitcoin toward the 50% Fibonacci level at $75,535. However, with the recent intraday recovery above the 200-day EMA line, if Bitcoin manages to close above this line, a potential retest of the 78.6% Fibonacci level at $91,783 seems likely.