Home Blog Page 95

Dogecoin Retests Triangle Apex That Starts a Parabolic Rally Every Time

0

Dogecoin has repeated a chart structure that has appeared before some of its biggest historical moves, with analysts pointing to a possible price rally.

Trader Tardigrade highlighted this recurring triangle pattern visible on the monthly Heikin Ashi chart in a June 14 X post. According to him, this setup is notable because it resembles formations that emerged ahead of the 2017 and 2020 breakouts to unprecedented prices.

Dogecoin Repeats a Familiar Multi-Year Pattern

The analyst identified a clear pattern that Dogecoin (DOGE) has followed several times now. A triangle compression starts, then a breakout and apex retest, before a parabolic expansion follows.

He further highlighted three different periods where Dogecoin spent years compressing inside a symmetrical triangle before eventually breaking out. The first formation developed between 2014 and early 2017, with the token breaking out from around $0.000208 in March 2017 to $0.0187 in January 2018.

The second stretched from the 2018 high before a breakout in July 2020. The full bullish rally started in November 2020, sending DOGE from $0.0025 to its current all-time high of $0.74.

In both cases, prices gradually narrowed between rising support and falling resistance before reaching the triangle’s apex. Rather than immediately launching after the breakout, Dogecoin first revisited the breakout zone, testing it as support before beginning a much larger advance.

The latest cycle appears to be following a similar path. After breaking out in October 2024 to the peak of $0.484 in December 2024, Dogecoin entered a prolonged correction that pushed it back toward the convergence point of its multi-year triangle. The apex retest occurred following the drop to $0.077 two weeks ago.

This places the current price action near the same structural level that previously acted as support for major rallies.

Repeating Dogecoin Pattern/Trader Tardigrade

Can History Repeat for Dogecoin?

Technical analysts often view an apex retest as a critical moment within a broader market cycle. When a former resistance structure is revisited and successfully defended, it can signal that sellers are losing control while longer-term buyers begin stepping back into the market.

The chart shows this behavior occurring in three separate cycles. In 2017, Dogecoin retested the apex area before beginning a sharp rally. A nearly identical sequence unfolded in 2020, with price returning to the breakout zone shortly before the well-known rally that followed.

Tardigrade suggests that if the historical pattern remains intact, Dogecoin could attempt another move toward higher resistance zones over the coming months. The chart shows a possible parabolic expansion towards the $3 mark, representing a staggering 3,310% increase from the current market price of $0.088.

However, confirmation remains important. Dogecoin still needs to hold above the retested support region and demonstrate renewed buying interest before any larger move can develop. Buying activity seems to be already picking up, with whales procuring 30 billion DOGE in recent weeks.

Nonetheless, failure to maintain the retested area would weaken the comparison with prior cycles.

Historical Pattern Shows When XRP Could Finally Reach Its Bottom, Points to $0.57 Floor

0

Historical patterns reveal when XRP could finally reach its bottom for the ongoing market downturn, suggesting that prices could still go lower.

XRP has continued to nurse losses this year despite the crypto market receiving a boost from the recent peace deal between the United States and Iran. While XRP gained 4.8% over the weekend, it remains down 11% this month and 35% year-to-date.

As investors anticipate XRP’s cycle bottom and the start of a potential reversal, pseudonymous yet notable market commentator PyraTime overlaid two XRP bear cycles to ascertain that the asset could finally find a bottom in Q4 2026.

Similarities Between 2022 and 2026 XRP Bear Cycles

In a recent analysis, PyraTime compared XRP’s current bear market with the one that played out in 2022. During the comparison, he aligned both cycles using their pre-bull-run lows and then measured how prices behaved over time.

According to his findings, both cycles followed a very similar path. Around 680 to 700 days after their respective bear market bottoms, XRP traded roughly 70% below its cycle peak in each case.

In the previous cycle, XRP fell to about $0.58 in January 2022. This decline represented a 69.7% drop from the earlier peak of $1.96. The move came roughly 680 days after XRP reached its March 2020 low of $0.1013 during the COVID-driven market crash.

XRP Cycle Bottom Comparisons PyraTime
XRP Cycle Bottom Comparisons | PyraTime

The current cycle mirrors this pattern. Notably, XRP dropped to $1.05 on June 6, 2026, which placed it about 70.1% below its July 2025 high of $3.60. According to the analyst, this decline occurred about 701 days after the June 2022 market bottom of $0.2910.

Why XRP May Not Have Reached Its Lowest Point Yet

However, despite the recent massive crash to $1.05, PyraTime believes investors should not assume that the decline marked the final bottom.

He pointed out that the previous cycle did not end when XRP first reached the 70% drawdown level. Instead, the market continued falling for several more months before finding its true low.

The analyst noted that XRP reached its final bear market bottom 827 days after the March 2020 COVID low. This bottom arrived on June 18, 2022, when XRP traded around 84% below its previous peak, having collapsed to $0.2910.

This means the move to $0.58 in January 2022 was not the ultimate low. However, it served as an earlier stage in the broader decline before the market eventually reached its bottom months later.

When PyraTime applied the same 827-day count to the current cycle, the timeline pointed to Oct. 10, 2026. Interestingly, this date falls exactly one year after the sharp October 2025 flash crash that briefly sent XRP down by about 56%.

Historical XRP Trend Suggests October-November Bottom Window

Based on these comparisons, PyraTime argued that XRP could still have more downside ahead. If the current cycle continues to follow the same general pattern as the previous one, the most likely period for a major bottom would fall between October and November 2026.

He also noted that the current cycle appears to be moving about 3% slower than the previous one. While the similarities remain strong, investors should see the comparison as a historical guide, not a prediction of future price action.

With this model, the analyst identified a possible bottoming range between Oct. 10 and Nov. 5, 2026. According to him, if the pattern continues to hold, XRP could decline toward the $0.57 area before finally establishing a long-term floor.

Top Meme Coins by Market Cap in 2026 (Updated List)

What Is the Total Market Capitalization of Meme Coins in 2026?

The meme coin market entered 2026 amid a broader crypto bear market. Meme coins have been hit especially hard because they are among the most speculative assets in the cryptocurrency sector. As investors moved away from riskier tokens, the total meme coin market capitalization declined significantly.

From its peak of more than $75 billion, the meme coin sector’s market capitalization has fallen to approximately $30 billion, representing a decline of more than 50%.

Meanwhile, the sector remains under pressure and has yet to show strong signs of recovery. Weak market sentiment, institutional selling, and Bitcoin’s close correlation with traditional financial markets have created a challenging environment for meme coins.

One positive development came in March 2026, when the SEC and CFTC jointly classified Dogecoin as a digital commodity. The decision provided greater regulatory clarity and could help increase institutional interest in major meme coins over time.

Ranking the Top Meme Coins by Market Cap

The table below reflects data from CoinMarketCap as of June 9, 2026.

Meme Rank Token Ticker Market Cap Blockchain
1 Dogecoin DOGE $13.27B Own chain (PoW/Scrypt)
2 MemeCore M $3.93B MemeCore Layer-1 (EVM)
3 Shiba Inu SHIB $2.77B Ethereum (ERC-20)
4 Pepe PEPE $1.15B Ethereum (ERC-20)
5 Siren SIREN $891M BSC
6 Pudgy Penguins PENGU ~$424M Solana (SPL)
7 Official Trump TRUMP ~$392M Solana (SPL)
8 Bonk BONK ~$386M Solana (SPL)
9 SPX6900 SPX ~$281M Ethereum/BSC
10 BUILDon B ~$275M BSC

Deep Dive: The Top 5 Largest Meme Cryptocurrencies

1. Dogecoin (DOGE): The Undisputed Market Leader

Key Metrics (June 2026)

  • Market cap: $13.27 billion
  • Circulating supply: ~154.5 billion DOGE
  • All-time high: $0.7316

Dogecoin is the largest and most established meme coin in the crypto market. It was created in 2013 by Billy Markus and Jackson Palmer as a joke based on the popular Doge Shiba Inu meme, but it has since grown into a major cryptocurrency with a strong global community.

As of June 2026, DOGE trades between $0.085 and $0.10, with a market capitalization of approximately $13.2 billion and a circulating supply of roughly 154.5 billion coins. It remains one of the top 10 cryptocurrencies by market capitalization.

A major boost came in March 2026 when U.S. regulators classified Dogecoin as a digital commodity. This classification makes it easier for institutions to invest and could open the door for additional DOGE ETFs.

Unlike many meme coins, Dogecoin runs on its own proof-of-work blockchain and has no maximum supply limit. Approximately 5 billion new DOGE are created each year. The coin is primarily used for payments, tipping, and online transactions. It also gained mainstream attention when Tesla began accepting DOGE for selected merchandise purchases.

Most analysts expect DOGE to finish 2026 between $0.12 and $0.22, with a common target around $0.15. While some investors hope for a $1 price, achieving that level would require Dogecoin’s market capitalization to exceed $154 billion, which most forecasts do not anticipate in the near term.

2. Shiba Inu (SHIB): The Layer-2 Utility Ecosystem

Key Metrics (June 9, 2026)

  • Market cap: ~$2.77 billion
  • Circulating supply: ~589 trillion SHIB
  • All-time high: ~$0.000088 (October 2021)

Shiba Inu (SHIB) launched in August 2020 by an anonymous creator known as Ryoshi. It started as a meme coin and was nicknamed the “Dogecoin Killer,” but it has since evolved into a much larger ecosystem. After Ryoshi disappeared in 2022, lead developer Shytoshi Kusama assumed responsibility for the project’s development.

As of June 8, 2026, SHIB trades at approximately $0.0000047 and has a market capitalization of roughly $2.78 billion. Around 589 trillion SHIB tokens are in circulation, making substantial price increases mathematically difficult without significant changes in supply or demand.

The ecosystem includes three main tokens:

  • SHIB – the primary token
  • LEASH – a limited-supply rewards token
  • BONE – the governance token used for voting and network operations

One of SHIB’s most significant developments is Shibarium, a Layer-2 blockchain built on Ethereum and launched in August 2023. It offers faster transactions and lower fees than Ethereum’s main network. BONE tokens are used by validators to help secure the network.

By May 2026, Shibarium had processed more than 1 billion transactions, although recent growth has been steady rather than explosive.

In 2026, the project expanded further with new initiatives such as Shib Owes You (SOU) and AI-powered tools known as Shibarium Skills.

It also attracted attention when investment manager T. Rowe Price included SHIB in a proposed crypto ETF filing, marking one of the first signs of institutional interest in a meme coin.

SHIB also utilizes token burns, which permanently remove tokens from circulation. While billions of tokens have been burned over time, the enormous total supply means burns alone are unlikely to have a major short-term impact on price.

3. Pepe (PEPE)

Key Metrics (June 9, 2026)

  • Market cap: $1.15 billion
  • Circulating supply: 413.77 trillion PEPE (100% of total supply)
  • All-time high: $0.000028 (December 2024)

PEPE is one of the most popular meme coins and is driven almost entirely by internet culture rather than real-world utility. Launched in April 2023 as a tribute to the Pepe the Frog meme, it had no presale, no transaction taxes, and no centralized ownership, helping it gain credibility within the crypto community.

As of June 2026, PEPE trades between $0.0000027 and $0.0000032, giving it a market capitalization of roughly $1.15 billion. All tokens are already in circulation, meaning no new PEPE can be created. Despite having no business model, the token regularly records $270–$380 million in daily trading volume, demonstrating strong market activity.

In April 2026, investment firm Canary Capital filed for a spot ETF that would hold actual PEPE tokens, highlighting growing institutional interest in meme coins.

PEPE is known for extreme price volatility. It reached its all-time high in December 2024 and now trades approximately 90% below that peak. In January 2026, the token surged 65% in a single week, demonstrating how quickly prices can move. A major risk is that large holders (“whales”) control a significant portion of the supply, and their buying or selling activity can trigger sharp price swings.

4. MemeCore (M)

Key Metrics (June 9, 2026)

  • Market cap: $3.93 billion
  • Circulating supply: ~1.31 billion M
  • Maximum supply: 10 billion M
  • All-time high: $4.86 (April 2026)

Unlike meme coins such as DOGE, SHIB, and PEPE, which operate on existing blockchains, MemeCore has its own Layer-1 blockchain. The network was designed specifically for meme-based communities and aims to transform meme coins into tools for community building, governance, and shared ownership rather than pure speculation.

MemeCore uses a system known as Proof of Meme (PoM). Users can earn rewards by staking tokens, helping secure the network, creating content, and supporting community growth. The M token is used for staking, validator rewards, and voting on network upgrades.

The ecosystem includes:

  • MemeX – a launchpad for new MRC-20 tokens
  • Meson Finance integration – for stablecoin bridging

The token has a maximum supply of 10 billion M, with 5 billion created at launch. Approximately 1.3 billion M are currently in circulation.

Notably, M launched at approximately $0.035 in July 2025 and experienced rapid growth in early 2026. It reached an all-time high of around $4.86 in April 2026, becoming the second-largest meme coin by market capitalization, ahead of SHIB.

As of June 2026:

  • Price: approximately $3.00–$3.17
  • Market cap: around $4 billion
  • Ranking: among the top 30 cryptocurrencies by market capitalization

M is traded primarily on Bitget, while MEXC and Hotcoin also support the token. However, trading liquidity remains lower than that of major meme coins such as DOGE and SHIB, which can make large transactions more difficult.

5. Bonk (BONK)

Key Metrics (June 9, 2026)

  • Market cap: ~$517 million
  • Circulating supply: ~88 trillion BONK
  • Holders: ~984,000

BONK is more than just a meme coin—it has become a major community token within the Solana ecosystem. It launched in December 2022, with half of its supply distributed directly to the Solana community to encourage broad ownership.

BONK is deeply integrated into the Solana ecosystem, with more than 400 on-chain integrations across 13 blockchains. Its ecosystem includes:

  • LetsBonk.fun – a meme coin launchpad
  • BonkSwap – a decentralized exchange
  • BonkBot – a Telegram trading bot that burns 20% of its fees, helping reduce supply

The project has already burned approximately 9 trillion BONK tokens, representing around 9% of its original supply. Although BONK remains about 92% below its all-time high, it continues to be one of Solana’s most widely used meme coins.

Analysts estimate a potential end-of-2026 price range of $0.000006–$0.000009.

The main appeal of BONK extends beyond price speculation. Its strength comes from being one of the most widely adopted community tokens on Solana, providing ongoing utility and demand as activity on the network continues to grow.

How Important Are Market Cap and Circulating Supply for Meme Coins?

Market cap is calculated by multiplying a token’s price by its circulating supply. It is one of the best ways to compare the size and growth potential of different meme coins.

Many new investors focus on a coin’s price, but circulating supply can make low-priced tokens appear cheaper than they actually are.

Take Shiba Inu (SHIB) and Dogecoin (DOGE) as examples. SHIB trades at a tiny fraction of a cent, while DOGE is worth much more per coin. However, SHIB has about 590 trillion tokens in circulation.

For SHIB to reach $0.001, its market cap would need to grow to roughly $590 billion. A $1 SHIB price would require a market cap of about $590 trillion, which is unrealistic.

DOGE has a much smaller circulating supply of around 154.5 billion coins. A $1 DOGE price would require a market cap of about $154 billion. That is still a huge number, but it is far more achievable than SHIB reaching $1.

PEPE has a different setup. All 413.77 trillion tokens are already in circulation, so there is no future inflation from new token releases. Even so, its large supply means it still requires significant capital inflows to move higher. Returning to its December 2024 all-time high would require its market cap to rise to around $11.5 billion.

MemeCore (M) has a much smaller circulating supply. Only 1.3 billion tokens are currently in circulation out of a maximum supply of 10 billion. Because fewer tokens are available, its price can move more sharply in either direction with relatively small amounts of buying or selling.

The Key Takeaway

When comparing meme coins, focus on market cap rather than token price. A coin trading at $0.000001 is not automatically cheaper than one trading at $0.10. What matters is how much the market cap would need to grow for the price to reach your target.

Emerging Meme Coins to Watch: Utility vs. Community Power

The meme coin market in mid-2026 is evolving. While some tokens still rely primarily on hype, others are combining strong communities with useful products or unique cultural appeal. Three projects stand out.

FLOKI Expands Beyond Memes

Floki (FLOKI) has built one of the largest utility ecosystems among meme coins. Its projects include Valhalla, a play-to-earn metaverse game, and the University of Floki, which has launched crypto education centers in Ghana and Nigeria.

The project has also promoted itself through offline advertising campaigns in cities such as London and Lagos, helping it reach audiences beyond the crypto community. However, a key challenge is whether its gaming ecosystem can generate enough long-term demand for the token.

SIREN Rides AI-Fueled Momentum

Siren (SIREN) has emerged as one of the hottest meme coins this year. The token has gained 104% over the past week, 150% over the last 90 days, and 1,585% since the beginning of the year, reaching a market cap of $891 million.

Built on BNB Chain, SIREN combines meme coin popularity with the AI trend through SirenAIAgent. The AI features two personalities: Golden, which focuses on data-driven decisions, and Crimson, which takes a more aggressive approach.

The team plans to launch an AI-powered decentralized exchange and an automated trading agent. The main question is whether these AI products can attract and retain long-term users after the current hype fades.

Binance Life

Binance Life (币安人生) is different from most meme coins. It was created by the community in October 2025 following a viral conversation on X involving Binance co-founder He Yi. There was no presale or official company launch.

The token quickly gained attention and became one of the first Chinese-ticker tokens listed on Binance. It has risen 79% over the past month and 487% year-to-date.

Unlike FLOKI and SIREN, Binance Life offers no utility. Its value comes entirely from its connection to Chinese-speaking crypto communities and the cultural identity it represents.

The Risks of Trading High-Market-Cap Meme Coins

Even the largest meme coins are significantly riskier than most other cryptocurrencies. Before investing, it is important to understand the main risks.

Extreme Volatility

Meme coins can rise quickly, but they can also crash just as fast. It is common for prices to fall 50% to 90% after reaching a peak. For example, PEPE, BONK, and DOGE have all experienced declines of around 90% from their all-time highs. Large market caps do not protect meme coins from steep losses.

Whale and Insider Risk

A small number of large holders often control a significant share of a meme coin’s supply. If these “whales” decide to sell, prices can drop sharply. Some meme coins have also been associated with practices such as wash trading and artificial price inflation, making it more difficult to assess genuine demand.

Liquidity Risk

Popular coins such as DOGE and SHIB generally have sufficient trading volume to allow investors to buy or sell large amounts with relative ease. Smaller meme coins often have much lower liquidity, meaning large sales can push prices down and result in significant losses due to slippage.

Regulatory Risk

Regulators are paying closer attention to meme coins, particularly those linked to celebrities or suspected market manipulation. Investigations, lawsuits, or exchange restrictions can affect a token’s price and trading availability.

Smart Contract Risk

Many meme coins operate on blockchain smart contracts. While security measures such as renounced ownership can reduce risks, software bugs and vulnerabilities can still cause serious problems.

Risk Management Tips

Many analysts recommend limiting meme coins to a small portion of a portfolio, often around 1–2% per position. Diversifying across different assets and using stop-loss orders can also help manage risk. Since even the largest meme coins can experience major drawdowns, risk management is just as important as finding the right entry point.

FAQs: Can Any Meme Coin Reach $1 in 2026?

Q: Can Dogecoin reach $1 in 2026?

A: It is possible, but most analysts do not expect it. With about 154.5 billion DOGE in circulation, a $1 price would give Dogecoin a market capitalization of around $155 billion. Most forecasts place DOGE between $0.12 and $0.22 in 2026, with $0.25 considered a strong bullish target. Reaching $1 would require a gain of more than 1,000% from current levels.

Q: Can Shiba Inu reach $1?

A: Realistically, no. SHIB has roughly 590 trillion tokens in circulation, meaning a $1 price would create a market capitalization of about $590 trillion—far beyond any realistic crypto market size. A more achievable goal would be a return to $0.00001, which would still represent a significant move higher.

Q: Can PEPE reach $1?

A: Very unlikely. With more than 413 trillion PEPE tokens in circulation, a $1 price would imply a market capitalization of over $400 trillion. A more realistic bullish target would be a return toward its previous all-time high of around $0.000028, which would still represent a substantial gain.

Q: Can Bonk (BONK) reach $1?

A: No realistic forecast supports a $1 BONK price. Its supply is close to 100 trillion tokens, making that target mathematically impractical. Most analyst forecasts for 2026 place BONK between $0.000006 and $0.000009.

Q: Which meme coin has the best chance of generating significant gains in 2026?

A: Among the largest meme coins, Dogecoin is generally viewed as the strongest candidate. It benefits from a large community, a well-established brand, growing institutional interest, and a relatively stronger market position. Smaller meme coins can deliver larger percentage gains, but they also carry substantially higher risk.

Q: Are meme coins a good investment?

A: Meme coins are highly speculative assets. Their prices are driven primarily by market sentiment, social media trends, and broader crypto market conditions rather than business fundamentals. Some investors include them as a small, high-risk component of a diversified portfolio, but they should not be viewed as low-risk investments. Only invest money you can afford to lose.

Crypto Pundit Regrets Years of XRP, Cardano Underperformance, Says “I Wasted 8 Years of My Life”

0

Crypto commentator Ash Crypto has voiced frustration over the long-term performance of several major altcoins, including XRP, Cardano, Bitcoin Cash, and Litecoin.

The broader cryptocurrency market has inflicted significant losses on many investors over the years, prompting growing criticism from market participants. Against this backdrop, Ash Crypto took to X to express a sentiment shared by many long-term holders.

“Wasted 8 Years of My Life”: Ash

In a post on X, Ash Crypto wrote, “Wasted 8 years of my life,” alongside a video comparing the prices of several leading altcoins in 2018 with their valuations in 2026.

The video highlighted how many once-prominent cryptocurrencies remain far below their previous highs despite multiple market cycles and years of development.

Per the comparison, XRP declined from approximately $3 in 2018 to $1.10 in 2026. Similarly, Litecoin fell from $200 to $43, while Cardano dropped from $1 to $0.17. Bitcoin Cash also suffered a steep decline, falling from $978 to $204. Meanwhile, other projects such as EOS, Tezos, and Ontology recorded even larger percentage losses, according to the post. 

Criticism of the Long-Term Holding Strategy

The post appeared to challenge the popular buy-and-hold strategy often promoted within the crypto industry. Specifically, it suggested that investors who held altcoins for years without taking profits during bull markets may have missed opportunities to preserve gains.

Although the cryptocurrency market has experienced several major rallies since 2018, many assets that benefited from those surges surrendered most of their gains.

Cardano offers a notable example. The asset has fallen roughly 94% from its all-time high of $3.10 in September 2021 to around $0.17, illustrating the severe drawdowns that many altcoin investors have endured. 

Crypto Enthusiasts React 

Ash Crypto’s comments resonated with many long-term investors who shared similar frustrations about holding underperforming assets for years.

However, others argued that the takeaway is not that cryptocurrency investing has failed. Instead, they emphasized the importance of actively managing portfolios, rotating capital when necessary, and taking profits during market uptrends rather than relying exclusively on long-term holding strategies. 

Meanwhile, some users focused on what they viewed as a significant shift in Ash Crypto’s stance on the market. Notably, the commentator has long maintained a bullish outlook on cryptocurrencies, frequently encouraging investors to remain patient and trust that the market would eventually reward long-term holders.

As a result, his recent remark about wasting eight years of his life surprised many followers, contrasting sharply with his earlier optimism.

Market Recovery Boosts Sentiment

Meanwhile, the market showed signs of recovery over the weekend following reports that tensions between the United States and Iran may be easing. According to reports, Pakistan’s Prime Minister, Shehbaz Sharif, announced that the parties had reached a peace agreement that could be formally signed this week.

The development improved investor sentiment and triggered a broad market rebound. As a result, Bitcoin climbed above $65,000, while XRP rose to $1.18, helping lift the wider cryptocurrency market. 

Ripple CEO Reveals Two Areas Where Ripple’s Next Growth Market Will Come

0

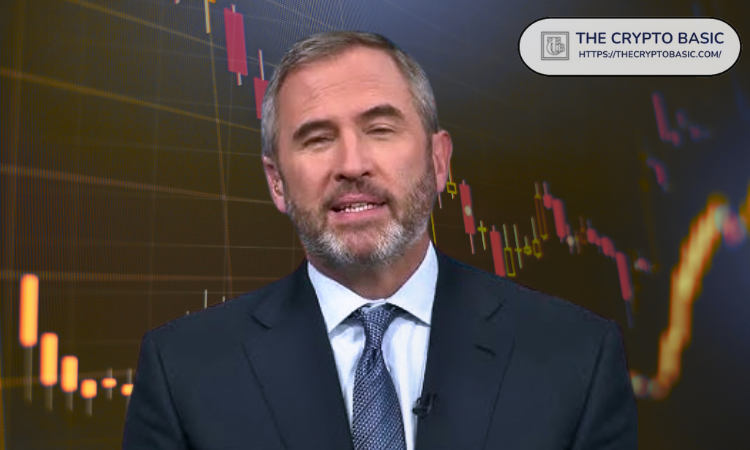
Ripple CEO Brad Garlinghouse has mentioned multiple areas he believes will drive the company’s next stage of growth.

In addition to this, Garlinghouse revealed that Ripple expects to reach a $1 billion revenue run rate by the end of 2026, excluding the XRP held on its balance sheet.

Garlinghouse Highlights Need for AI Regulation

Garlinghouse made the comments during an interview on Fox Business’ Mornings with Maria, where he covered several topics, including the proposed Clarity Act, JPMorgan CEO Jamie Dimon’s opposition, and how clearer regulations could help the crypto industry.

During the interview, host Maria Bartiromo asked Garlinghouse what kind of regulations he would like to see and what opportunities such comprehensive crypto rules could present for Ripple that are not currently available.

In response, Garlinghouse said lawmakers have been slow to introduce clear rules for digital assets. He noted that regulators should move faster when it comes to artificial intelligence. However, he admitted that Ripple is unlikely to play the same leading role in that sector as it has in the crypto industry.

Ripple Expects $1B Revenue in 2026

According to Garlinghouse, Ripple has continued to expand over the past year even without comprehensive crypto legislation in the United States.

He said much of this growth has come from markets outside the U.S., revealing that Ripple expects to finish 2026 with a revenue run rate of $1 billion, not including any value from the XRP it holds.

Garlinghouse explained that the company has benefited from its ability to serve a growing range of customers across different markets. He also noted that demand for Ripple’s services remains strong.

Ripple Treasury to Become a Major Growth Driver

Speaking further, Bartiromo later asked Garlinghouse where Ripple sees its next major growth opportunity. 

Responding, Garlinghouse mentioned Ripple Treasury as one of the company’s fastest-growing businesses. According to him, the platform features infrastructure that gives finance teams a complete view of their global financial operations.

The service is designed for companies ranging from Fortune 50 firms to Fortune 2000 organizations. Through a single dashboard, users can monitor bank accounts, track different currencies, and manage liquidity across multiple regions.

Garlinghouse said this business has become a major growth area for Ripple. He added that chief financial officers now want to understand how they can include stablecoins in their operations, and this creates additional opportunities for the company.

RLUSD Represents Another Growth Market

The Ripple CEO said this growing interest in stablecoins could help Ripple expand the use of RLUSD, the company’s stablecoin. He explained that RLUSD can help businesses improve payment processes and make financial operations more efficient.

He also expressed confidence in the acquisitions Ripple completed last year. According to Garlinghouse, those deals are helping the company bring together different products and services that can serve treasury and payments customers.

Speaking about RLUSD’s progress, he noted that Ripple launched the stablecoin around 18 months ago and has already grown it into one of the five largest stablecoins in the market. He added that the company continues to see strong growth and remains optimistic about the opportunities ahead in 2026.

Ripple to Focus on Integrations

Bartiromo then asked whether Ripple plans to pursue more acquisitions to support future growth. 

Garlinghouse replied that the company’s current focus is on integrating the two large organizations it recently acquired. He said Ripple wants to fully absorb and optimize those businesses before taking on major new deals.

Still, he acknowledged that the crypto industry remains highly active. He mentioned Bullish’s announced CoinDesk transaction as an example of the type of opportunities that continue to emerge across the sector.

Garlinghouse said Ripple intends to stay proactive as new opportunities arise. Conclusively, he stressed that the company maintains a strong balance sheet backed by dollars, stablecoin-related assets, and XRP holdings. This gives it the resources to support future growth initiatives.

Dogecoin Could Rally to $2.85 Minimum in Next Expansion, Analyst Says

Analyst Javon Marks believes Dogecoin (DOGE) may still have significant upside potential in the current market cycle.

In a post on X, Marks shared a long-term chart comparing DOGE’s performance across the 2017, 2021, and current market cycles. The analysis uses Fibonacci extension levels to identify potential price targets.

According to Marks, the comparison suggests Dogecoin could climb to at least $2.85 during its next major expansion phase.

Why the $2.85 Target Matters

Marks noted that the 1.618 Fibonacci extension for the current cycle sits around $2.85. He views this level as a minimum target if DOGE experiences a breakout similar to those seen in previous bull markets.

The chart also highlights higher targets near $7.22 and $14. Those levels could come into play if Dogecoin follows a similar historical pattern and market conditions remain favorable.

At its current price of $0.08845, a move to $2.85 would represent a gain of more than 3,100%.

Dogecoin History of Explosive Moves

Marks’ outlook is based on Dogecoin’s history of producing sharp rallies after long periods of consolidation.

During the 2017 cycle, DOGE surged from fractions of a cent and reached key Fibonacci targets. A similar move occurred in 2021, when the meme coin climbed to an all-time high above $0.73.

According to the chart, the current cycle may be following a similar structure.

Image

Can DOGE Repeat Its Past Rally?

Despite the bullish forecast, Dogecoin remains far below its all-time high. The cryptocurrency has also continued to struggle amid the ongoing bear market. Dogecoin is down 23% over the past month and 26% since the beginning of the year.

Moreover, the meme coin is down 89% from its all-time high. Given its recent poor performance, many investors doubt whether DOGE can deliver another multi-thousand-percent rally.

Meanwhile, other market analysts have shared bullish outlooks for DOGE’s short-term performance, though not on the same scale as Marks’ forecast.

For instance, analyst Ali Martinez recently said the TD Sequential indicator flashed a buy signal for Dogecoin this week. The same indicator issued a sell signal on May 7, preceding a 31% decline in DOGE’s price.

Martinez noted that DOGE is testing major support near $0.081, the lower boundary of a five-year parallel channel. If that level holds, DOGE could target the $0.096-$0.10 range.

Whales Accumulate at Current Levels

More than 30 billion DOGE last moved around $0.081, creating a strong support zone. Martinez also highlighted that whales have accumulated more than 200 million DOGE in recent weeks, signaling continued buying interest.

He views the $0.081-$0.058 range as an attractive accumulation zone and believes DOGE could eventually reach $0.50 and potentially $1 during a future rally.

XRP Has Now Entered Its Green Area of Interest, Which Suggests Opportunity

0

Market data shows that XRP may have now slipped into an area of interest amid the ongoing downturn, presenting an opportunity for long-term investors.

XRP continues to face strong selling pressure, currently trading at $1.14, which places it 68% below its all-time high of $3.60 reached in July 2025. The token has also fallen 37.8% since the beginning of the year.

Amid the latest crash, market analyst Chart Nerd says XRP has entered what he calls a green “area of interest.” According to him, this represents a zone that could help determine whether XRP is forming a long-term bottom for the ongoing downturn.

XRP Returns to a Historically Important Zone

Chart Nerd pointed out that XRP spent most of 2023 and the latter part of 2024 trading below a major resistance range between $0.70 and $0.80. Throughout this period, the zone repeatedly blocked upward movement and acted as a major barrier for the asset.

Notably, XRP finally broke above this resistance area during Q4 2024. This breakout helped trigger a strong rally, eventually pushing the token to its all-time high of $3.60 in July 2025. 

According to the analyst, the move above the long-standing resistance around $0.70 to $0.80 marked a major turning point for XRP at the time. However, the rally eventually lost strength. Chart Nerd noted that XRP began losing important moving averages, signaling a weakening trend. 

A weekly 20/50 EMA death cross later appeared, confirming that the market structure has flipped bearish. Following this change, XRP declined from its January 2026 high of $2.40 and later dropped to a February wick low of $1.12.

XRP Enters Area of Interest

After reaching its February low, XRP moved sideways for several weeks. The asset later staged a recovery attempt that briefly improved market sentiment, but the rebound failed to gain enough momentum to change the broader trend.

XRP Area of Interest Chart Nerd
XRP Area of Interest | Chart Nerd

Chart Nerd highlighted that XRP faced resistance at the 20-week exponential moving average around $1.55. Once the price failed to move above this level, selling pressure returned and pushed the asset lower. This decline eventually drove XRP down to the low of $1.04 earlier this month.

With the latest drop now complete, the analyst said XRP has officially entered his green “area of interest.” He says this zone, which sits between $0.70 and $1.25, represents a region to watch for signs of a potential bottom or even a broader market cycle low between now and the fourth quarter of 2026.

Why This Area Could Be Important

According to Chart Nerd, the current region is important because it sits close to a former resistance area that could now become support. 

The same $0.70 to $0.90 range that limited XRP throughout much of 2023 and 2024 may provide support if buyers manage to defend it during a deeper market decline before the end of the year.

However, the analyst warned that investors should not assume a reversal has already started. He stressed that confirmation is the most important factor, and so far, the market has not provided it. 

According to him, while XRP’s presence within the area of interest may present opportunities, the asset must first reclaim key resistance levels before a larger bullish trend can develop.

He identified the weekly EMA resistance levels at $1.45 and $1.78 as important levels to watch. Until XRP moves back above those areas, traders should continue to follow the existing trend instead of expecting an immediate reversal.

Short-Term XRP Levels to Watch

Meanwhile, EGRAG Crypto, another well-known analyst, discussed XRP’s short-term price action. He noted that XRP continues to hold above a short-term moving average while consolidating around the $1.14 area.

EGRAG Crypto stated that bulls remain in control on the lower time frame as long as XRP stays above the support zone between $1.134 and $1.14. If buyers continue defending that area, he expects the price to move toward higher resistance levels.

XRP 1h Chart
XRP 1h Chart

His first major upside target sits at $1.1938, while stronger momentum could push XRP toward the next target at $1.26. On the downside, he mentioned $1.0900 as the main support level and pointed to $1.0500 as a critical invalidation level and deeper support zone.

The analyst added that a breakout above the current consolidation range could open the door to a move toward $1.1938. On the other hand, if XRP loses its current support area, the price could return to $1.0900.

Evernorth CEO Highlights XRP Role as Institutional Bridge in Tokenized Markets Expansion

0

Evernorth CEO Asheesh Birla recently outlined how financial markets are steadily moving on-chain and why XRP is emerging as a key bridge asset in that transition.

Speaking on the GSR podcast with Frank Chaparro, Birla argued that XRP could play a significant role in the rapidly expanding tokenized asset market. 

Why XRP Stands Out

During the interview, Birla highlighted XRP’s ability to move tokenized value efficiently and pointed to the XRP Ledger’s built-in exchange functionality. However, he stressed that XRP’s competitive edge extends beyond its technical capabilities.

According to Birla, Ripple’s years of regulatory licensing efforts and deep relationships with banks have created a foundation that few blockchain networks can replicate. As a result, XRP and the XRP Ledger occupy a unique position as financial institutions continue to explore tokenized assets and on-chain settlement solutions. 

Birla Anticipates Growth in RWA Sector 

At the same time, Birla pointed to the rapid growth of tokenized real-world assets. He noted that the sector has expanded from virtually nothing two years ago to tens of billions of dollars today.

Nonetheless, he emphasized that the market remains in its infancy compared to traditional financial markets, which are measured in trillions of dollars. Consequently, he believes the sector still has substantial room to grow as more real-world assets migrate onto blockchain networks.

XRP Needs More Institutional Use Cases

Notably, several firms, including Evernorth and VivoPower, have already adopted XRP as a reserve asset. However, Birla argued that simply holding XRP will not drive long-term growth.

Instead, he believes institutions need regulated and compliant products that create practical utility for digital assets. To achieve this, industry participants must develop real-world applications that meet regulatory requirements, privacy standards, and institutional risk controls.

According to Birla, expanding these use cases would boost demand for blockchain-based financial services while creating new opportunities for XRP within the broader financial ecosystem.

He also identified liquidity as a critical component of the on-chain economy. In his view, tokenized assets must be actively used in lending, trading, and capital deployment markets for blockchain-based finance to function efficiently.

XRP Ledger’s Growing Presence in the RWA Market

Meanwhile, the tokenized real-world asset sector continues to expand rapidly. The market currently boasts a represented asset value of approximately $342 billion, while distributed asset value stands at $31.96 billion, according to rwa.xyz.

Within this landscape, the XRP Ledger ranks third by represented asset value, with approximately $3.7 billion in assets represented on the network. However, it ranks tenth in the Distributed RWA League Table, with about $368 million in distributed asset value.

Notably, Evernorth has consistently highlighted XRPL’s progress in the RWA sector. The firm has previously pointed out that the network reached a $400 million valuation in tokenized assets faster than Ethereum, underscoring its growing presence in the emerging tokenized finance market. 

Data-Driven Analysis Pinpoints This Cycle’s Bottom Prices for Bitcoin, Ethereum, and XRP

0

A recent data-driven market exposition pinpoints this cycle’s bottom prices for Bitcoin, Ethereum, and XRP, using historical on-chain context.

The ongoing market-wide downturn has continued to pressure crypto assets, wiping out billions of dollars in value and leading to massive losses across the cryptocurrency sector. 

Amid this environment, prominent market analyst Ali Martinez has shared what he considers the potential bear-market bottom levels for Bitcoin, Ethereum, and XRP, leveraging reliable historical data from multiple metrics.

Bitcoin MVRV Pricing Bands

First, Martinez believes Bitcoin is getting closer to a market bottom based on data from the MVRV Pricing Bands. To him, the final capitulation zone lines up with the 0.8 MVRV Band, which currently sits around $43,200.

He noted that some of Bitcoin’s best risk-reward opportunities have appeared whenever the asset traded within the 1.0 and 0.8 MVRV Pricing Bands. 

This pattern has repeatedly helped identify major bottoms in past market cycles. Specifically, from January to August 2015, Bitcoin fell to a range between $166 and $213 while trading within this MVRV zone. This period ultimately marked the bottom of the cycle.

Bitcoin MVRV Pricing Bands Ali Martinez
Bitcoin MVRV Pricing Bands | Ali Martinez

This setup appeared again in December 2018 when Bitcoin dropped to between $3,125 and $3,792. The asset entered the same MVRV range and eventually formed the cycle low. Also, a similar event occurred in November 2022 when Bitcoin declined to $15,500.

Currently, the 1.0 MVRV Band stands at $53,900, while the 0.8 MVRV Band is at $43,130. With Bitcoin trading at $63,750, the asset would need to fall between 15% and 32% to reach the projected bottom range.

Ethereum Delta Price Model

For Ethereum, Martinez highlighted the Delta Price model, an indicator that compares investor cost basis with miner production costs. According to him, this metric has consistently identified major accumulation zones and long-term market bottoms.

Notably, this model has successfully pinpointed the cycle lows on two previous occasions. In December 2018, Ethereum dropped to $80.9 and tested the Delta Price level before finding a bottom. The same thing happened in June 2022 when ETH fell to $880 and again reached the indicator before completing the cycle low.

Ethereum Delta Price Ali Martinez
Ethereum Delta Price | Ali Martinez

At present, the Delta Price model stands at about $700. Martinez sees this level as Ethereum’s ultimate value zone and a possible floor if selling pressure continues across the broader market.

Ethereum currently trades at $1,677. Based on the Delta Price model, the asset would need to decline by about 58% from its current price to revisit the projected support area around $700.

XRP Rising Trendline

Martinez also discussed XRP’s long-term chart structure. He mentioned a major rising trendline on the monthly chart that has aligned with every major cycle bottom for nearly a decade. He believes this trendline remains one of the most important support levels for XRP.

Importantly, past price action appears to support this. In March 2020, XRP dropped to $0.11 and tested the trendline before forming the bear-market bottom. Years later, XRP again reached a major low when it fell to $0.38 in July 2024. That decline marked the floor for the period before the asset later recovered.

XRP Rising Trendline Ali Martinez
XRP Rising Trendline | Ali Martinez

Martinez suggests that another test of this long-term support could create the next major accumulation opportunity. Based on the trendline’s current position, he identified a possible bottom range between $0.70 and $0.90.

XRP currently trades at $1.14. To reach this projected support zone, the asset would need to fall between 21% and 38.5% from its current level.

XRP Whales Pull 500M Tokens Off Binance Amid $1 Price Dip

Large XRP holders are moving significant amounts of tokens off exchanges amid XRP’s ongoing price weakness. 

The trend has created a notable divergence that some market observers believe could eventually lead to a supply squeeze.

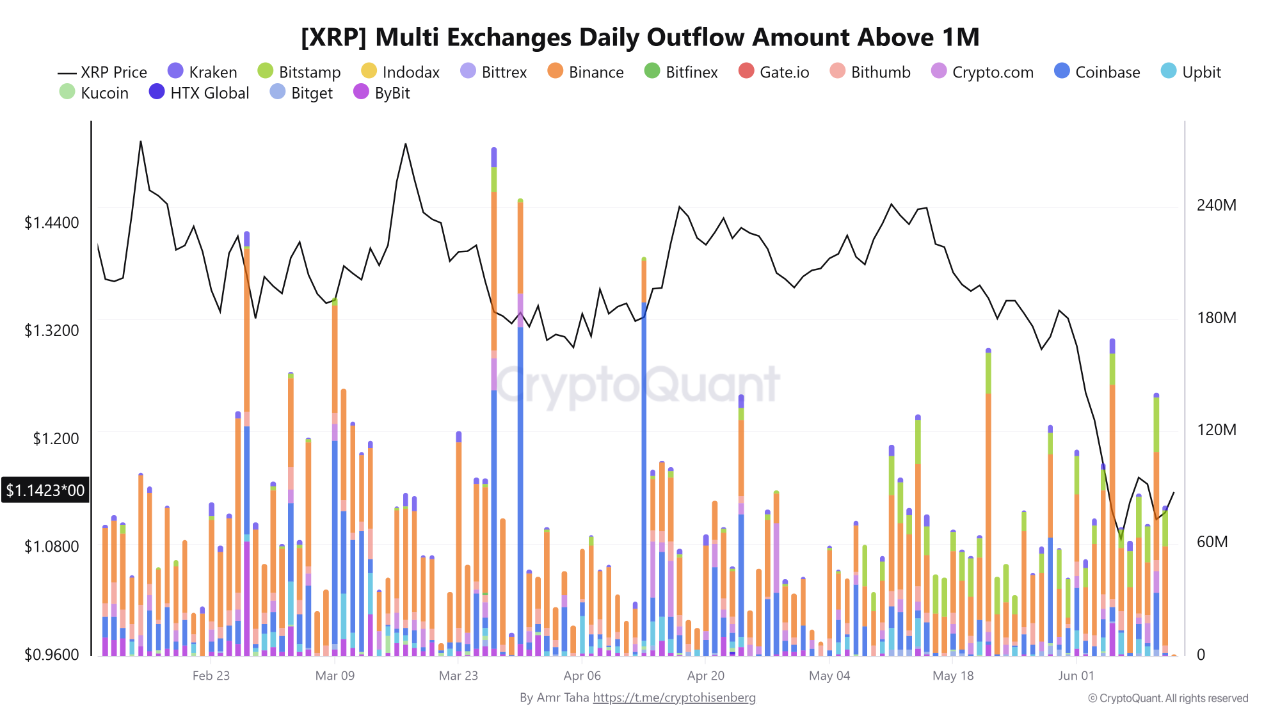
XRP community figure Xaif, citing data from CryptoQuant, said daily XRP outflows of more than 1 million tokens have accelerated even as the coin has fallen over 20% since May.

“Someone is absorbing every dip,” Xaif wrote, pointing to persistent large withdrawals while prices remain under pressure.

In a separate update, Xaif noted that roughly 89 million XRP was withdrawn from Binance in a single day. At the same time, XRP funding rates dropped to -0.012, one of the most bearish readings seen in recent months.

Binance XRP Reserves Keep Falling

Crypto commentator Diana, also citing CryptoQuant data, said XRP supply on Binance “keeps disappearing” while traders place their largest bearish bets in months.

According to the data, Binance’s XRP reserves fell from approximately 2.766 billion tokens on May 24 to about 2.691 billion today.

The decline in reserves comes as funding rates remain negative. This suggests many derivatives traders are positioning for further downside.

Source: CryptoQuant
Source: CryptoQuant

465 Million XRP Withdrawn in Nine Days

The latest observations align with a report from CryptoQuant analyst Amr Taha. He found that Binance recorded around 465 million XRP in large daily outflows between June 3 and June 11.

According to Taha, transactions involving more than 1 million XRP have become increasingly frequent since the start of June. The repeated withdrawals suggest surging whale activity, with large investors buying XRP on dips. 

He added that the trend is not the result of a single large transfer. Instead, it reflects a series of sizable withdrawals spread across multiple days.

Meanwhile, large exchange withdrawals do not automatically confirm accumulation. However, they reduce the amount of XRP readily available on exchange order books. In effect, this reduces selling pressure.

Why Funding Rates Matter

Negative funding rates typically mean short sellers are paying long traders to keep their bearish positions open. This usually reflects expectations of lower prices.

However, extremely negative funding can also increase the risk of a short squeeze. If XRP unexpectedly moves higher, short sellers may be forced to buy back their positions, adding further upward pressure. As Xaif puts it, “every short is future buy pressure.”

According to CoinMarketCap data, XRP is trading at $1.14. The token is up 0.22% over the past 24 hours and 4% over the last week. However, it remains down roughly 20% over the past month and about 38% since the start of the year.