Home Blog Page 975

Czech Central Bank Considers Adopting Bitcoin As Reserve Asset

0

Aleš Michl, Governor of the Czech National Bank (CNB), has revealed that the country’s central bank is exploring Bitcoin (BTC) as a potential reserve asset.

The governor made this known in a recent interview with the Financial Times, where he addressed key aspects of the bank’s monetary policy and strategy for reserve diversification. 

Taking to X, Michl reaffirmed his comments from the Financial Times interview, confirming that he spoke about the bank’s consideration of Bitcoin as a reserve asset.

CNB’s Reserve Diversification Strategy 

The governor highlighted the apex bank’s success in reducing Czech inflation from 17.5% in 2022 to its target level. Per Michi, the apex bank has taken significant steps toward increasing the country’s gold reserve to 5% from 0%. 

Similarly, the central bank also plans to allocate 30% of its reserve to equities, aligning with its broader diversification strategy. 

Interestingly, the bank is currently considering Bitcoin as a potential reserve asset. Michi states this consideration is driven by Bitcoin’s zero correlation with bonds and BTC’s prospects of making a large portfolio attractive. 

No Immediate Decision Due to Bitcoin Volatility

While the bank’s board is currently analyzing and discussing Bitcoin as a potential reserve asset, Michi emphasized that there will not be an immediate decision. He asserted that the board needs to analyze the move carefully before reaching a decision. 

Furthermore, he recognized Bitcoin’s volatile nature, noting that its extreme price fluctuations present a challenge in fully leveraging its low correlation with traditional assets. Due to this volatility, Michl pointed out that Bitcoin could either become highly valuable or plunge to zero.

Accordingly, he plans to order the board to carefully assess BTC’s potential inclusion in the country’s reserve. Notably, he disclosed plans to issue the directive tomorrow, January 30, 2025. 

Growing Interest in Bitcoin Among Countries 

The development reflects the growing interest in Bitcoin among countries. While countries like El Salvador have adopted Bitcoin, some are still considering whether to incorporate BTC into their reserves. 

Earlier this month, the United States government established a working group to assess the possible creation of a national digital asset reserve. 

Although the order did not mention any cryptocurrency, speculation suggests that Bitcoin will likely be included in the reserve. This speculation takes inspiration from Donald Trump’s campaign promise to make America the crypto capital of the world through several initiatives, including establishing a national Bitcoin stockpile with legally seized BTC tokens. 

Since Trump’s reelection, several countries have considered following the U.S. approach. In December, Japan declined a proposal to include Bitcoin in its reserve, noting that crypto assets cannot be classified as foreign exchange. 

Currently, Bitcoin is trading at $101,945, with a 24-hour trading volume of $43.57 billion. 

Cardano to Achieve Full Decentralized Governance as Plomin Goes Live Today

0

Cardano is moments away from achieving full decentralized governance amid the Plomin hard fork today.

A key tenet of blockchain technology is decentralization, but in truth, it has continued to be a work in progress for most projects due to the complexities of achieving the feat at scale. 

Still, Cardano, one of the longest-running Layer 1 chains, now suggests it is only a few hours away from achieving this feat on a governance level.

Cardano Plomin Set to Go Live

Cardano is moments away from achieving full decentralized governance.

The Cardano Foundation disclosed that the network was set to transition to full decentralized governance following the implementation of the Plomin hard fork later today, Wednesday, January 29, asserting that it would be “a milestone in blockchain governance.”

A hard fork is an update to the software on the distributed nodes that secure a blockchain network.

The Plomin hard fork, named in honor of Cardano contributor Matthew Plomin, will introduce several key components of Cardano’s governance infrastructure. This includes fully implementing delegated representatives (DReps) and unlocking treasury withdrawals.

How Cardano’s Decentralized Governance Works

Cardano is set to operate a liquid democracy. Under this framework, users allocate their voting power to delegates, similar to a representative democracy. However, unlike the typical representative democracy, users can move this voting power at any point, usually considering the policy up for a vote.

In this case, the delegates are the DReps, and their voting power is measured by the amount of ADA allocated to them. This ADA will, however, not change ownership or have a lock-up period but will always be in the user’s control.

Through this system, users will be able to influence everything from parameter changes to treasury withdrawals and hard forks, the Cardano Foundation asserted on Wednesday.

Ahead of the Plomin upgrade, leading crypto exchange Binance has announced a temporary pause on deposits and withdrawals of Cardano’s native token ADA to support the upgrade.

Meanwhile, the price of ADA has not been affected by the news, trading 3.8% lower on the day at about $0.92 amid a market-wide correction.

Ripple Stable Coin 107% Backed by US Treasury Bills, Cash Deposit, December Report Shows

0

Reserve reports for the Ripple USD (RLUSD) for December show secured financial instruments like US debt and cash deposits fully back the stablecoin.

RLUSD maintains its peg with the US dollar through a 1:1 reserve backing as a centralized, fiat-collateralized stablecoin. A recent report shows that the RLUSD stablecoin is 107% backed by US Treasury bills and cash equivalents.

RLUSD’s Secured Reserve

The recently released audit report reveals details of RLUSD’s reserve. Notably, prominent public accounting firm BPM conducted the audit on Standard Custody and Trust Company, a subsidiary of Ripple Labs and issuer of the stablecoin.

According to the report, the accounting firm audited the firm’s report on the RLUSD stablecoin’s reserve on December 20 and 31, 2024. BPM examined and confirmed Ripple USD’s reserve and distribution on those dates.

The audited report disclosed RLUSD’s outstanding supply and the market value of reserves on both dates. Specifically, on December 20, the stablecoin’s supply stood at $72,300,301, while the reserve value amounted to $78,212,154.

Meanwhile, on December 31, RLUSD’s had a supply of $77,208,201. In addition, reserve increased to $83,214,671, representing 107% of the outstanding supply. A detailed breakout shows that the stablecoin’s excessively backed reserve is invested in secured US-based financial instruments.

As of December 31, the Ripple USD reserve consists of US Treasury bills, government money market funds, and cash deposits held by US-regulated financial institutions. In that order, the stablecoin issuer committed $30,095,603, $30,119,460, and $22,978,696 into the instruments.

RLUSD Reserve
RLUSD Reserve

RLUSD Stabilizes Amid Initial Fluctuation

Meanwhile, the stablecoin’s market price has stabilized around the $1 valuation as correlation with the US dollar and supply continues to grow. This comes after initial price fluctuations in its early days.

For context, RLUSD’s valuation reached $1,200 at some point before launch as market users scrambled to acquire the stablecoin. Ripple CTO David Schwartz explained that the price abnormality came as a user was willing to pay that high for the stablecoin, which briefly adjusted its price to match the order.

RLUSD also spiked 6% earlier in the month after XRP crossed $3. Again, Schwartz explained the anomaly, attributing the price uptick on the XPMarket to market dynamics among decentralized exchanges (DEXs).

Meanwhile, the recent sustained stability could also be attributed to the growing liquidity from adoption among networks and exchanges. For context, the Root Network recently added support for RLUSD trading, joining the ever-increasing list of protocols offering the stablecoin to clients.

Per XRMarket, RLUSD now has a market cap of $13.8 million, ranking 7th in the stablecoin ranking.

Market Veteran Shares Why Market Vibe is Off Despite Bitcoin Staying Above $100K

0

A market veteran identifies why the market vibe seems off despite Bitcoin reclaiming and staying above a crucial price milestone.

Notably, Bitcoin has reclaimed the $100,000 milestone after previously dropping below it, currently changing hands around $101,000. However, market sentiment remains lukewarm despite this achievement. 

For context, many investors expected a major rally after Donald Trump’s inauguration on Jan. 20, but that surge has yet to materialize. Now, several analysts have discussed why Bitcoin’s rise to six figures lacks the excitement from previous runs.

Benjamin Cowen Points to Declining Market Breadth

In a report today, Benjamin Cowen, founder and CEO of Into The Cryptoverse, called attention to a major reason for the market’s neutral sentiment. 

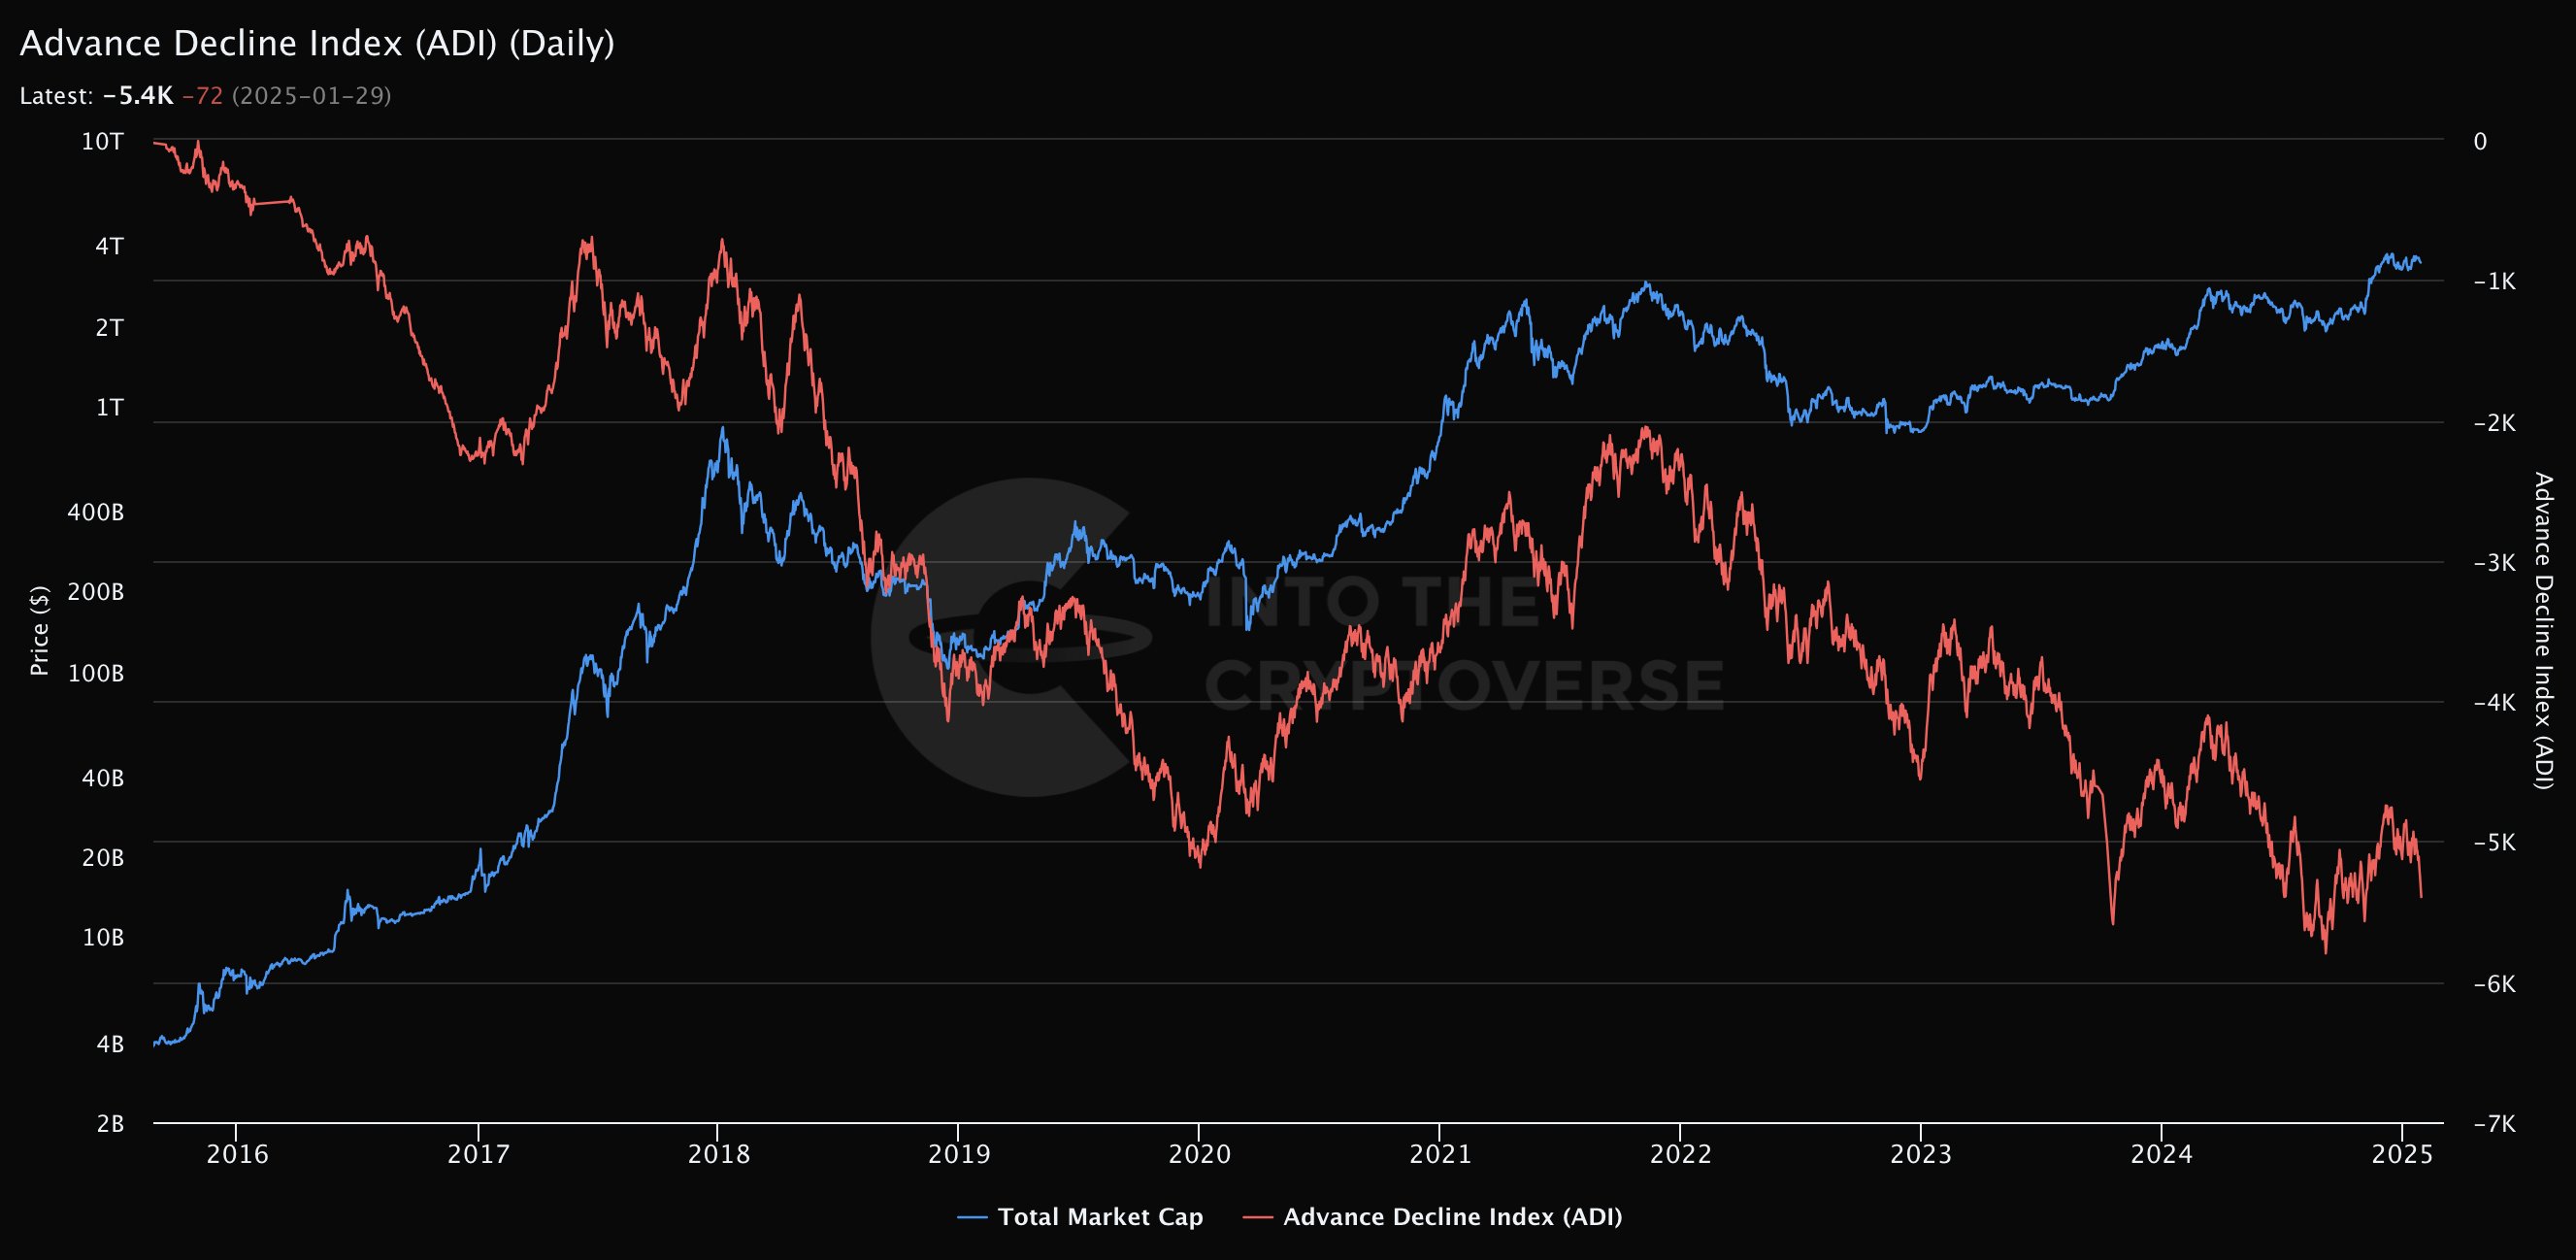
He pointed out that the Advance Decline Index (ADI) of the top 100 crypto assets has been in a downtrend since 2021. Notably, this declining trend contrasts with the 2020-2021 bull run, where the ADI showed consistent growth as altcoins saw massive gains, leading to new ATHs.

For context, the ADI tracks the difference between advancing and declining assets over time. If more assets are rising than falling, the index trends upward. If declines outnumber advances, the index moves lower. 

Right now, even though Bitcoin price is rising, the ADI continues to drop, signaling weaker performances from altcoins held by most market participants who await the altcoin season. Cowen believes this is why the current cycle feels different from previous bull markets. 

ADI Daily Into The Cryptoverse
ADI Daily | Into The Cryptoverse

Struggling Altcoin Market

In addition, Khan, a mathematician and market analyst, pointed out that many investors who entered the market in 2021 have yet to see their portfolios recover. According to him, while Bitcoin has surged, most altcoins have underperformed. For instance, Ethereum continues to battle the bears at $3,000.


The market analyst shared data on the top 100 crypto assets by market cap. The top 50 altcoins are, on average, down 24% from their all-time highs, while the next 50 have lost around 64%. This gap explains why many investors feel disheartened despite Bitcoin’s strength.  

Khan also noted a pattern in the crypto market. He disclosed that retail traders often invest in trending sectors too late. By the time a sector gains mass attention, the opportunity has usually passed. He believes that only a small percentage of traders successfully adapt to new trends, while most get stuck in outdated narratives.  

For instance, he pointed to data from Dune Analytics and CN Research, showing that only a tiny fraction of traders has made profits from meme coins. Citing this, Khan questioned whether most participants are truly investing or simply gambling.  

Expert Anticipates New ATHs 

Meanwhile, Michael van de Poppe, another market veteran, is still optimistic. In an analysis today, he noted that Bitcoin turned the $100,000 level into support again, which he sees as a strong bullish signal. He believes that if Bitcoin can break through $104,000, a new all-time high is within reach. 

Despite the bearish sentiments on social media, van de Poppe confirmed he remains confident. He observed that many traders are claiming that this cycle is over, which he interprets as a sign that the market is nearing a turning point. He expects altcoins to trigger the next major move within the next two to four weeks.  

In addition, even after the most recent market slump, which previously pushed BTC below $100K, van de Poppe reassured investors, saying that this could be the final shakeout before a macro shift. Notably, he advised against selling altcoins. At press time, BTC trades for $101,926, up 0.6% in the last 24 hours.

Major Price Move Awaits XRP as Bollinger Bands Squeeze on 12-Hour Chart

0

XRP has entered a phase of tightening volatility, as the Bollinger Bands squeezing on the 12-hour chart indicates.

Technical analyst Ali Martinez highlighted this observation in a tweet. Historically, such contractions in price range often signal that a major move is imminent. Martinez suggested that this time would likely be no different.

XRP Tightening Bollinger Bands and What Could Follow

Notably, after a strong rally that pushed XRP above $3.30 in mid-January, the price has since stabilized, hovering near the middle band. The initial surge saw a series of bullish candlesticks, but resistance near $3.30 led to a period of sideways movements.

During this time, XRP revisited lows around $2.70 but has since recovered, settling in the $3 range at press time. Now, with the Bollinger Bands narrowing, traders are bracing for a breakout in either direction.

Image
XRP Bollinger Bands Squeeze on 12Hour Chart

If XRP breaches the upper band, it could trigger another leg up, possibly revisiting its all-time high at $3.84—an event the XRP community has eagerly awaited for seven years. Conversely, a drop below the lower band could open the door to a deeper retracement.

Notably, Martinez offered no clear indication of whether XRP would experience a breakout to new all-time highs or a breakdown toward December’s lows. Market participants commenting on his post repeatedly sought his opinion on the next market direction.

XRP Promising Outlook

Meanwhile, in a previous commentary, Martinez said buying XRP around the $3 mark was “a good idea.” However, he acknowledged that purchasing during the dip at $2.40 would have been a better move, as holders would already be up 24%.

Additionally, he revealed that he had already taken a long position in XRP at $2.40, targeting a price of $10. Martinez also noted that while XRP may revisit new lows in the $2 range, he would seize the opportunity to add to his position. 

He emphasized that XRP is a long-term trade and urged holders to ignore short-term fluctuations.

Previous Case: XRP Pumped After Tightening Bollinger Bands

Further, market watcher Steph previously identified a tightening of XRP’s 12-hour Bollinger Bands. In the analysis, Steph pointed out that a similar event preceded a 490% rally in XRP, which saw the price rise from $0.49 to $2.90 in November to December 2024.

At the time of Steph’s disclosure, XRP was trading at $2.26, consolidating after the explosive rally. While Steph speculated that another breakout from the tightened bands could drive XRP by a similar magnitude as before, this did not happen.

Instead, XRP’s price improved from $2.26 to near $3.50, registering a gain of about 50%. With market anticipation building, all eyes are on XRP to see where the next move will take it.

PEPE Analysis: Bull Trap Detected With 38% Downside Risk

As PEPE recovers, price action analysis suggests a potential trap for buyers. Here’s why PEPE could face a bearish extension.

As Bitcoin stabilizes around the $102,000 mark, meme coins are navigating a rocky path. After dipping to $87 billion, the total meme coin market valuation has now recovered to $92.71 billion.

Despite the overall market recovery, top meme coins like PEPE have yet to recover from yesterday’s downturn. With an intraday recovery of 9.49%, PEPE is above the $0.000011 level.

However, the recent pullback suggests the possibility of an extended correction following a retest. Could this correction phase undermine the November 2024 rally for PEPE? Let’s take a closer look.

PEPE Price Analysis

The Pepe price action in the daily chart reveals a falling channel pattern breakdown. On January 26, a pullback of 7.35% breached the 200-day EMA line and the local support trend line. 

PEPE Price Chart
PEPE Price Chart

As the correction extended, the bears pushed prices lower, forming a triple black crow pattern. However, buyers regained control near the $0.000011 level, leading to a quick reversal.

Currently, the intraday recovery has brought PEPE’s price to $0.00001257, forming a bullish harami pattern. Buyers could regain control of the trend if PEPE can overcome the recent bearish engulfing candle.

Supporting the intraday recovery, the daily RSI has shifted away from the oversold boundary. However, the declining trend in the dynamic support average line continues.

Following a recent negative crossover between the 20 and 100 EMA lines, the 50 and 100 EMA lines are also heading for a negative crossover. This suggests a strong selling signal for price action traders.

PEPE Price Target

Based on Fibonacci levels, the intraday recovery is testing the 38.20% Fibonacci level at $0.00001252. For a sustained recovery, PEPE will need to surpass the 200-day EMA.

Furthermore, the 50% Fibonacci level’s crucial resistance level coincides with the 200-day EMA line. Hence, a bullish comeback above this will increase the possibility of Pepe overcoming the local resistance trend line.

However, given the volatility in the broader market, PEPE is likely to experience a post-retest reversal from the support trendline. This could test the 23.60% Fibonacci level near the $0.000010 psychological support.

Beyond this, a bearish continuation may push PEPE to test the $0.00000792 support level. From PEPE’s current price, this represents a potential loss of 38%.

Binance BNB Struggles at $675: Is a Breakdown Looming?

As the broader market recovers, Binance Coin’s price finds itself on a slippery slope. With a triangle breakout and the upcoming FOMC meeting, will BNB hold the $650 mark?

After an intraday recovery of 2.01%, Binance Coin (BNB) is currently trading at $674. This follows a brief pullback of 2.72% yesterday.

The current BNB price trend shows alternating red and green days over the past six days. Could this alternating pattern signal a significant drop below the $650 mark?

Binance Coin Price Analysis

The BNB coin price trend maintains a bearish alignment as it hits a 7-day low of $637. However, with the lower price rejection and current intraday recovery, BNB sustains dominance over the 100-day EMA line.

Binance Coin Price Chart

Currently, BNB’s recovery is facing resistance near the 61.80% Fibonacci level at $674.95. The ongoing pullback indicates a potential bearish breakdown of a symmetrical triangle pattern in the larger picture.

The intraday recovery appears to be a retest of the broken triangle, with the price rejection at the 24-hour high of $679 hinting at a possible continuation of the bearish trend.

Moreover, the 20 and 50 EMA lines are nearing a negative crossover, while the 4-hour RSI is below the halfway mark, signaling bearish dominance. As a result, technical indicators are currently showing a sell signal amid the triangle breakdown.

BNB Coin Price Target

Using trend-based Fibonacci levels, the bearish continuation could push BNB below the psychological $650 mark. If this happens, the decline could test the 200 EMA at $623.

This dynamic support level is close to the 38.20% Fibonacci level at $628, creating a strong support zone that could serve as a potential reversal point.

In particular, a recovery from $628 could see BNB challenge the $675 resistance level once again. However, if the bearish continuation fails to gain momentum after a retest, the upside potential for Binance Coin is substantial.

With the upcoming FOMC meeting, any dovish comments could fuel a market recovery. In such a scenario, the upside targets for BNB would be the $708 resistance level and the psychological $750 mark.

Cardano Set to Reclaim $1? Here’s Why This Analyst Thinks So

0

Highly followed market analyst “CobraVanguard” suggests Cardano is ready for a significant bounce.

This week, the crypto market has experienced significant turbulence, and Cardano‘s native token ADA has not been exempt. Amid risk-off sentiment sparked by China’s DeepSeek, the asset dropped over 10% from a high of $0.96 to as low as $0.86.

However, following the rout, the asset may be set for a significant rebound, at least according to one analyst.

Cardano’s ADA Set to Bounce to $1?

Highly followed market analyst “CobraVanguard” has suggested that Cardano’s ADA is ready for a significant bounce.

In a recent TradingView idea, the analyst contended that the $0.85 to $0.90 level would likely offer good support to the asset. They based this view on the fact that this level has provided significant support to the asset in the past few weeks, citing data from the four-hour candle chart.

As such, CobraVanguard predicted an imminent price bounce with a target around the psychologically important $1 price level.

ADAUSDT 4 hour candle chart 1
ADAUSDT 4 hour candle chart. Source: CobraVanguard

Indeed, at the time of writing, the asset has already pared some losses to trade near $0.93, with CobraVanguard’s analysis suggesting room for a further 7.5% upside at the least.

Meanwhile, the asset may be set to get tailwinds in the form of a leveraged exchange-traded fund following recent filings from Tuttle Capital. On Monday, January 27, the firm filed to launch leveraged ETFs for ten crypto assets, including Cardano’s ADA.

Moreover, veteran trader Peter Brandt has recently suggested that Cardano is ready for “a grand bull market,” noting that it appears to have broken out from a multi-year double-bottom formation.

In the short term, however, the asset needs to weather several key economic releases this week, including the interest rate decisions of the U.S. and European Area.

Binance Under Probe in France Over Money Laundering

0

French authorities have opened an investigation into Binance, the largest crypto exchange by trading volume, over possible involvement in fraud.

In a Tuesday release, the economic and financial arm of the Paris prosecutor’s office, JUNALCO, announced launching a new investigation into Binance. Notably, the federal agency stated it is probing the exchange on a chain of misconducts, including abating money laundering, drug trafficking, and terrorism financing.

Binance Face Fresh Regulatory Setback

The French prosecutor revealed it was looking into Binance’s activities spanning five years, specifically between 2019 and 2024. The investigation aims to uncover the trading platform’s involvement in fraud not only in France but also in other countries in Europe.

Meanwhile, the probe is in addendum to its years-long assessment of the leading exchange. The duo’s legal battle dates back to 2023, when the French prosecutors tried Binance over unlawfully promoting unregistered securities within its borders before getting an official license.

Notably, the June 2023 investigation trailed complaints from users that they lost money on Binance. The prosecutor opened a preliminary probe into the firm for luring users through promotions and influencers and facilitating fraud.

Moreover, Binance founder and former CEO Changpeng Zhao (CZ) faced a similar plight in the United States. The exchange’s founder pleaded guilty to money laundering, getting a 4-month prison sentence and Binance, a $4.3 billion fine.

The Australian Securities and Investment Commission (ASIC) also sued Binance in December for failing to protect over 500 users, as stated in the federal law. The lawsuit noted that the exchange did not provide the required customer disclosure, resulting in substantial losses for the affected users.

Binance Says It Is Disappointed Over Probe

A Binance spokesperson expressed disappointment in reaction to the latest probe. The representative denied the allegations, insisting that the leading exchange would legally dispute any charges against it.

The statement frowned on the fresh investigation, arguing the matter is “several years old.” It also noted that Binance has improved its anti-money laundering (AML) compliance through thorough Know-Your-Customer (KYC) and better employee education.

Meanwhile, despite regulatory woes, Binance still controls substantial market shares. According to Coingecko, the exchange controls 34.7% of the market’s activities, and its trading volume topped $1 trillion in December 2024.

Ethereum Price Targets $4,000 Amid Wedge Breakout Chances

With a potential double-bottom reversal in play, could Ethereum price break out of its wedge pattern and surge toward the $4,000 mark?

Amid increased volatility in the crypto market, Ethereum briefly retests the $3,000 level. As it shows signs of a fresh intraday recovery, bulls are presenting solid reversal opportunities. Will this reversal rally push Ethereum past its local resistance trendline for a breakout?

Ethereum Price Analysis Hints at Breakout Potential

On the 4-hour chart, Ethereum’s price trend shows a bullish failure to sustain above the $3,200 level. This led to a retest of the $3,000 level, with the 24-hour low at $3,039. However, the recent recovery has driven the price to $3,143.

Ethereum Price Chart

Along with the recovery, the price trend highlights a potential double-bottom reversal from the psychological support level. Additionally, the double-bottom pattern is accompanied by a bullish divergence in the 4-hour RSI, further increasing the likelihood of an upside continuation.

Ethereum Derivatives Market: Mixed Signals

Amid the growing volatility, speculations in the derivatives market are also on the increase. Ethereum’s Open Interest has decreased by 1.92%, standing at $30.40 billion, but the funding rate remains stable at 0.0076%.

Ethereum Derivatives

Ethereum ETFs Register Net-Zero Flow

As Ethereum derivatives give mixed signals, the US spot Ethereum ETFs make a surprising move. On January 28, all nine Ethereum ETFs registered a net-zero flow.

Meanwhile, the cumulative net inflow of the Ethereum ETFs remained positive, with BlackRock leading the way with $3.99 billion. However, Grayscale Mini Ethereum Trust remains the sole ETF with a negative net cumulative flow of $3.85 billion.

ETH Price Targets

Ethereum remains trapped within a larger falling wedge pattern, but the double-bottom reversal suggests a potential bullish resurgence that could challenge the overhead resistance trendline. Ethereum’s price could see a high-momentum recovery if a breakout rally occurs.

Based on Fibonacci levels, Ethereum’s recovery rally might target the 61.80% Fibonacci level at $3,693, followed by the critical resistance at $4,108.

Conversely, if bearish momentum continues below the local support trendline, Ethereum could test the $2,900 support level, followed by $2,850.