Cardano native tokens could be more financially rewarding than most think, according to a recent analysis claiming they can create millionaires.
Cardano (ADA) has not been performing very well for a while now, currently trading for $0.22 and down 32% this year. Amid suggestions that ADA could recover with the broader market, an unpopular opinion suggests that Cardano native tokens (CNTs) could be a more rewarding bet.
Key Points
Analysis claims that those who hold tokens based in the Cardano ecosystem are more likely to create wealth.
Cuadrado noted that 100,000 ADA in CNTs makes one closer to becoming a millionaire.
He reasons that the biggest wealth transfers don’t happen with large crypto assets, but rather with those building around them.
CNT Holders Closer to Becoming Millionaires
Dr. Cuadrado, a Cardano research and risk analyst, claimed in a recent X post that CNTs could be the real deal amid the broader market uncertainty. According to him, those who hold tokens based in the Cardano ecosystem are more likely to create wealth. In fact, the analyst noted that they are closer to being millionaires than most people think.
He highlighted 100,000 ADA worth of these assets as the magic number. Those who will invest in or have already bought this amount of CNTs could become rich, according to Cuadrado, who called his stance an “unpopular opinion.”
Meanwhile, he reasons that the biggest wealth transfers don’t happen with large crypto assets. They are already established, and their large market cap would somewhat limit how much they could grow in such a short time. That does not automatically make them unprofitable; it just means they will not benefit holders as much as smaller-cap tokens.
Cuadrado added that millionaires are created with assets built around these established cryptocurrencies. They act as a higher beta play, offering better portfolio upsides when the ecosystem they are building around gains momentum.
“Most people will understand that too late,” the analyst concluded.
The 100,000 ADA Experiment
Notably, 100,000 ADA has a dollar value of $22,400 at the current market price. At its 2021 peak and 2025 peak of $3.10 and $1.32, the same stash would be worth $310,000 and $132,000, respectively.
For this assessment, we will use Midnight (NIGHT) and Word Mobile Token (WMTX), the two largest CNTs in the current market. NIGHT trades at $0.0039 with a market cap of $650 million. WMTX is a multi-chain asset but is primarily native to Cardano. At the time of writing, it trades at $0.042 with a market cap of $36.3 million.
$22,400 will buy you 5.743 million NIGHT tokens at the current market price. The stash would be worth $1 million if the privacy token reaches $0.174. That is a 44.6x rally from the market price today, taking its market cap to $2.88 billion.
On the other hand, $22,400 will buy 533,333 WMTX. The token would need to reach a price of $1.875 for this stash to turn into $1 million, reflecting a market cap of $1.59 billion.
Meanwhile, ADA would need to reach $10 to turn 100,000 ADA into $1 million, taking its market cap to $360.2 billion. The analysis suggests it would be easier for NIGHT and WMTX to reach market caps of $2.88 billion and $1.59 billion than for ADA to reach $360.20 billion when bullish momentum escalates.
Nonetheless, a 4,364% growth for both NIGHT and WMTX remains a huge upside ask. Additionally, while small-cap tokens generally outperform large caps, tokens tied to a network would also need the broader ecosystem to be bullish. This means that ADA would need to be the first mover to spark an uptrend for tokens affiliated with it.
Community figure Eri has identified XRP as the important ingredient in a “crypto sandwich” setup amid calls to improve liquidity on the ledger.
The XRP community is now focusing on one issue they believe is important to the network’s future growth: liquidity. Several figures have recently stressed that stronger liquidity is necessary to help the XRP Ledger (XRPL) reach its full potential.
Key Points
Eri identified XRP as the center ingredient in a “crypto sandwich” setup for global remittances once liquidity issues are resolved.
Brett Mollin said liquidity is the biggest factor limiting the XRP Ledger’s next growth phase.
Ripple and the XRP Ledger Foundation are working to explore solutions for improving network liquidity.
Mollin said XRPL’s XRP-bridging mechanism can create unified liquidity across assets when implemented correctly.
XRP Within the “Crypto Sandwich” Setup
In a recent post on X, Eri, a prominent XRP community figure, called attention to comments from Brett Mollin, Executive Director of the XRP Ledger Foundation (XRPLF), who noted that liquidity was the biggest obstacle standing in the way of the ledger’s next phase of growth.
Notably, Eri argued that the infrastructure necessary for XRP-based global remittances is already in place and that the next step is to improve liquidity across the ecosystem. “It’s time to solve the liquidity,” she said, referencing Mollin’s point.
According to Eri, XRP now acts as the middle layer in a payment model where one fiat currency can be converted into crypto before being exchanged for another fiat currency.She called this model the “crypto sandwich” for global remittances and showed that XRPhas the most important part to play.
XRPLF Director Says Liquidity Is the Main Challenge
Her comments came in response to statements Mollin made in an X Spaces discussion hosted by XAO DAO in April. During the session, the host asked participants what they believed was preventing the XRP Ledger from entering its next major growth stage and who should be responsible for solving the problem.
Responding, Mollin said liquidity is the biggest issue holding the XRP Ledger back today. He explained that the network itself is performing well and is not facing any significant technical limitations.
According to Mollin, the ledger currently handles every transaction it receives without difficulty. He noted that transaction fees have not surged because of network congestion and that the XRPL continues to operate smoothly.
While he admitted that development efforts aim to prepare the network for future demand, the XRPL Foundation Director insisted that transaction capacity is not what is slowing growth.
According to him, liquidity remains the real challenge. He noted that increasing liquidity, much like attracting more users to the network, is a goal that benefits everyone in the ecosystem.
Ripple and the Foundation Working Toward Solutions
He stressed that although liquidity was not originally part of the XRP Ledger Foundation’s mission, solving the issue will require cooperation from multiple parties.
Mollin revealed that he has been working with Ripple to address the problem. He explained that the XRP Ledger Foundation’s actual role is to provide expertise on how the XRPL works and how its unique features can be used effectively.
Meanwhile, Mollin also pointed out that the XRPL does not need large liquidity pools between every pair of assets. Instead, liquidity can be built between individual assets and XRP, with the ledger automatically using XRP as a bridge between them.
According to Mollin, the XRP Ledger has an advantage over many other blockchains because it can maintain unified liquidity instead of fragmented pools when used correctly.
However, the system cannot support seamless cross-border payments between currencies such as U.S. dollars and Australian dollars if there is not enough liquidity available. Without this liquidity, XRP cannot fully perform its intended role as a bridge currency.
Community Calls for Increased Liquidity
Around the same time as Mollin’s remarks, Jake Claver, Chairman of DAG, argued that XRP must have deep liquidity to function effectively as a bridge asset for large financial institutions.
For XRP to work as a bridge currency between two banks settling a $50 million transaction, it needs enough liquidity in the pool to handle that transaction without moving the price
Ripple doesn't just want XRP to be valuable, they need it to be
According to him, XRP would need enough liquidity to support a $50 million transaction between two banks without causing major price fluctuations. “Ripple doesn’t just want XRP to be valuable, they need it to be,” he added.
Bitwise recently published a report examining Bitcoin’s performance in May.
The report noted that Bitcoin climbed above $80,000 during the month but struggled to maintain that level. After encountering strong resistance between $80,000 and $85,000, Bitcoin fell back toward $72,000 as ETF outflows increased and investor sentiment weakened.
Despite the pullback, Bitwise said the overall outlook for Bitcoin remains positive. The firm believes several long-term trends continue to strengthen the asset’s investment case.
Key Points
Bitcoin hit $83K in May but fell back to $72K after $1B ETP outflows hit sentiment.
Price failed to break $80K–$85K resistance, which is the key bull-bear zone by Bitwise.
Long-term holders now control 74% of supply, with record 14.85M BTC held inactive.
Bitwise says rising global debt risks and liquidity could become Bitcoin’s next big catalyst.
Bitcoin Rally Loses Momentum Above $80K
According to Bitwise, Bitcoin’s move above $80,000 was fueled by a short squeeze and improving on-chain data. The cryptocurrency briefly approached $83,000 and, at one point, outperformed U.S. stocks and gold.
The rally was supported by about $166.5 million in net inflows into Bitcoin ETPs. Long-term holders also accumulated roughly 125,000 BTC during the previous month.
However, the momentum faded later in May. Global Bitcoin ETPs recorded more than $1 billion in net outflows, leading to a sharp drop in sentiment.
After failing to break through the $80,000-$85,000 range, Bitcoin fell back to around $72,000. Bitwise described this area as the market’s key dividing line between bullish and bearish conditions.
Long-Term Holders Continue Accumulating
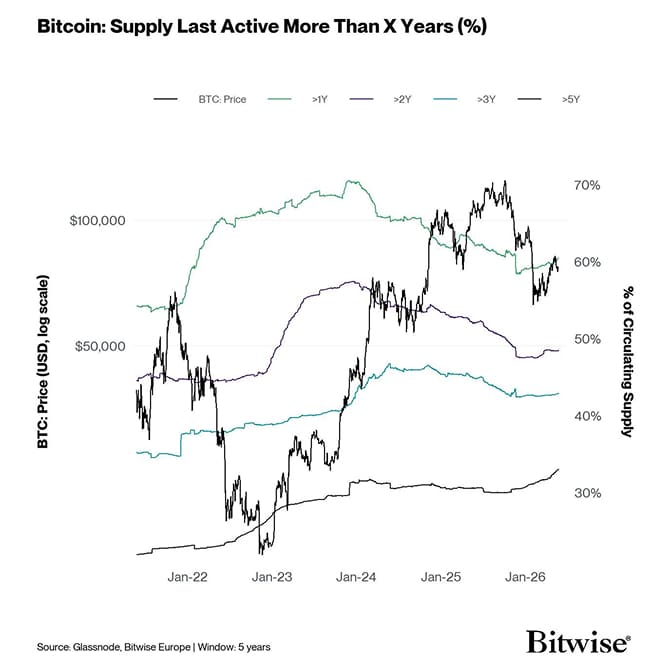
While demand has slowed, Bitwise highlighted a growing supply trend that could support Bitcoin over time. The amount of Bitcoin held by long-term investors reached a record 14.85 million BTC, equal to about 74.3% of the circulating supply.
The report said more coins are moving into the hands of investors who are unwilling to sell, even during periods of market volatility. Bitwise cited the following data:
60.5% of Bitcoin supply has not moved in more than one year.
48.5% has remained untouched for over two years.
42.9% has not moved for more than three years.
33% has stayed inactive for at least five years.
According to the firm, this growing trend of holding Bitcoin is tightening supply, even as demand remains relatively weak.
Sovereign Debt Problems to Benefit Bitcoin
A major theme in the report was rising pressure in global government bond markets.
Bitwise pointed to higher Japanese government bond yields, an estimated $29 trillion in global debt that must be refinanced in 2026, and warnings from the IMF that investors may become less willing to fund growing government debt.
The firm argued that worsening debt conditions could eventually support Bitcoin. If central banks respond with additional liquidity measures, Bitcoin could benefit.
Bitwise also described Bitcoin as a potential hedge against sovereign debt risks because it operates independently of governments and does not rely on a central issuer.
The report noted that Bitcoin has historically performed well when real interest rates decline. If inflation remains elevated while the Federal Reserve pauses rate hikes, real yields could fall and create a more favorable environment for Bitcoin.
Bitcoin Still Looks Cheap Compared to Big Tech
Despite recent volatility, Bitwise believes Bitcoin remains reasonably valued compared to major U.S. technology stocks.
The firm’s analysis showed Bitcoin’s market-value-to-realized-value (MVRV) ratio remains below its long-term average. Only 36% of historical readings have been lower. Meanwhile, the Nasdaq 100’s price-to-book ratio is near record highs.
Bitwise said this valuation gap could make Bitcoin more attractive if investors begin shifting money away from expensive technology stocks and into scarce assets such as Bitcoin.
Key Price Levels to Watch
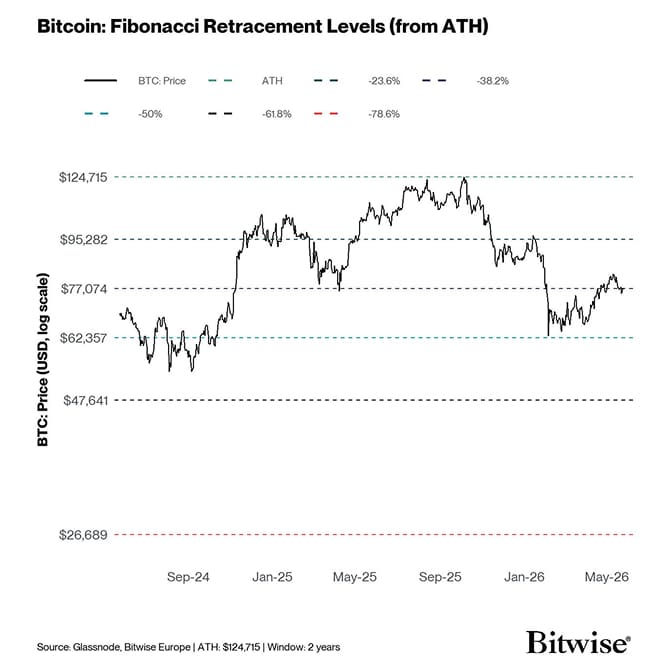
Bitwise said several indicators continue to point to the $78,000-$80,000 range as Bitcoin’s most important price zone. The report highlighted:
$78,000-$80,000 as the main bull-bear battleground.
$83,000-$85,000 as the first major resistance area.
$95,000 as the next major upside target.
$73,000 as a critical support level.
According to the firm, regaining the $78,000-$85,000 range could improve investor confidence and bring fresh capital back into the market.
Ultimately, Bitwise believes Bitcoin is currently in a delicate balance. Demand has weakened across spot, ETF, derivatives, and on-chain markets, while supply continues to tighten as more investors move coins into long-term storage.
Although macroeconomic pressures could weigh on prices in the short term, the firm argues that record levels of long-term holding, relatively low valuations, and growing sovereign debt concerns could help set the stage for Bitcoin’s next major rally.
Bitcoin’s price has fallen below the $72,000 region after reports revealed that BTC treasury giant Strategy sold more than 30 BTC for the first time since 2022.
The move has fueled speculation about whether the company will continue reducing its Bitcoin reserves or return to its aggressive accumulation strategy.
Key Points
Strategy sold 32 BTC worth approximately $2.47 million last week, marking the company’s first Bitcoin sale since 2022.
The company disposed of the Bitcoin at an average price of $77,135 per BTC.
Jim Cramer urged investors to reassess their Bitcoin outlook following Strategy’s unexpected BTC sale.
Meanwhile, Bitmine Immersion Technologies expanded its Ethereum holdings by purchasing an additional 26,497 ETH valued at approximately $52.6 million.
Strategy Sells 32 BTC for $2.5M
Michael Saylor’s Strategy has once again captured market attention with its latest Bitcoin activity. However, instead of adding to its holdings as usual, the company sold 32 BTC valued at approximately $2.47 million last week. Notably, Strategy sold the Bitcoin at an average price of $77,135 and used the proceeds to fund preferred stock distributions.
Although the sale represents only a tiny fraction of Strategy’s massive Bitcoin treasury, it immediately reignited debate across the crypto market about the company’s future accumulation plans.
Meanwhile, data from Lookonchain showed that Strategy last sold Bitcoin in December 2022, when it offloaded 704 BTC at around $16,776 per coin. Shortly afterward, the company reversed course and purchased 810 BTC just two days later at approximately $16,845 each, reinforcing investor confidence in its long-term Bitcoin strategy.
Jim Cramer Calls for Caution as Bitcoin Slumps Below $72K
Following reports of the latest sale, Bitcoin’s price slipped lower. The leading cryptocurrency had traded above $72,500 before news of the transaction spread across the market. However, BTC later dropped below the $72,000 mark. At press time, Bitcoin traded at $71,592, down 3.01% over the past 24 hours and 7.34% over the past week.
At the same time, Jim Cramer, host of CNBC’s Mad Money, suggested that investors may need to reassess their Bitcoin outlook following Strategy’s sale. According to Cramer, Strategy’s continuous Bitcoin purchases over the years helped strengthen bullish sentiment and sustain market momentum. Consequently, he argued that the company’s latest move could force some investors to rethink their pro-Bitcoin stance.
Bitmine Purchases 26,497 ETH
While some investors now question Strategy’s commitment to Bitcoin, Bitmine Immersion Technologies continues to expand its Ethereum exposure. The company, backed by Tom Lee, recently purchased an additional 26,497 Ethereum worth approximately $52.6 million.
As a result of the latest acquisition, Bitmine now holds roughly 5,416,901 ETH, valued at around $10.75 billion. Even though investors have started comparing Strategy’s Bitcoin approach with Bitmine’s Ethereum strategy, the two companies remain at very different stages.
Bitmine only began accumulating ETH last year, whereas Strategy has steadily built its Bitcoin treasury since 2020. Despite growing concerns surrounding the recent BTC sale, Strategy still ranks among the world’s largest institutional Bitcoin holders. The company currently controls 843,706 BTC, valued at approximately $63.86 billion.
The cryptocurrency market moves in cycles. Some periods are heavily marked by falling prices, weak sentiment, and declining participation. Others bring growing prices and valuations, renewed confidence, and increased activity across the entire sector. Market enthusiasts commonly refer to these powerful upward phases as bull runs.
A crypto bull run is one of the most closely watched events in the digital asset sector because it often creates wealth for holders and attracts attention from both retail and institutional participants. During these periods, leading crypto assets post substantial gains, while smaller cryptocurrencies frequently experience even larger percentage moves.
Understanding how bull runs begin, what drives them, and how different assets behave during these cycles can help market participants navigate future opportunities more effectively.
What Does a Crypto Bull Run Mean?
A crypto bull run refers to an extended period during which digital asset prices increase significantly. Unlike short-term rallies that may last only days or weeks, bull runs typically continue for several months and sometimes even years.
During a bull market, investor confidence steadily improves. Market participants become increasingly optimistic about future prices, resulting in higher demand for cryptocurrencies. As more capital enters the market, prices continue increasing, creating a self-reinforcing cycle of positive sentiment.
Bull runs rarely affect only one asset. While Bitcoin (BTC) often leads the initial move, other cryptocurrencies usually follow as enthusiasm spreads throughout the sector.
Historically, major bull runs have correlated with cyclical patterns, increased adoption, favorable economic conditions, technological advancements, and growing institutional participation.
How a Crypto Bull Run Starts
Bull runs do not begin overnight. They usually emerge after lengthy periods of consolidation or market weakness.
In many cases, Bitcoin leads this market phase. Typically, BTC has a four-year cycle, centered around its halving event. For the uninitiated, this event happens every 1,388 days on average, with the block mining reward slashed in half.
Using the average of the last four halvings and market cycles, there is typically a 521-day window between the Bitcoin bottom and the next halving. During this period, Bitcoin accumulates and sees slight market recovery attempts.
After the halving event, Bitcoin takes an average of 494 days to peak. This is the post-accumulation and price expansion phase to new all-time highs. After this, Bitcoin enters a corrective phase, taking an average of 383 days to bottom, as seen in the first three periods.
So, the bull run starts mainly between the late pre-halving period and after the event and lasts between 12 to 18 months. First, Bitcoin starts showing strength. As confidence returns, buyers gradually absorb selling pressure, allowing prices to establish higher lows and eventually break above important resistance levels.
Then, capital starts to rotate to large-cap assets like Ethereum, XRP, Solana, and BNB. Subsequently, the bullish momentum spreads across the entire market, with low–cap altcoins outperforming the major assets.
Major Signs of an Upcoming Crypto Bull Market
Several indicators have historically appeared before major bull runs.
The major indicator of a crypto bull run is the Bitcoin halving event. The asset has always reached a new all-time high after each halving event as supply tightens and sentiment turns positive. Notably, the only exception is the April 2024 event, where it reached new ATHs before and after. With its large market dominance, its bullish momentum eventually spreads across the broader crypto market.
Another important sign is increasing accumulation by long-term holders. When experienced market whales begin adding to their holdings massively during periods of uncertainty, it often reflects confidence in future price appreciation. Recently, the supply of long-term holders reached a new ATH of 74.3%, suggesting that these whales are buying the dip.
An additional key signal is improving market structure. Higher lows and higher highs typically indicate strengthening demand and a shift away from bearish conditions. Currently, BTC has been forming lower lows and lower highs on the weekly chart after its October 2025 peak, signaling weak momentum.
On-chain metrics can also provide valuable clues. Rising active addresses, increasing network activity, and declining exchange balances often suggest that investors are becoming more interested in the sector.
Institutional participation is another factor worth monitoring. Increased ETF inflows, corporate adoption, and growing involvement from financial institutions have historically supported stronger market conditions.
Over the past few weeks, crypto ETFs have been experiencing outflows in three consecutive weeks, with billions following out, suggesting the market is not in a bull season.
Sentiment indicators can offer additional confirmation. When fear begins fading, but excessive optimism has not yet emerged, the upside period is not far off. The Fear and Greed Index currently stands at 31, signaling that market participants are fearful.
Crypto Fear & Greed Index
Bitcoin’s Impact on a Crypto Bull Run
Bitcoin remains the dominant force in the digital asset market. As a result, its performance often determines the direction of the broader sector.
Historically, most bull runs have started with Bitcoin leading the way. Capital typically enters the largest cryptocurrency first because it is viewed as the most established and liquid asset within the market.
When Bitcoin begins moving higher, confidence spreads across the ecosystem. Investors who initially focused on Bitcoin often seek additional opportunities in other cryptocurrencies, creating broader market participation.
For instance, during the 2020/2021 bull cycle, Bitcoin rallied from around $3,880 in March 2020 to $65,000 in April 2021. Altcoins rose along, but it was after this high that they started outperforming Bitcoin. Eventually, the premier asset recovered to peak at $69,000 in November 2021, while other major assets rose far higher than their April peaks to new ATHs.
Bitcoin dominance can also influence market dynamics. During the early stages of a bull run, Bitcoin frequently outperforms alternative cryptocurrencies. Later in the cycle, capital often rotates into smaller assets as investors pursue higher-risk opportunities.
Because of this relationship, monitoring Bitcoin remains essential when evaluating the likelihood of a future bull market.
How Altcoins Perform During a Bull Run
Altcoins often experience some of their strongest performances during bull markets.
After Bitcoin establishes a clear uptrend, capital frequently flows into Ethereum and other large-cap cryptocurrencies. As confidence continues improving, attention gradually shifts toward mid-cap and smaller projects.
This rotation can create substantial gains across various sectors, including decentralized finance, gaming, artificial intelligence, infrastructure, and real-world asset projects.
However, not all altcoins perform equally. Projects with strong ecosystems, active development, and compelling use cases generally attract more attention during bullish periods. Each bull run has had a separate narrative making waves, and identifying it helps investors capture the buzz.
At the same time, volatility tends to increase. While altcoins can outperform Bitcoin during certain phases of a bull market, they often experience sharper corrections as well.
Key Factors That Drive Crypto Bull Runs
Several forces can contribute to the development of a sustained bull market.
Institutional adoption remains one of the most significant drivers. The introduction of regulated investment products, corporate treasury allocations, and broader financial industry participation can increase demand substantially. So far, the US Bitcoin ETFs have brought in over $55 billion in cumulative net inflow since their January 2024 launch despite recent outflows.
Technological innovation also plays an important role. New applications, improved scalability, and expanding use cases can attract both users and capital.
Macroeconomic conditions often influence market direction as well. Periods of monetary easing, lower interest rates, and improving liquidity have historically benefited risk assets. The crypto market rally has also aligned with the business cycle, where capital flow and employment rate are at their highs.
Regulatory clarity can further support market confidence. Clear rules often encourage broader participation from institutions and businesses that may have previously remained on the sidelines. It is due to this that industry leaders are pushing for the CLARITY Act in the US, a legislation tipped to support the next bull run.
Finally, market psychology cannot be ignored. The bull runs are often fueled by optimism, media attention, and increasing public interest, which can amplify upward momentum.
Bull Run vs Bear Market: What’s the Difference?
Bull markets and bear markets represent opposite phases of the market cycle.
A bull run is characterized by rising prices, improving sentiment, and increasing participation. Confidence generally remains high, and investors expect higher valuations in the future.
A bear market, on the other hand, involves declining prices, weaker sentiment, and reduced activity. Fear becomes dominant, and many participants focus on preserving capital rather than seeking new opportunities.
The 2022 Bitcoin market is a clear example. The coin peaked at $69,000 in November 2021 and slid 78% to its November 2022 bottom near $15,000. The Fear and Greed Index crashed to 6 during the Terra Crash that year and to 12 close to the bottom owing to the FTX implosion.
Meanwhile, the current market depicts a typical bear market. Bitcoin and the broader market have declined considerably from prior highs, long-term holders have stopped buying, and sentiment is extremely fearful.
Notably, these cycles are a natural part of financial markets. Neither phase lasts forever, and each eventually gives way to the other. Understanding where the market currently sits within the broader cycle can help investors make more informed decisions.
Which Cryptocurrencies to Buy for the Next Bull Run?
There is no single answer to this question because every market cycle unfolds differently.
Bitcoin remains the most widely followed cryptocurrency and often serves as the foundation of many portfolios due to its market leadership and institutional adoption.
Ethereum also attracts significant attention because of its role in decentralized applications and smart contract infrastructure. Its growing use case in the emerging RWA tokenization sector also increases its appeal
Beyond these established assets, investors frequently monitor sectors showing strong momentum. Real-world asset tokens like ONDO and XLM, artificial intelligence projects like NEAR and FET, gaming tokens like AXS and PORTAL, and scalability-focused ecosystems like ADA and SOL have all gained attention during recent market cycles.
Fundamentals matter. Projects with active ecosystems, clear use cases, and strong communities like XRP often perform better than those driven solely by speculation.
Ultimately, diversification and thorough research remain important considerations regardless of market conditions.
FAQs
What is the 30-day rule in crypto trading?
The term refers to tax-related rules governing the repurchase of assets within a specific timeframe after selling. In the UK, an investor cannot claim a tax loss for a position if they rebuy the sold asset within 30 days. It is often referred to as the “bed and breakfasting” rule. Notably, this does not apply to the US.
When should you sell crypto during a bull run?
Many investors use predetermined profit targets, portfolio rebalancing strategies, or technical indicators. While the best approach depends on individual goals and risk tolerance, on-chain metrics provide some pointers.
When the market enters a euphoric state, marked with extreme optimism after assets reach new all-time highs, data shows one should start employing their profit-taking strategy. Also, when search engine interest spikes, analysts often associate this with the entrance of retail traders, viewed as exit liquidity.
Is a bull run the best time to buy cryptocurrency?
Bull markets can offer strong momentum, but prices have grown significantly higher than during bearish periods. Analysts advise accumulating during periods of price weakness and taking profit at peak bull phases, rather than chasing rapidly rising prices then.
When is the next crypto bull run expected?
No one can predict the exact timing of future market cycles. Analysts typically monitor factors such as liquidity conditions, institutional adoption, on-chain metrics, and Bitcoin’s cyclical market structure for clues.
Meanwhile, historical data suggests that the market would likely bottom out in Q4 2026. Past events indicate the accumulation phase could start with a slight increase ahead of the 2028 halving event. The next bull phase could likely start afterward.
How high can Bitcoin go during a bull market?
There are no guaranteed uptrend targets for a bull run. Future performance will depend on market demand, macroeconomic conditions, adoption trends, and investor sentiment. For context, BTC rose over 9,000% post-2012 halving, 294% to its peak after the 2016 halving, and over 600% to its November 2021 high after the 2020 halving.
Nonetheless, there are predictions of a target range of $250,000 to $500,000 in the next bull run, with only a few outlooks foreseeing a higher price.
Which altcoins perform best during a crypto bull run?
Historically, projects with strong fundamentals, active ecosystems, and growing user adoption have tended to outperform weaker competitors. However, every market cycle produces different narratives and best performers.
Veteran trader Peter Brandt has surprised the crypto community by naming XRP as one of the strongest candidates for real-world transactional adoption.
Notably, the remark came during a recent episode of Crypto Banter hosted by Ran Neuner. Brandt was asked which cryptocurrency had the best chance of becoming a widely used transactional network. His response caught the host off guard.
“XRP probably is the best,” Brandt said. “Right now, if you had to bet on a horse to become transactional, it would probably be XRP, Solana, and ETH.”
The comment is notable because Brandt has spent years publicly criticizing the asset and its supporters.
Meanwhile, he added that he believes many cryptocurrencies will ultimately prove to be “junk”. However, he highlighted XRP, Solana, and Ethereum as the leading contenders for practical, transaction-focused use cases.
Key Points
Peter Brandt surprised the crypto community by naming XRP as the leading contender for transactional adoption.
Brandt said XRP, Solana, and Ethereum are the strongest candidates for real-world payment use cases.
Ran Neuner expressed shock at Brandt’s positive remarks, given his long history of criticizing XRP.
Despite past criticism, Brandt has occasionally praised XRP’s chart structure and long-term potential.
Ran Neuner Reacts to Unexpected XRP Endorsement
The comments gained attention after Crypto Banter Clips shared the segment on X with the caption: “Did He Say XRP?”
The account noted that even Neuner was surprised by Brandt’s answer. It said the veteran trader revealed what he believes is the best bet in crypto right now, and it was not the answer most viewers expected.
During the interview, Neuner openly acknowledged his surprise. He said he never imagined Brandt would speak positively about XRP. In his words:
“I didn’t imagine that Peter Brant would be talking about XRP, but I mean, you learn something new every day.”
XRP Community Highlights Brandt’s Shift
The remarks went viral within the XRP community. Prominent XRP commentator BankXRP highlighted the significance of the statement.
BankXRP noted that Brandt, who is known for calling major market tops and bottoms over several decades, had effectively chosen XRP as his preferred “horse” in the race for transactional crypto adoption.
For many XRP supporters, the comments represent one of Brandt’s most favorable public assessments of the asset in recent years.
Previous XRP Criticism
Brandt’s latest remarks contrast with many of his comments throughout 2025. In December 2025, he said no group of traders had been more easily baited than XRP and silver bulls.
In another post that same month, he described XRP and silver supporters as the “most madly obsessed perma-bulls on earth.”
He also argued that the most uneducated and biased permanent bulls he had encountered during his five decades of trading were those promoting silver and XRP.
In October 2025, concerning assets he would leave to his family, Brandt said XRP was the last thing they would want to inherit.
Brandt Previously Praised XRP’s Chart Structure
Despite his criticism of XRP holders, Brandt has occasionally expressed admiration for the asset’s technical setup.
In October 2025, he shared an XRP chart and said there had never been a “purer long-term chart.”
He also engaged XRP followers in April 2026 with a poll asking where the asset could find support in the bear market.
In sum, while Brandt has been largely critical of XRP and its holders, he still views the asset positively in certain respects.
XRPL has reached $400 million in tokenized real-world asset (RWA) value in just 15 months, significantly outpacing several major blockchain networks, including Ethereum.
Evernorth revealed this in a recent report, while XRP community commentator BankXRP amplified the findings across the crypto community. The comparison has drawn attention to XRPL’s accelerating tokenization activity and highlighted the network’s ability to scale at a pace comparable to some of the industry’s fastest-growing ecosystems.
Key Points
XRPL reached $400 million in tokenized real-world asset value within just 15 months.
It took Ethereum 36 months to achieve a similar milestone.
XRPL recorded 78% year-to-date growth in tokenized assets, rising from $227 million to $404 million.
The network currently ranks tenth globally in represented tokenized value, while Ethereum remains the market leader with $16.8 billion.
XRPL Hits $400M in Tokenized Value Faster Than Ethereum
The report compared how long major blockchain networks took to grow from $10 million to $400 million in tokenized asset value. According to the data, XRPL completed the milestone in just 15 months, whereas Ethereum required 36 months to achieve the same level.
Specifically, XRPL’s tokenized RWA market stood at approximately $10 million in January 2025. However, the valuation surged to $400 million by April 2026, allowing the network to accomplish the feat within 14.9 months.
In contrast, Ethereum’s tokenized RWA market measured around $10 million in September 2018 before eventually climbing to $400 million in September 2021, roughly 35.9 months later. Additionally, the data showed that XRPL outpaced Avalanche and Polygon by six and seven months, respectively.
XRPL Hits $400M in Tokenized Value Faster Than Ethereum
XRPL Outperforms Ethereum in YTD Growth
Furthermore, XRPL has also outperformed Ethereum in year-to-date tokenized asset growth. According to Evernorth, XRPL’s tokenized value increased by 78% this year, rising from $227 million to $404 million.
Meanwhile, Ethereum’s tokenized value grew by 36%, increasing from $13.8 billion to $18.66 billion during the same period. Notably, several other blockchain networks have also recorded strong tokenization growth in 2026.
Among blockchains with more than $200 million in tokenized assets, SEI leads with 858% year-to-date growth. Plume follows with 366%, while zkSync Era and Stellar recorded growth rates of 361% and 131%, respectively.
XRPL Outpeforms Ethereum in Tokenized Value Growth YTD
XRP Secures Top Position Among Enterprise-Focused Blockchain Networks
Meanwhile, XRPL has overtaken several enterprise-focused blockchain networks, including Aptos, Mantle, and Algorand. As of May 2025, XRPL ranked below those networks with a tokenized value of $116 million, while Aptos, Mantle, and Algorand stood at $120 million, $148 million, and $304 million, respectively.
However, the rankings have shifted significantly. XRPL now leads the group with $404 million in tokenized value, while Aptos and Algorand have declined to $64.9 million and $70.9 million, respectively. Although Mantle’s valuation climbed to $258 million, it remains below XRPL’s current level.
XRPL Tops Enterprise-focused chains in tokenized value
The development comes as competition intensifies among blockchain networks seeking dominance in the rapidly expanding tokenization market. According to data from RWA.xyz, XRPL currently ranks tenth globally in ‘represented’ tokenized value at $404.4 million. Nonetheless, Ethereum continues to dominate the sector with a tokenized valuation of $16.8 billion.
Despite Stellar’s recent surge, XRP community figure Chad Steingraber believes XLM still has a long way to go before matching XRP’s size.
In a recent post on X, Steingraber argued that XLM would need to rise roughly 10x from current levels to reach XRP’s market capitalization.
His comments come as XLM continues to outperform XRP in recent weeks. The rally follows growing excitement surrounding Stellar’s new alliance with the DTCC.
Key Points
XLM would need to rise about 10x from current levels to match XRP’s $80.6 billion market capitalization.
Steingraber argues the surge reflects anticipation rather than actual utility-driven demand for XLM.
Despite strong gains, XLM remains far smaller than XRP and would need to approach $2.50 to catch up.
XLM Rally Outpaces XRP
According to CoinMarketCap data, XLM is trading at $0.2539. The token is up 8.3% over the past 24 hours and 65% over the past week. Its market capitalization now stands at approximately $8.52 billion.
Meanwhile, XRP is trading at $1.30. It is down 2.5% on the day and 4.5% over the past seven days. XRP’s market capitalization is roughly $80.6 billion.
The gap between the two networks helps explain Steingraber’s estimate. XRP’s valuation is nearly 10 times larger than XLM’s. As a result, Stellar would need to approach the $2.50 price level to achieve a similar market cap.
DTCC Launch Fuels Speculation
Steingraber believes the current rally is being driven mainly by speculation ahead of Stellar’s upcoming DTCC-related rollout, rather than actual network utility.
According to him, XLM’s price could continue climbing throughout June as traders position themselves ahead of the launch.
“This is just the retail speculation phase of XLM, not the actual utility of XLM in DTCC.”
He added that trading activity tied to the initiative will initially be limited. As a result, utility-driven demand is likely to build gradually over the following months.
Utility Growth May Take Longer
Steingraber noted that the full impact of the DTCC integration may not be visible immediately after launch.
He expects utility adoption to expand steadily through the rest of 2026. Broader production use is currently set for October. He also pointed to a Stellar timeline that targets the first half of 2027 for the initiative to reach full scale.
Because of this, he believes the market is currently pricing in future expectations rather than realized usage.
XLM Turns Positive While XRP Struggles
Meanwhile, the performance gap between the two assets has become increasingly noticeable.
XLM’s year-to-date gains have climbed to about 25%. In contrast, XRP remains down roughly 30% over the same period.
The divergence has sparked debate among traders. Many are watching to see whether XRP could eventually catch up to XLM’s momentum, as both assets have a historical price correlation.
For now, Steingraber maintains that even after its recent surge, XLM remains far smaller than XRP. To catch up, XLM would need to climb toward $2.50 before the two networks could command similar market valuations.
XRP may be going through a prolonged accumulation phase similar to the one Tesla experienced before its historic breakout, according to analyst EGRAG.
In a recent post on X, EGRAG shared a chart comparing XRP’s current market structure with Tesla’s multi-year price action. He argued that if the fractal continues to play out, XRP’s recent sideways movement may not be a distribution phase. Instead, it could represent a period of “secular re-accumulation” before a major repricing event.
“Many sold TSLA during the boring phase right before exponential expansion began,” EGRAG wrote. He suggested that patient investors could be rewarded if XRP follows a similar path.
Key Points
Analyst EGRAG says XRP may be in a Tesla-like accumulation phase before a major price breakout.
Moon Lambo notes Tesla consolidated for seven years before its stock entered a powerful expansion phase.
XRP Ledger activity, tokenization efforts, and institutional participation continue to show growth.
Supporters believe XRP’s long consolidation could precede its next major move, though no outcome is guaranteed.
Tesla’s Seven-Year Consolidation Draws XRP Comparisons
The comparison gained more attention after crypto commentator and YouTuber Moon Lambo discussed the chart in a recent video.
According to Moon Lambo, Tesla spent roughly seven years consolidating after its 2013 breakout. The stock eventually entered a powerful expansion phase around 2020.
During much of that period, Tesla’s business fundamentals continued to improve. However, its stock price failed to reflect that growth.
Moon Lambo said XRP holders may find the situation familiar. He argued that markets often take years to recognize improving fundamentals. This can cause investors to question their conviction during long periods of sideways price action.
XRP Tesla stock comparison
While acknowledging that fractals are not always reliable forecasting tools, he said the broader lesson remains important. Strong fundamentals do not always lead to immediate price gains.
XRP Fundamentals Continue to Strengthen
Beyond the chart pattern, Moon Lambo pointed to what he described as growing evidence that XRP’s ecosystem is expanding despite years of relatively weak price performance.
He highlighted rising activity on the XRP Ledger, growing tokenization initiatives, and increasing total value locked across the network.
The commentator also pointed to institutional involvement around the XRP Ledger. This includes participation from major financial institutions in pilot programs focused on tokenization and settlement use cases.
According to Moon Lambo, these developments suggest that utility and adoption continue to grow. That is happening even as XRP remains well below the explosive gains many investors expected after previous bull market cycles.
Patience May Be the Key
Moon Lambo cautioned that fractals should not be viewed as guarantees. He also acknowledged that XRP remains a risky investment.
However, he argued that the asset’s growing utility and rising institutional interest provide reasons for long-term holders to stay optimistic.
He also noted that XRP’s massive rally during the 2017 bull market produced gains of tens of thousands of percent. As a result, the market may have needed an extended cooling-off period before establishing a new accumulation phase.
In sum, supporters of the bullish thesis believe XRP’s long consolidation period could resemble Tesla’s once-overlooked “boring” phase. That period ultimately came before one of the stock market’s most dramatic expansions.
Whether the fractal ultimately plays out remains uncertain. Still, the comparison continues to stir optimism.
A sudden price spike pushed Stellar’s XLM token above $2 on South Korea’s Upbit exchange following the asset’s recent rally.
The unusual market activity reignited speculation about XLM’s long-term growth potential, especially as the network continues to gain momentum through major institutional developments.
Key Points
Stellar’s native token briefly surged to $2.20 on South Korean crypto exchange Upbit.
Although the spike corrected almost immediately, enthusiasts are wondering whether XLM can attain the milestone in the future.
XLM currently trades at $0.2652 on Upbit, boasting a 24-hour volume of $147.81 million.
May 2026 represented one of Stellar’s strongest monthly performances, driven mainly by strong institutional interest from players like DTCC.
XLM Climbs Briefly to $2.2 on Upbit
Yesterday, XLM experienced an unusual market event after briefly surging to $2.20 on South Korean crypto exchange Upbit, despite trading near $0.25 on most global platforms at the time.
Although the price corrected almost immediately, the event attracted widespread attention from traders and analysts throughout the crypto community. While many market participants expressed surprise, others began speculating about whether Stellar could eventually “fill the wick,” meaning the asset could organically revisit the $2.20 level during a future market cycle.
XLM Price Glitch on Upbit
For context, extreme wick movements like this occur when liquidity becomes thin or when large buy orders temporarily overwhelm available sell pressure on an exchange. In addition, order books on regional trading platforms often differ significantly from broader global markets, allowing sudden price dislocations to emerge before quickly correcting.
XLM Price Corrects on Upbit
Meanwhile, XLM currently trades at $0.2652 on Upbit, while the exchange’s 24-hour trading volume for the token has climbed to $147.81 million. At the same time, the latest development comes as XLM continues to post strong price gains over the past week.
Notably, XLM delivered one of its strongest monthly performances in May 2026 as several institutional and ecosystem developments strengthened investor confidence and fueled the token’s rally.
Earlier in the month, Mesh integrated with Stellar as a settlement layer, while the blockchain’s development team activated Protocol 26, also known as Yardstick. Shortly afterward, Circle launched its Cross-Chain Transfer Protocol (CCTP) on Stellar mainnet.
Stellar Price Reaction to DTCC News
However, Stellar’s most significant milestone arrived on May 27, when DTCC announced plans to connect its tokenization infrastructure to the Stellar network.
Through the initiative, DTCC-custodied assets, including equities, ETFs, and U.S. Treasuries, could become available on Stellar in tokenized form by 2027. Since DTCC oversees more than $100 trillion in assets, the announcement marked one of Stellar’s largest institutional breakthroughs to date.
Following the news, XLM surged from $0.1469 to $0.2966, representing a gain of more than 101% within three days. Although the token has since retraced part of those gains and now trades around $0.26, market sentiment surrounding Stellar remains elevated.